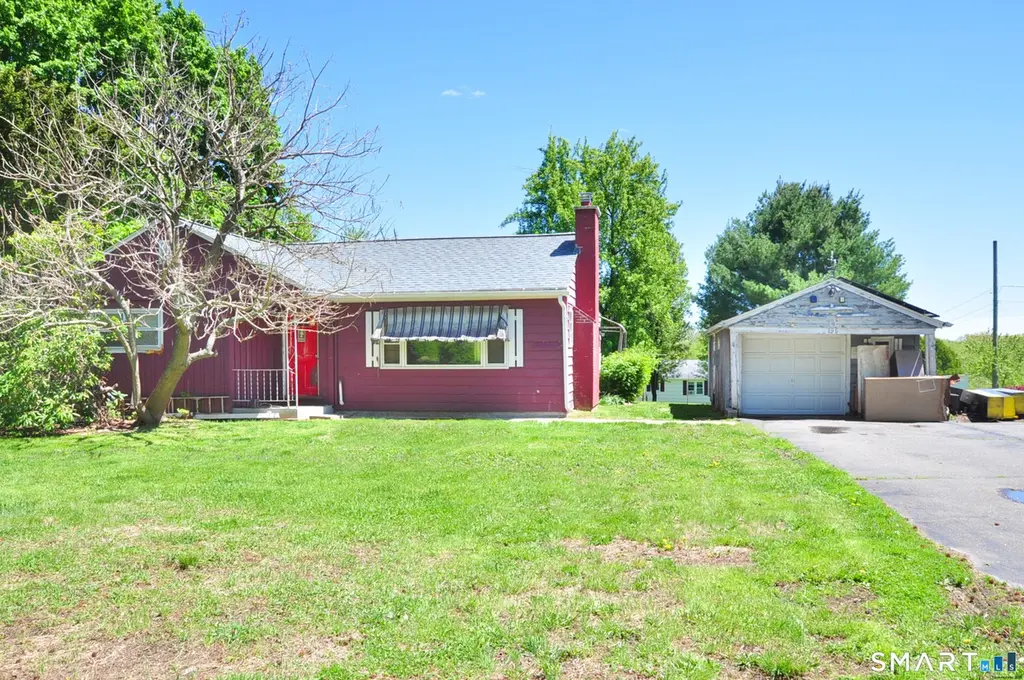
195 S Main St · East Granby, CT
Flood risk 1/10 · Minimal
- FEMA flood zone
- X (unshaded)
- Chance of flooding over 30 yrs
- 0.0%
- Est. flood insurance / yr
- $473 – $860
Fire risk 2/10 · Minimal
- Est. fire insurance / yr
- $829 – $1,539
Heat risk 4/10 · Minor
- Hot days now (above 97°F)
- 7 days/yr
- Hot days in 30 yrs
- 16 days/yr
Wind risk 6/10 · Moderate
- Chance of severe wind over 30 yrs
- 27.0%
Air-quality risk 3/10 · Minor
- Unhealthy air days now
- 2 days/yr
- Unhealthy air days in 30 yrs
- 3 days/yr
Risk factors via First Street. Map © Google.
Why this score? — see what drove the B- grade
The composite is a weighted blend of 9 inputs, each scored 0–100. Each bar is that input's sub-score; the figure is the points it added to the 100-point composite (weight × sub-score).
- Cash flow +24.7/30.0
- ARV discount +15.0/15.0
- DSCR +8.0/10.0
- 1% rule +7.3/10.0
- Schools +5.2/10.0
- Rent growth +2.5/5.0
- Livability +2.5/5.0
- Condition / age +2.5/5.0
- Appreciation +0.0/10.0
$199,900
🖨 Deal sheet (PDF) 📄 Offer letter ✓ Due diligence
Listing remarks MLS
Wow- lower price than many condo units - don't miss this amazing opportunity to own your own home at such an amazingly low price point -handy man special!! Newer furnace. Updated electrical panel. Being sold as-is. Hartford gun club within mile radius.
Key facts
- Brand new roof
- Flexible layout
- Newer septic tank
Tags
Property features AI
Exterior
- Parking: Detached garage (1-car)
- Utilities: Private well water; Septic system; Domestic hot water
- Home design: Single-family home
- Construction: Frame construction; Concrete foundation; Red exterior color
- Exterior features: Corner lot; Underground utilities; Clapboard siding; Asphalt shingle roof
Interior
- Kitchen: Oven/Range; Refrigerator
- Bedrooms: 3 bedrooms
- Bathrooms: 1 full bathroom
- Heating & cooling: Hot water heating; Oil-fired heat; Fuel tank located in basement; Active solar
- Interior features: Total of 6 rooms; Mud room; Full, unfinished basement; Has attic with crawl space and hatch access; One fireplace
- Laundry & utility: Laundry room on lower level
Neighborhood map
What this means for you Summary
Snapshot
- This is a 3-bed/1.0-bath single-family listed at $200k.
Deal economics
- At list price, monthly cash flow is $417 ($5k/yr) — positive.
- The deal already cash-flows at list — no discount required.
- Meets the 1% rule at list price ($2k rent vs $200k).
Location & tenants
- Location reads: area grade B — affects rentability + tenant quality, not the cash-flow math above.
- East Granby School District (rural): math 51% / reading 64% proficiency, ranked #54 of 153 in CT (top 35%) — acceptable for families but not a draw, mixed tenant base, ~2y average lease; only 8% free/reduced lunch — higher-income household profile.
- Market conditions: 26 active listings in the ZIP; 1,867 units permitted in Capitol Planning Region in 2024 (1,399 in 5+ unit buildings).
Forward outlook
- Local home prices are declining (-3.0%/yr); year-one equity from $1k of loan paydown is wiped out by about $6k of value loss. Plan a longer hold.
Negotiation context
- Only 6 days on market — expect competitive offers; lowballing is unlikely to land.
- 4 sale attempts since 16y ago with the ask held roughly flat each time — persistent listings suggest the price (not the market) is what's stuck; bring a comps-based counter.
- Current owner paid $165k; 21% above their basis — modest negotiation headroom, anchor on the comps not their cost.
Risks & watch-outs
- Watch-outs: built in 1952 — expect roof / HVAC / electrical / plumbing capex.
- Climate carrying-cost: major wind risk, 27% chance of damaging wind over 30y — expect insurance premiums to compound above CPI over the hold.
Questions for the listing agent
- Built in 1952 — when were the roof, HVAC, electrical panel, plumbing, and water heater last replaced?
- Is there a deadline driving the sale (1031 exchange, divorce, estate, relocation)? That informs how much negotiation room exists.
- What's the average days-on-market for RENTAL listings here right now (not sales)? A rising rental-DOM trend means longer vacancies and softer asking-rent achievability than the comps imply.
- What's the recent tenant-quality profile in this submarket — average credit score on applications, eviction rate, late-payment / NSF rate, and stable-employment percentage? A property-management company in the area should have these aggregated.
- How much new for-sale + rental construction is in the pipeline within 1–3 miles? Heavy new supply typically softens prices + rents 12–24 months out; constrained supply supports both.
Investment metrics
- 1% rule
- 1.23% ✓
- Cap rate
- 8.80%
- Cash-on-cash
- 8.94%
- DSCR
- 1.40
- GRM
- 6.8
CMA / ARV
- ARV (median comp)
- $317,645
- List price
- $199,900
- Delta
- -37.07%
- Verdict
- UNDERPRICED
- Comps
- 8 within 1.0 mi
Projected returns pro-forma
-3.0% appreciation · 3.0% rent growth · sell at horizon
- IRR
- -2.7%
- Equity multiple
- 0.90×
- Total profit
- $-5,704
- Equity at exit
- $29,806
- IRR
- 7.1%
- Equity multiple
- 1.53×
- Total profit
- $29,758
- Equity at exit
- $17,284
Cash invested: $55,972 (down + closing). Projections, not guarantees.
Landlord ↔ Tenant lean methodology
- Overall (STATE)
- 27 Tenant-Leaning
- State Connecticut
- 27 Tenant-Leaning · D+7
- County
- — inherits STATE
- City
- — inherits STATE
ZIP-level market 06026
- Home prices YoY
- -18.4%
- Active inventory
- 26
- Price-to-rent
- 6.8×
Monthly cashflow live
- Estimated rent
- $2,467 medium interval (Pro) →
- Mortgage (P&I)
- −$1,048
- Tax from tax record
- −$400 /mo · $4,804/yr
- Insurance
- −$83
- HOA
- −$0
- Vacancy / Maint / Mgmt
- −$518
- Net cashflow
- $417
Break-even live
Sensitivity live
| Price | -10% $530 | -5% $474 | +0% $417 | +5% $360 | +10% $304 |
|---|---|---|---|---|---|
| Rent | -10% $222 | -5% $320 | +0% $417 | +5% $514 | +10% $612 |
| Rate | -1.0pp $518 | -0.5pp $468 | base $417 | +0.5pp $365 | +1.0pp $312 |
UW: 25.0% down · 7.5% · 30yr · 1.5% tax · 5.0% vac · 8.0% maint · 8.0% mgmt
Financing live
Cash to close
- Down payment
- $49,975
- Closing costs
- $5,997
- Reserves months
- —
- Total cash needed
- —
Loan-product check · same deal, 3 products live
Conventional
25% down · 7.5% · 30yr
- Down + closing
- —
- Monthly P&I
- —
- Monthly cashflow
- —
- DSCR
- —
- Eligible?
- —
Personal DTI + credit; lowest rate.
DSCR
20% down · 8.5% · 30yr
- Down + closing
- —
- Monthly P&I
- —
- Monthly cashflow
- —
- DSCR
- —
- Eligible?
- —
No personal income docs; deal must DSCR.
Hard money
10% down · 12.0% · 12mo
- Down + closing
- —
- Monthly P&I
- —
- Monthly cashflow
- —
- DSCR
- —
- Eligible?
- —
Short-term bridge; refi at stabilization.
Listing history 8 events
-
2026-06-07statusdays on market $199,900 Active 6 DOM
-
2026-05-18status Under Contract 765-char remark
-
2026-05-13$199,900 Active 765-char remark
-
2014-08-29historical
-
2014-06-23$119,900
-
2010-12-20soldstatus $165,000
-
2010-12-13soldstatus $165,000
Show marketing remark (252 chars)
Wow- lower price than many condo units - don't miss this amazing opportunity to own your own home at such an amazingly low price point -handy man special!! Newer furnace. Updated electrical panel. Being sold as-is. Hartford gun club within mile radius.
-
2010-04-18$165,000
Show marketing remark (252 chars)
Wow- lower price than many condo units - don't miss this amazing opportunity to own your own home at such an amazingly low price point -handy man special!! Newer furnace. Updated electrical panel. Being sold as-is. Hartford gun club within mile radius.
ⓘ Source: listings_history table (triggers on properties + properties_extension) + one-shot
backfill from property_details.listing_events for pre-trigger history.
Tax reassessment forecast CT · Partial reset (capped growth)
- Current annual tax
- $4,804 · $400/mo
- Projected year-2 tax
- $4,804 · $400/mo
- Expected delta
- $0/yr ($0/mo · 0.0%)
ⓘ Screening estimate from a state-policy table — verify with the county assessor before closing.
Climate risk First Street
- Flood 1/10 Low FEMA zone X (unshaded) · 0% chance over 30 yrs
- Wildfire 2/10 Low
- Heat 4/10 Moderate 7 d/yr ≥97°F today · 16 d/yr by 30 yrs out
- Wind 6/10 Major 27% chance of damaging wind over 30 yrs
- Air quality 3/10 Moderate 2 unhealthy d/yr today · 3 by 30 yrs out
Nearby sold comps map
Loading sold comps map…
Walkable amenities ~0.75 mi
Loading nearby amenities…
Taxation est. · year 1
- Rental income
- $29,604
- − Mortgage interest
- −$11,198
- − Property taxes
- −$4,804
- − Insurance
- −$1,000
- − Repairs & maintenance
- −$2,368
- − Management
- −$2,368
- − Depreciation
- −$5,815
- Taxable income
- $2,051
- Est. tax owed @ 24.0%
- −$492
- After-tax cash flow
- $4,512/yr
For passive investors: Depreciation is non-cash, so a rental often shows a tax loss while cash-flowing — sheltering income. Rental losses are passive: they offset passive income freely, and up to $25,000/yr can offset ordinary (W-2) income if you actively participate and your MAGI is under $100k (phasing out to $0 by $150k); unused losses carry forward. On sale, claimed depreciation is recaptured at up to 25%, and gains may owe capital-gains tax (a 1031 exchange can defer both). Figures are a year-1 estimate at your 24.0% rate — not tax advice; consult a CPA.
Schools (NCES district)
- District
- East Granby School District
- NCES district ID
- 0901170
- Math proficiency
- 51% ▼ -14.00%
- Reading proficiency
- 64% ▼ -9.00%
- Median HH income
- $78,289
- Composite
- 51.66/100
- National rank
- #1695
- State rank
- #54 of 153 in CT
Livability — East Granby
No livability data for this city. (Only ~50 U.S. cities are tracked.)
Census & demographics
- Population (ZIP)
- 5,176
Population outlook (Capitol County) Hauer SSP2
- By 2040
- 1,063,519
Race, ethnicity, and origin ACS 2023
- Neighborhood character
- Predominantly White (77%)
- Race & ethnicity
- White 77% Two or more races 9% Hispanic / Latino 6% Black 4% Asian 3%
- Hispanic origin (detail)
- Puerto Rican 3%
- Common ancestry
- Romanian 7% Portuguese 3% Slovak 2%
- Foreign-born
- 10% · Canada, China, South Korea
- Languages at home
- 86% English-only · Spanish 5% Other Asian/Pacific 2% French/Haitian/Cajun 2%
Political lean MEDSL · Capitol
- 2024 margin
- Strong D (+21.9) · D 60.1% · R 38.2% · Other 1.7%
- All cycles
- 2024: D+21.9
Not yet ingested
- Civics
- —
Market trends
- HPI YoY
- ▼ -52.66%
- Current HPI
- 234.323
- Rent YoY
- —
- Metro
- —
- State GDP YoY
- ▲ 1.06%
- F500 in state
- 38
Industry mix (Fortune 500 HQ in CT)
| Industry | F500 HQs | Revenue |
|---|---|---|
| Industrial Machinery | 4 | $38B |
|
||
| Insurance | 3 | $71B |
|
||
| Financial Services | 2 | $25B |
|
||
| Transportation / Logistics | 2 | $18B |
|
||
| Healthcare | 1 | $247B |
|
||
| Telecommunications | 1 | $55B |
|
||
Price history
+21.2% since first listed10 events — show timeline
- 2026-06-06 Relisted — Smart MLS
- 2026-06-06 Listing Removed — Smart MLS
- 2026-06-06 Listing Removed — Smart MLS
- 2026-05-18 Pending — Smart MLS
- 2026-05-13 Listed $199,900 Smart MLS
- 2014-08-29 Listing Removed — Smart MLS
- 2014-06-23 Listed $119,900 Smart MLS
- 2010-12-20 Sold (Public Records) $165,000 Public Records
- 2010-12-13 Sold (MLS) $165,000 Smart MLS
- 2010-04-18 Listed $165,000 Smart MLS
Property tax history
+1.6%/yrLatest (2025): $4,804 · +2.3% YoY. Source: county tax records.
Cash-flow waterfall
monthlySold comps — $/sqft
last 12 mo · ≤1 miLoading sold comps…