2176 Alabama Ter · Quenemo, KS
Flood risk 1/10 · Minimal
- FEMA flood zone
- X (unshaded)
- Chance of flooding over 30 yrs
- 0.0%
- Est. flood insurance / yr
- $507 – $1,088
Fire risk 6/10 · Moderate
- Est. fire insurance / yr
- $1,154 – $2,142
Heat risk 4/10 · Minor
- Hot days now (above 107°F)
- 7 days/yr
- Hot days in 30 yrs
- 17 days/yr
Wind risk 2/10 · Minimal
- Chance of severe wind over 30 yrs
- —
Air-quality risk 2/10 · Minimal
- Unhealthy air days now
- 1 days/yr
- Unhealthy air days in 30 yrs
- 1 days/yr
Risk factors via First Street. Map © Google.
Why this score? — see what drove the B+ grade
The composite is a weighted blend of 9 inputs, each scored 0–100. Each bar is that input's sub-score; the figure is the points it added to the 100-point composite (weight × sub-score).
- Cash flow +28.8/30.0
- DSCR +10.0/10.0
- Appreciation +10.0/10.0
- 1% rule +9.1/10.0
- ARV discount +7.5/15.0
- Livability +3.1/5.0
- Schools +2.8/10.0
- Rent growth +2.5/5.0
- Condition / age +2.5/5.0
$75,000
🖨 Deal sheet (PDF) 📄 Offer letter ✓ Due diligence
Listing remarks
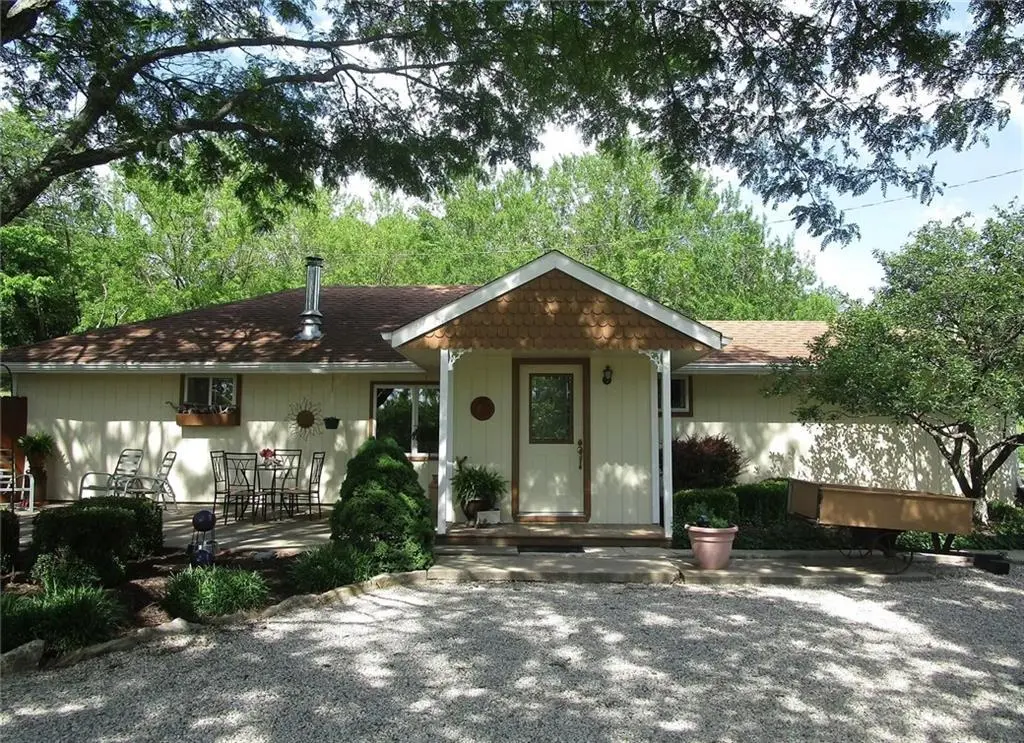
NOT A FORECLOSURE! This property is being offered by a private owner at Auction. The asking price is the starting Bid, it will Sell for a Higher Price. The Real Estate Auction is Saturday July 11th, 2026 @ 11:00AM. 1282 sq. ft. Earth contact home on 17.3 acres 3 bedrooms, 1 bath, 40'x 28' detached garage built in 1974 spacious yard, pond, and thick woods for wild life
Key facts
- 17.3 acre lot
- 2 garage spots
- Built 1987
Property features AI
Finance
- Other: Property type: Residential; Property subtype: Single Family Residence
- Financial info: No investor or income/expense details provided
- HOA & community: No association fees
Exterior
- Parking: Detached 2-car garage
- Security: No security details provided
- Utilities: Well water; Septic tank
- Home design: Single-family residence; Ranch floor plan; Living area approximately 1,282 above-grade square feet
- Construction: Stone veneer exterior; Composition roof; Slab foundation; Home age: 31–40 years
- Exterior features: Acreage lot (17.3 acres)
Interior
- Kitchen: No kitchen appliance details provided
- Bedrooms: 3 bedrooms; Primary bedroom on the main floor; Additional main floor bedroom
- Flooring: No flooring details provided
- Bathrooms: 1 full bathroom
- Heating & cooling: Forced air heating; Electric cooling
- Interior features: Wood-burning stove fireplace (1)
- Laundry & utility: Laundry located on the bedroom level
Neighborhood map
What this means for you Summary
Snapshot
- This is a 3-bed/1.0-bath single-family listed at $75k.
Deal economics
- At list price, monthly cash flow is $252 ($3k/yr) — positive.
- The deal already cash-flows at list — no discount required.
- Meets the 1% rule at list price ($1k rent vs $75k).
- Recommended offer: $73k (3.0% below list) — sets the bar for market timing.
Location & tenants
- Location reads 62/100 on livability (#383 in KS) — a middle-class / working-renter tenant base. Strengths: cost of living A+, health & safety A+, housing A; Watch: schools C-, employment D, crime F.
- Marais Des Cygnes Valley (rural): math 35% / reading 25% proficiency, ranked #173 of 280 in KS (top 62%) — families likely to look elsewhere, expect single-tenant / working-renter base with shorter leases.
- Market conditions: 13 active listings in the ZIP; 85 units permitted in Franklin County in 2024 (0 in 5+ unit buildings).
Forward outlook
- In year one you build about $8k of equity ($519 loan paydown + $8k appreciation (10.0% local appreciation)).
- Franklin County population projected at -17% by 2050 — secular population decline; favor cash flow + early exit over multi-decade hold.
- At projected returns (10.0% appreciation + 3.0% rent growth), your $21k cash investment doubles in ~2 years — after that, you're playing with house money.
- By year 5, paydown + projected appreciation supports a ~$37k cash-out refi (75% LTV) — recoverable capital for the next deal without selling this one.
Negotiation context
- It's been on market 38 days — a 3% lower offer ($73k) is reasonable based on typical stale-listing flexibility.
Risks & watch-outs
- Watch-outs: property tax is 2.6% of price.
- Climate carrying-cost: major wildfire risk — expect insurance premiums to compound above CPI over the hold.
Questions for the listing agent
- It's been on market 38 days. Have you received any prior offers? Is the seller open to a 3% concession, seller financing, or rate buy-down credit?
- Property tax is high relative to price — has the assessment been appealed recently, and will the sale trigger a re-assessment?
- Is there a deadline driving the sale (1031 exchange, divorce, estate, relocation)? That informs how much negotiation room exists.
- Crime grade is F in this area — have there been break-ins, vandalism, or insurance claims at this property in the last 3 years? What carrier currently insures it and at what premium?
- What's the average days-on-market for RENTAL listings here right now (not sales)? A rising rental-DOM trend means longer vacancies and softer asking-rent achievability than the comps imply.
- What's the recent tenant-quality profile in this submarket — average credit score on applications, eviction rate, late-payment / NSF rate, and stable-employment percentage? A property-management company in the area should have these aggregated.
- How much new for-sale + rental construction is in the pipeline within 1–3 miles? Heavy new supply typically softens prices + rents 12–24 months out; constrained supply supports both.
Investment metrics
- 1% rule
- 1.41% ✓
- Cap rate
- 10.33%
- Cash-on-cash
- 14.42%
- DSCR
- 1.64
- GRM
- 5.9
CMA / ARV
No comps found within radius.
Projected returns pro-forma
10.0% appreciation · 3.0% rent growth · sell at horizon
- IRR
- 34.9%
- Equity multiple
- 3.71×
- Total profit
- $56,980
- Equity at exit
- $67,566
- IRR
- 30.1%
- Equity multiple
- 8.39×
- Total profit
- $155,270
- Equity at exit
- $145,709
Cash invested: $21,000 (down + closing). Projections, not guarantees.
Landlord ↔ Tenant lean methodology
- Overall (STATE)
- 83 Strongly Landlord-Friendly
- State Kansas
- 83 Strongly Landlord-Friendly · R+10
- County
- — inherits STATE
- City
- — inherits STATE
ZIP-level market 66528
- Home prices YoY
- 3.7%
- Active inventory
- 13
- Price-to-rent
- 5.9×
Monthly cashflow live
- Estimated rent
- $1,061 medium interval (Pro) →
- Mortgage (P&I)
- −$393
- Tax from tax record
- −$161 /mo · $1,933/yr
- Insurance
- −$31
- HOA
- −$0
- Vacancy / Maint / Mgmt
- −$223
- Net cashflow
- $252
Break-even live
Sensitivity live
| Price | -10% $295 | -5% $274 | +0% $252 | +5% $231 | +10% $210 |
|---|---|---|---|---|---|
| Rent | -10% $169 | -5% $211 | +0% $252 | +5% $294 | +10% $336 |
| Rate | -1.0pp $290 | -0.5pp $271 | base $252 | +0.5pp $233 | +1.0pp $213 |
UW: 25.0% down · 7.5% · 30yr · 1.5% tax · 5.0% vac · 8.0% maint · 8.0% mgmt
Financing live
Cash to close
- Down payment
- $18,750
- Closing costs
- $2,250
- Reserves months
- —
- Total cash needed
- —
Loan-product check · same deal, 3 products live
Conventional
25% down · 7.5% · 30yr
- Down + closing
- —
- Monthly P&I
- —
- Monthly cashflow
- —
- DSCR
- —
- Eligible?
- —
Personal DTI + credit; lowest rate.
DSCR
20% down · 8.5% · 30yr
- Down + closing
- —
- Monthly P&I
- —
- Monthly cashflow
- —
- DSCR
- —
- Eligible?
- —
No personal income docs; deal must DSCR.
Hard money
10% down · 12.0% · 12mo
- Down + closing
- —
- Monthly P&I
- —
- Monthly cashflow
- —
- DSCR
- —
- Eligible?
- —
Short-term bridge; refi at stabilization.
Listing history 19 events
-
2026-06-21days on market $75,000 Active 38 DOM
-
2026-06-18days on market $75,000 Active 36 DOM
-
2026-06-17remarks 370-char remark
-
2026-06-17days on market $75,000 Active 35 DOM
-
2026-06-17price $75,000 Active 34 DOM
-
2026-06-16days on market $100,000 Active 34 DOM
-
2026-06-15days on market $100,000 Active 33 DOM
-
2026-06-13days on market $100,000 Active 31 DOM
-
2026-06-12days on market $100,000 Active 30 DOM
-
2026-06-09days on market $100,000 Active 27 DOM
-
2026-06-08days on market $100,000 Active 26 DOM
-
2026-06-07days on market $100,000 Active 25 DOM
-
2026-06-05days on market $100,000 Active 23 DOM
-
2026-06-04days on market $100,000 Active 21 DOM
-
2026-06-02days on market $100,000 Active 20 DOM
-
2026-06-01days on market $100,000 Active 19 DOM
-
2026-05-31days on market $100,000 Active 18 DOM
-
2026-05-31days on market $100,000 Active 17 DOM
-
2026-05-12$100,000 Active
ⓘ Source: listings_history table (triggers on properties + properties_extension) + one-shot
backfill from property_details.listing_events for pre-trigger history.
Tax reassessment forecast KS · Resets to sale price
- Current annual tax
- $1,933 · $161/mo
- Projected year-2 tax
- $1,933 · $161/mo
- Expected delta
- $0/yr ($0/mo · 0.0%)
ⓘ Screening estimate from a state-policy table — verify with the county assessor before closing.
Climate risk First Street
- Flood 1/10 Low FEMA zone X (unshaded) · 0% chance over 30 yrs
- Wildfire 6/10 Major
- Heat 4/10 Moderate 7 d/yr ≥107°F today · 17 d/yr by 30 yrs out
- Wind 2/10 Low
- Air quality 2/10 Low 1 unhealthy d/yr today · 1 by 30 yrs out
Nearby sold comps map
Loading sold comps map…
Walkable amenities ~0.75 mi
Loading nearby amenities…
Taxation est. · year 1
- Rental income
- $12,729
- − Mortgage interest
- −$4,201
- − Property taxes
- −$1,933
- − Insurance
- −$375
- − Repairs & maintenance
- −$1,018
- − Management
- −$1,018
- − Depreciation
- −$2,182
- Taxable income
- $2,002
- Est. tax owed @ 24.0%
- −$480
- After-tax cash flow
- $2,548/yr
For passive investors: Depreciation is non-cash, so a rental often shows a tax loss while cash-flowing — sheltering income. Rental losses are passive: they offset passive income freely, and up to $25,000/yr can offset ordinary (W-2) income if you actively participate and your MAGI is under $100k (phasing out to $0 by $150k); unused losses carry forward. On sale, claimed depreciation is recaptured at up to 25%, and gains may owe capital-gains tax (a 1031 exchange can defer both). Figures are a year-1 estimate at your 24.0% rate — not tax advice; consult a CPA.
Schools (NCES district)
- District
- Marais Des Cygnes Valley
- NCES district ID
- 2009480
- Math proficiency
- 35% ▼ -20.00%
- Reading proficiency
- 25% ▼ -20.00%
- Median HH income
- $41,267
- Composite
- 28.22/100
- National rank
- #12177
- State rank
- #173 of 280 in KS
Livability — Quenemo
- Score
- 62/100
- State rank
- #383
- US rank
- #16988
Category grades
Schools grade is shown separately in the Schools card above.
Census & demographics
- Population (ZIP)
- 876
Population outlook (Franklin County) Hauer SSP2
- Today (2025)
- 24,777 people
- By 2030
- 24,116 · -2.7%
- By 2040
- 22,426 · -9.5%
- By 2050
- 20,555 · -17.0%
- By 2075
- 17,149 · -30.8%
- By 2100
- 14,526 · -41.4%
Race, ethnicity, and origin ACS 2023
- Neighborhood character
- Predominantly White (92%)
- Race & ethnicity
- White 92% Black 3% Hispanic / Latino 3% Two or more races 3%
- Common ancestry
- Italian 17% Lithuanian 1%
- Languages at home
- 98% English-only · German/W. Germanic 2%
Political lean MEDSL · Franklin
- 2024 margin
- Solid R (+40.1) · D 28.9% · R 69.0% · Other 2.0%
- 2008→2024 swing
- -17.6pp toward R · 2008: -22.5pp · 2024: -40.1pp
- All cycles
- 2024: R+40.1 2020: R+38.4 2016: R+39.4 2012: R+30.4 2008: R+22.5
Not yet ingested
- Civics
- —
Market trends
- HPI YoY
- ▲ 10.42%
- Current HPI
- 288.9546
- Rent YoY
- —
- Metro
- —
- State GDP YoY
- —
- F500 in state
- 0
Price history
1 event — show timeline
- 2026-05-12 Listed $100,000 Heartland MLS as Distributed by MLS Grid
Property tax history
+7.3%/yrLatest (2025): $1,933 · +1.5% YoY. Source: county tax records.
Cash-flow waterfall
monthlySold comps — $/sqft
last 12 mo · ≤1 miLoading sold comps…