 6-Plex
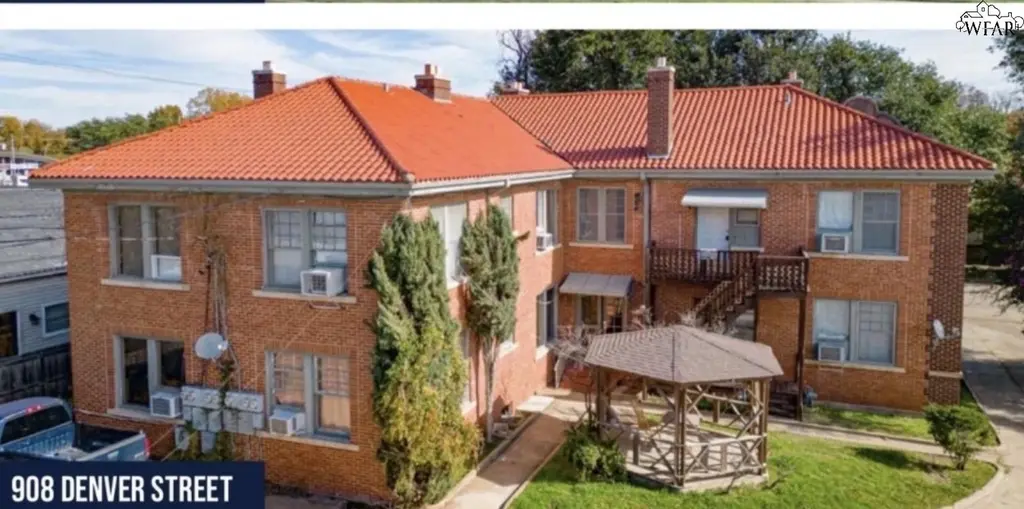
908 Denver St · Wichita Falls, TX
Flood risk 1/10 · Minimal
- FEMA flood zone
- X (unshaded)
- Chance of flooding over 30 yrs
- 0.0%
- Est. flood insurance / yr
- $507 – $1,088
Fire risk 2/10 · Minimal
- Est. fire insurance / yr
- $1,222 – $2,270
Heat risk 7/10 · Major
- Hot days now (above 109°F)
- 7 days/yr
- Hot days in 30 yrs
- 20 days/yr
Wind risk 4/10 · Minor
- Chance of severe wind over 30 yrs
- 8.0%
Air-quality risk 1/10 · Minimal
- Unhealthy air days now
- 0 days/yr
- Unhealthy air days in 30 yrs
- 0 days/yr
Risk factors via First Street. Map © Google.
Why this score? — see what drove the C+ grade
The composite is a weighted blend of 9 inputs, each scored 0–100. Each bar is that input's sub-score; the figure is the points it added to the 100-point composite (weight × sub-score).
- Cash flow +25.9/30.0
- DSCR +8.7/10.0
- ARV discount +8.1/15.0
- 1% rule +7.2/10.0
- Rent growth +3.8/5.0
- Livability +3.5/5.0
- Schools +2.7/10.0
- Condition / age +2.5/5.0
- Appreciation +0.0/10.0
$399,999
🖨 Deal sheet 📄 Offer letter ✓ Due diligence
Multi-family units
County records classify this as Multi-Family (5+ Unit). Listing-text estimate: 6 units. confirmed
5+ unit building — per-unit beds/baths from public records are typically unavailable; the breakdown below (if shown) is an estimate from the listing text.
Listing remarks MLS
908 Denver is a 6-unit complex of one-bedroom apartments, each featuring in-unit washer/dryer connections that is currently full occupied. Some units offer central heat & air. Enjoy an amazing common area plus a garage for each unit—plus one extra for owner storage or added income! Includes an additional lot next door with room to expand. Huge upside potential for investors seeking cash flow and growth! Pair this with 1109 Harrison for an even better deal! Owner will finance. With management in place!
Key facts
- Garage for each unit
- Room to expand
- Listed 241 days
Tags
Neighborhood map
What this means for you Summary
Snapshot
- This is a 6 × 1-bed/1-bath units multifamily listed at $400k.
Deal economics
- At list price, monthly cash flow is $985 ($12k/yr) — positive. Per door: $164/mo.
- The deal already cash-flows at list — no discount required.
- Meets the 1% rule at list price ($5k rent vs $400k).
- Recommended offer: $352k (12.0% below list) — sets the bar for market timing.
- Cap rate 9.2% vs local median 4.7% in Wichita Falls — top-decile yield for the area; either an underpriced asset or a hidden risk that comps aren't pricing in. Stress-test before assuming the spread holds.
Location & tenants
- Location reads 69/100 on livability (#437 in TX) — a middle-class / working-renter tenant base. Strengths: cost of living A+, housing A+; Watch: health & safety C-, employment D+, schools D.
- Wichita Falls ISD (urban): math 31% / reading 33% proficiency, ranked #585 of 826 in TX (top 71%) — families likely to look elsewhere, expect single-tenant / working-renter base with shorter leases.
- Market conditions: Rents rising fast (+5.3%/yr); 133 active listings in the ZIP; lower-income renter base — watch delinquency; 231 units permitted in Wichita County in 2024 (10 in 5+ unit buildings).
- At $4,870/mo this rent would consume 139% of the median local household income ($42k/yr) (locally 577% of renters already pay >50% of income on rent) — very limited rent-growth headroom before tenants either downsize or default.
Forward outlook
- Local home prices are declining (-3.0%/yr); year-one equity from $3k of loan paydown is wiped out by about $12k of value loss. Plan a longer hold.
- Wichita County population projected to shrink 7% by 2050 — rents likely to lag national; underwrite the cash flow, not the appreciation.
- At projected returns (-3.0% appreciation + 5.3% rent growth), your $112k cash investment doubles in ~9 years — after that, you're playing with house money.
Negotiation context
- It's been on market 242 days — a 12% lower offer ($352k) is reasonable based on typical stale-listing flexibility.
- 6 sale attempts since 5y ago; this cycle's ask is 66566% above the opening price — seller raised mid-cycle; expect resistance to lowballs.
Risks & watch-outs
- Watch-outs: built in 1924 — expect roof / HVAC / electrical / plumbing capex.
- Climate carrying-cost: extreme-heat days projected 7→20/yr by 2055 (HVAC capex compounding) — expect insurance premiums to compound above CPI over the hold.
Questions for the listing agent
- It's been on market 242 days. Have you received any prior offers? Is the seller open to a 12% concession, seller financing, or rate buy-down credit?
- Can we see the unit-by-unit rent roll, current vacancy, and any below-market leases? What's the average tenancy length?
- What capital expenditures (roof, boiler, parking lot, exteriors) have been made in the last 5 years, and what's planned in the next 2?
- Built in 1924 — when were the roof, HVAC, electrical panel, plumbing, and water heater last replaced?
- Why hasn't it sold? Are there any deal-killer items the seller is aware of (foundation, flood, title, zoning, code violations)?
- Is there a deadline driving the sale (1031 exchange, divorce, estate, relocation)? That informs how much negotiation room exists.
- Schools are D-rated, which usually means shorter tenancies and higher turnover. Who's the typical renter profile here, and what's been the actual vacancy rate?
- Crime grade is D in this area — have there been break-ins, vandalism, or insurance claims at this property in the last 3 years? What carrier currently insures it and at what premium?
- What's the average days-on-market for RENTAL listings here right now (not sales)? A rising rental-DOM trend means longer vacancies and softer asking-rent achievability than the comps imply.
- What's the recent tenant-quality profile in this submarket — average credit score on applications, eviction rate, late-payment / NSF rate, and stable-employment percentage? A property-management company in the area should have these aggregated.
- How much new apartment / multifamily construction is in the pipeline within 1–3 miles? Heavy new supply (>2% of stock underway) typically softens rents 12–24 months out; light construction supports rent growth.
Investment metrics
- 1% rule
- 1.22% ✓
- Cap rate
- 9.25%
- Cash-on-cash
- 10.55%
- DSCR
- 1.47
- GRM
- 6.8
CMA / ARV
- ARV (median comp)
- $405,212
- List price
- $399,999
- Delta
- -1.29%
- Verdict
- FAIR
- Comps
- 1 within 2.0 mi
Projected returns pro-forma
-3.0% appreciation · 5.27% rent growth · sell at horizon
- IRR
- 2.1%
- Equity multiple
- 1.08×
- Total profit
- $9,410
- Equity at exit
- $59,641
- IRR
- 13.9%
- Equity multiple
- 2.24×
- Total profit
- $138,395
- Equity at exit
- $34,585
Cash invested: $112,000 (down + closing). Projections, not guarantees.
Landlord ↔ Tenant lean methodology
- Overall (STATE)
- 87 Strongly Landlord-Friendly
- State Texas
- 87 Strongly Landlord-Friendly · R+5
- County
- — inherits STATE
- City
- — inherits STATE
ZIP-level market 76301
- Home prices YoY
- -34.1%
- Rents YoY
- 5.3%
- Active inventory
- 133
- Price-to-rent
- 41.1×
Monthly cashflow live
- Estimated rent
- $4,870 high interval (Pro) →
- Mortgage (P&I)
- −$2,098
- Tax from tax record
- −$598 /mo · $7,179/yr
- Insurance
- −$167
- HOA
- −$0
- Vacancy / Maint / Mgmt
- −$1,023
- Net cashflow
- $985
Break-even live
6-unit breakdown (identical units grouped — click to expand)
| Units | Beds | Baths | Est. rent |
|---|---|---|---|
| 6× units | 1 | 1 | $4,872 |
| #1 | 1 | 1 | $812 |
| #2 | 1 | 1 | $812 |
| #3 | 1 | 1 | $812 |
| #4 | 1 | 1 | $812 |
| #5 | 1 | 1 | $812 |
| #6 | 1 | 1 | $812 |
| Total (6 units) | $4,870 | ||
UW: 25.0% down · 7.5% · 30yr · 1.5% tax · 5.0% vac · 8.0% maint · 8.0% mgmt
Financing live
Cash to close
- Down payment
- $100,000
- Closing costs
- $12,000
- Reserves months
- —
- Total cash needed
- —
Loan-product check · same deal, 3 products live
Conventional
25% down · 7.5% · 30yr
- Down + closing
- —
- Monthly P&I
- —
- Monthly cashflow
- —
- DSCR
- —
- Eligible?
- —
Personal DTI + credit; lowest rate.
DSCR
20% down · 8.5% · 30yr
- Down + closing
- —
- Monthly P&I
- —
- Monthly cashflow
- —
- DSCR
- —
- Eligible?
- —
No personal income docs; deal must DSCR.
Hard money
10% down · 12.0% · 12mo
- Down + closing
- —
- Monthly P&I
- —
- Monthly cashflow
- —
- DSCR
- —
- Eligible?
- —
Short-term bridge; refi at stabilization.
Listing history 31 events
-
2026-06-19days on market $399,999 Active 242 DOM
-
2026-06-18days on market $399,999 Active 241 DOM
-
2026-06-17days on market $399,999 Active 240 DOM
-
2026-06-16days on market $399,999 Active 239 DOM
-
2026-06-15days on market $399,999 Active 238 DOM
-
2026-06-14days on market $399,999 Active 236 DOM
-
2026-06-13days on market $399,999 Active 235 DOM
-
2026-06-10days on market $399,999 Active 233 DOM
-
2026-06-09days on market $399,999 Active 232 DOM
-
2026-06-08days on market $399,999 Active 231 DOM
-
2026-06-07days on market $399,999 Active 230 DOM
-
2026-06-05days on market $399,999 Active 227 DOM
-
2026-06-02days on market $399,999 Active 225 DOM
-
2026-06-01days on market $399,999 Active 224 DOM
-
2026-05-31days on market $399,999 Active 223 DOM
-
2026-05-30days on market $399,999 Active 222 DOM
-
2026-03-30price $424,000 518-char remark
Show marketing remark (518 chars)
908 Denver is a 6-unit complex of one-bedroom apartments, each featuring in-unit washer/dryer connections that is currently full occupied. Some units offer central heat & air. Enjoy an amazing common area plus a garage for each unit—plus one extra for owner storage or added income! Includes an additional lot next door with room to expand. Huge upside potential for investors seeking cash flow and growth! Pair this with 1109 Harrison for an even better deal! Owner will finance. With management in place!
-
2026-01-12historical $600
-
2026-01-10$600
-
2026-01-10historical $600
-
2025-12-24$600
-
2025-11-13price $424,900 518-char remark
Show marketing remark (518 chars)
908 Denver is a 6-unit complex of one-bedroom apartments, each featuring in-unit washer/dryer connections that is currently full occupied. Some units offer central heat & air. Enjoy an amazing common area plus a garage for each unit—plus one extra for owner storage or added income! Includes an additional lot next door with room to expand. Huge upside potential for investors seeking cash flow and growth! Pair this with 1109 Harrison for an even better deal! Owner will finance. With management in place!
-
2025-10-20$425,000 Active 518-char remark
Show marketing remark (518 chars)
908 Denver is a 6-unit complex of one-bedroom apartments, each featuring in-unit washer/dryer connections that is currently full occupied. Some units offer central heat & air. Enjoy an amazing common area plus a garage for each unit—plus one extra for owner storage or added income! Includes an additional lot next door with room to expand. Huge upside potential for investors seeking cash flow and growth! Pair this with 1109 Harrison for an even better deal! Owner will finance. With management in place!
-
2025-09-08historical $650
-
2025-08-14price $650
-
2025-07-28$600
-
2025-07-27historical $800
-
2025-07-11$800
-
2022-02-19price $650
-
2022-02-16soldstatus 346-char remark
Show marketing remark (346 chars)
Fantastic apartment building with 6 one bedroom units and 7 garage spaces (one used for storage). Five of the 6 units are leased with a projected monthly income of $3219. All apartments are one bedroom with large living rooms and separate dining area. Apartment C has central heat/ air and others have window units. Great investment opportunity!!
-
2021-11-17$325,000 346-char remark
Show marketing remark (346 chars)
Fantastic apartment building with 6 one bedroom units and 7 garage spaces (one used for storage). Five of the 6 units are leased with a projected monthly income of $3219. All apartments are one bedroom with large living rooms and separate dining area. Apartment C has central heat/ air and others have window units. Great investment opportunity!!
ⓘ Source: listings_history table (triggers on properties + properties_extension) + one-shot
backfill from property_details.listing_events for pre-trigger history.
Tax reassessment forecast TX · Resets to sale price
- Current annual tax
- $7,179 · $598/mo
- Projected year-2 tax
- $7,320 · $610/mo
- Expected delta
- +$141/yr (+$12/mo · 2.0%)
ⓘ Screening estimate from a state-policy table — verify with the county assessor before closing.
Climate risk First Street
- Flood 1/10 Low FEMA zone X (unshaded) · 0% chance over 30 yrs
- Wildfire 2/10 Low
- Heat 7/10 Severe 7 d/yr ≥109°F today · 20 d/yr by 30 yrs out
- Wind 4/10 Moderate 8% chance of damaging wind over 30 yrs
- Air quality 1/10 Low 0 unhealthy d/yr today · 0 by 30 yrs out
Nearby sold comps map
Loading sold comps map…
Walkable amenities ~0.75 mi
Loading nearby amenities…
Taxation est. · year 1
- Rental income
- $58,440
- − Mortgage interest
- −$22,406
- − Property taxes
- −$7,179
- − Insurance
- −$2,000
- − Repairs & maintenance
- −$4,675
- − Management
- −$4,675
- − Depreciation
- −$11,636
- Taxable income
- $5,868
- Est. tax owed @ 24.0%
- −$1,408
- After-tax cash flow
- $10,409/yr
For passive investors: Depreciation is non-cash, so a rental often shows a tax loss while cash-flowing — sheltering income. Rental losses are passive: they offset passive income freely, and up to $25,000/yr can offset ordinary (W-2) income if you actively participate and your MAGI is under $100k (phasing out to $0 by $150k); unused losses carry forward. On sale, claimed depreciation is recaptured at up to 25%, and gains may owe capital-gains tax (a 1031 exchange can defer both). Figures are a year-1 estimate at your 24.0% rate — not tax advice; consult a CPA.
Schools (NCES district)
- District
- Wichita Falls ISD
- NCES district ID
- 4845780
- Math proficiency
- 31% ▼ -10.00%
- Reading proficiency
- 33% ▼ -7.00%
- Median HH income
- $41,604
- Composite
- 27.06/100
- National rank
- #7051
- State rank
- #585 of 826 in TX
Livability — Wichita Falls
- Score
- 69/100
- State rank
- #437
- US rank
- #8940
Category grades
Schools grade is shown separately in the Schools card above.
Census & demographics
- Census place
- Wichita Falls, TX
- County
- Wichita County · 95,694 people
- City population
- 95,694
- Metro
- Wichita Falls, TX
- Population (ZIP)
- 15,479
- Household income
- $41,947
- Rent vs Own
- Severe rent burden
- 577.0
Population outlook (Wichita County) Hauer SSP2
- Today (2025)
- 129,638 people
- By 2030
- 128,366 · -1.0%
- By 2040
- 124,466 · -4.0%
- By 2050
- 120,499 · -7.0%
- By 2075
- 113,884 · -12.2%
- By 2100
- 101,818 · -21.5%
Race, ethnicity, and origin ACS 2023
- Neighborhood character
- Diverse neighborhood (Simpson 0.67)
- Race & ethnicity
- White 40% Hispanic / Latino 38% Black 18% Two or more races 15% Asian 1%
- Hispanic origin (detail)
- Mexican 36%
- Common ancestry
- Slovak 3% Lithuanian 2% Italian 1%
- Foreign-born
- 11% · Canada, Vietnam
- Languages at home
- 76% English-only · Spanish 22%
Political lean MEDSL · Wichita
- 2024 margin
- Solid R (+44.0) · D 27.5% · R 71.5%
- 2008→2024 swing
- -5.2pp toward R · 2008: -38.9pp · 2024: -44.0pp
- All cycles
- 2024: R+44.0 2020: R+41.1 2016: R+49.7 2012: R+47.1 2008: R+38.9
Not yet ingested
- Civics
- —
Market trends
- HPI YoY
- ▼ -69.89%
- Current HPI
- 135.1511
- Rent YoY
- ▲ 5.27%
- Metro
- Wichita Falls, TX
- State GDP YoY
- ▲ 3.95%
- F500 in state
- 110
Industry mix (Fortune 500 HQ in TX)
| Industry | F500 HQs | Revenue |
|---|---|---|
| Energy | 16 | $1,198B |
|
||
| Technology | 5 | $198B |
|
||
| Engineering / Construction | 4 | $72B |
|
||
| Energy Services | 3 | $60B |
|
||
| Utilities | 3 | $41B |
|
||
| Healthcare | 2 | $330B |
|
||
Price history
+30.5% since first listed15 events — show timeline
- 2026-03-30 Price Changed $424,000 WFAOR
- 2026-01-12 Rental Removed $600 RENTALBEAST
- 2026-01-10 Listed for Rent $600 RENTALBEAST
- 2026-01-10 Rental Removed $600 RENTEC
- 2025-12-24 Listed for Rent $600 RENTEC
- 2025-11-13 Price Changed $424,900 WFAOR
- 2025-10-20 Listed $425,000 WFAOR
- 2025-09-08 Rental Removed $650 RENTEC
- 2025-08-14 Price Changed $650 RENTEC
- 2025-07-28 Listed for Rent $600 RENTEC
- 2025-07-27 Rental Removed $800 RENTEC
- 2025-07-11 Listed for Rent $800 RENTEC
- 2022-02-19 Price Changed $650 RENT.
- 2022-02-16 Sold (MLS) — WFAOR
- 2021-11-17 Listed $325,000 WFAOR
Property tax history
+21.3%/yrLatest (2025): $7,179 · -1.9% YoY. Source: county tax records.
Cash-flow waterfall
monthlySold comps — $/sqft
last 12 mo · ≤1 miLoading sold comps…