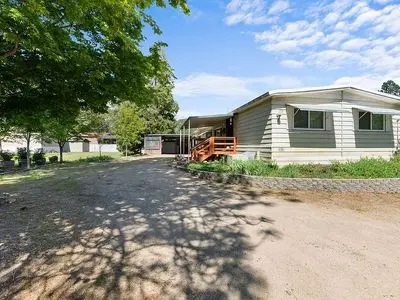
22071 Highway 62 · Shady Cove, OR
Flood risk 4/10 · Minor
- FEMA flood zone
- X (shaded)
- Chance of flooding over 30 yrs
- 0.22%
- Est. flood insurance / yr
- $507 – $1,088
Fire risk 8/10 · Major
- Est. fire insurance / yr
- $498 – $926
Heat risk 6/10 · Moderate
- Hot days now (above 97°F)
- 7 days/yr
- Hot days in 30 yrs
- 16 days/yr
Wind risk 1/10 · Minimal
- Chance of severe wind over 30 yrs
- —
Air-quality risk 10/10 · Severe
- Unhealthy air days now
- 29 days/yr
- Unhealthy air days in 30 yrs
- 31 days/yr
Risk factors via First Street. Map © Google.
Why this score? — see what drove the B- grade
The composite is a weighted blend of 9 inputs, each scored 0–100. Each bar is that input's sub-score; the figure is the points it added to the 100-point composite (weight × sub-score).
- Cash flow +30.0/30.0
- 1% rule +10.0/10.0
- DSCR +10.0/10.0
- ARV discount +7.5/15.0
- Livability +3.4/5.0
- Schools +3.3/10.0
- Rent growth +2.5/5.0
- Condition / age +2.5/5.0
- Appreciation +0.0/10.0
$60,000
🖨 Deal sheet 📄 Offer letter ✓ Due diligence
Listing remarks
Well-maintained mobile home located in a quiet and welcoming 55+ community. This property offers a rare combination of privacy, established landscaping, and comfortable living, perfect for those looking to enjoy a relaxed lifestyle. Property Highlights: Situated on a large, established lot Surrounded by mature trees and landscaping for added privacy. Beautiful flowers and greenery throughout the property. Covered carport for convenient parking and two storage sheds offering plenty of space for tools, hobbies, or extra storage. Home Features: Comfortable and functional layout Plenty of natural light. Community Details: Located in a 55 and older mobile home park Quiet, well-kept neighborhood.
Key facts
- Covered carport
- Natural light
- Two storage sheds
Tags
Neighborhood map
What this means for you Summary
Snapshot
- This is a 2-bed/1.0-bath other listed at $60k.
Deal economics
- At list price, monthly cash flow is $847 ($10k/yr) — positive.
- The deal already cash-flows at list — no discount required.
- Meets the 1% rule at list price ($2k rent vs $60k).
- Recommended offer: $58k (3.0% below list) — sets the bar for market timing.
- Cap rate 23.2% vs local median 2.2% in Shady Cove — top-decile yield for the area; either an underpriced asset or a hidden risk that comps aren't pricing in. Stress-test before assuming the spread holds.
Location & tenants
- Location reads 68/100 on livability (#156 in OR) — a middle-class / working-renter tenant base. Strengths: housing A+, health & safety A+, cost of living A; Watch: employment C-, schools D-, amenities F.
- Eagle Point SD 9 (suburban): math 26% / reading 45% proficiency, ranked #134 of 183 in OR (top 73%) — families likely to look elsewhere, expect single-tenant / working-renter base with shorter leases.
- Market conditions: 53 active listings in the ZIP; 4 comparable units currently listed for rent nearby; rentals at typical pace (median 21d on market — plan ~3-4 weeks tenant-placement turnaround); 904 units permitted in Jackson County in 2024 (212 in 5+ unit buildings).
Forward outlook
- Local home prices are declining (-3.0%/yr); year-one equity from $415 of loan paydown is wiped out by about $2k of value loss. Plan a longer hold.
- Jackson County population projected at +17% by 2050 — long-run rental-demand tailwind backs the buy-and-hold thesis.
- At projected returns (-3.0% appreciation + 3.0% rent growth), your $17k cash investment doubles in ~2 years — after that, you're playing with house money.
Negotiation context
- It's been on market 38 days — a 3% lower offer ($58k) is reasonable based on typical stale-listing flexibility.
- 32 sale attempts since 30y ago with the ask held roughly flat each time — persistent listings suggest the price (not the market) is what's stuck; bring a comps-based counter.
- Current owner paid $48k; 25% above their basis — modest negotiation headroom, anchor on the comps not their cost.
Risks & watch-outs
- Climate carrying-cost: severe wildfire risk; extreme-heat days projected 7→16/yr by 2055 (HVAC capex compounding) — expect insurance premiums to compound above CPI over the hold.
Questions for the listing agent
- It's been on market 38 days. Have you received any prior offers? Is the seller open to a 3% concession, seller financing, or rate buy-down credit?
- Built in 1973 — when were the roof, HVAC, electrical panel, plumbing, and water heater last replaced?
- Is there a deadline driving the sale (1031 exchange, divorce, estate, relocation)? That informs how much negotiation room exists.
- Schools are D-rated, which usually means shorter tenancies and higher turnover. Who's the typical renter profile here, and what's been the actual vacancy rate?
- What's the average days-on-market for RENTAL listings here right now (not sales)? A rising rental-DOM trend means longer vacancies and softer asking-rent achievability than the comps imply.
- What's the recent tenant-quality profile in this submarket — average credit score on applications, eviction rate, late-payment / NSF rate, and stable-employment percentage? A property-management company in the area should have these aggregated.
- How much new for-sale + rental construction is in the pipeline within 1–3 miles? Heavy new supply typically softens prices + rents 12–24 months out; constrained supply supports both.
Investment metrics
- 1% rule
- 2.66% ✓
- Cap rate
- 23.23%
- Cash-on-cash
- 60.48%
- DSCR
- 3.69
- GRM
- 3.1
CMA / ARV
No comps found within radius.
Projected returns pro-forma
-3.0% appreciation · 3.0% rent growth · sell at horizon
- IRR
- 59.3%
- Equity multiple
- 3.63×
- Total profit
- $44,227
- Equity at exit
- $8,946
- IRR
- 64.0%
- Equity multiple
- 7.43×
- Total profit
- $108,048
- Equity at exit
- $5,188
Cash invested: $16,800 (down + closing). Projections, not guarantees.
Landlord ↔ Tenant lean methodology
- Overall (STATE)
- 28 Tenant-Leaning
- State Oregon
- 28 Tenant-Leaning · D+6
- County
- — inherits STATE
- City
- — inherits STATE
ZIP-level market 97539
- Home prices YoY
- -7.4%
- Active inventory
- 53
- Price-to-rent
- 3.1×
Monthly cashflow live
- Estimated rent
- $1,597 medium interval (Pro) →
- Mortgage (P&I)
- −$315
- Tax est. 1.5%
- −$75 /mo · $900/yr
- Insurance
- −$25
- HOA
- −$0
- Vacancy / Maint / Mgmt
- −$335
- Net cashflow
- $847
Break-even live
UW: 25.0% down · 7.5% · 30yr · 1.5% tax · 5.0% vac · 8.0% maint · 8.0% mgmt
Financing live
Cash to close
- Down payment
- $15,000
- Closing costs
- $1,800
- Reserves months
- —
- Total cash needed
- —
Loan-product check · same deal, 3 products live
Conventional
25% down · 7.5% · 30yr
- Down + closing
- —
- Monthly P&I
- —
- Monthly cashflow
- —
- DSCR
- —
- Eligible?
- —
Personal DTI + credit; lowest rate.
DSCR
20% down · 8.5% · 30yr
- Down + closing
- —
- Monthly P&I
- —
- Monthly cashflow
- —
- DSCR
- —
- Eligible?
- —
No personal income docs; deal must DSCR.
Hard money
10% down · 12.0% · 12mo
- Down + closing
- —
- Monthly P&I
- —
- Monthly cashflow
- —
- DSCR
- —
- Eligible?
- —
Short-term bridge; refi at stabilization.
Rent comps 4 comps
| Address | Beds | Baths | Sqft | Rent | $/sqft | DOM | Units | Dist |
|---|---|---|---|---|---|---|---|---|
| 297 Sowell Dr Unit B Shady Cove, OR | 3.0 | 2.0 | 1340 | $1,795 | $1.34 | 13d | 1 | 0.45mi |
| 25 Sowell Ct Shady Cove, OR | 2.0 | 2.0 | 1005 | $1,395 | $1.39 | 43d | 1 | 0.45mi |
| 293 Sowell Dr Shady Cove, OR | 3.0 | 2.0 | 1704 | $1,950 | $1.14 | 13d | 1 | 0.47mi |
| 400 Indian Trail Ct Shady Cove, OR | 3.0 | 2.0 | 1090 | $1,350 | $1.24 | 21d | 1 | 0.68mi |
Listing history 50 events
-
2026-06-19days on market $60,000 Active 38 DOM
-
2026-06-18days on market $60,000 Active 37 DOM
-
2026-06-17days on market $60,000 Active 36 DOM
-
2026-06-16days on market $60,000 Active 35 DOM
-
2026-06-15days on market $60,000 Active 34 DOM
-
2026-06-14days on market $60,000 Active 32 DOM
-
2026-06-13days on market $60,000 Active 31 DOM
-
2026-06-10days on market $60,000 Active 29 DOM
-
2026-06-08days on market $60,000 Active 27 DOM
-
2026-06-07days on market $60,000 Active 26 DOM
-
2026-06-05days on market $60,000 Active 23 DOM
-
2026-06-03days on market $60,000 Active 22 DOM
-
2026-06-02days on market $60,000 Active 21 DOM
-
2026-06-01days on market $60,000 Active 20 DOM
-
2026-05-31days on market $60,000 Active 19 DOM
-
2026-05-30days on market $60,000 Active 18 DOM
-
2026-05-12$60,000 Active 994-char remark
-
2020-04-26historical
-
2020-04-26historical
-
2020-04-26historical
-
2020-04-26historical
-
2020-04-26historical
-
2020-04-26historical
-
2020-04-25historical
-
2020-04-25historical
-
2020-04-25historical
-
2020-04-25historical
-
2020-04-25historical
-
2020-04-25historical
-
2020-04-25historical
-
2020-04-25historical
-
2020-04-25historical
-
2020-04-25historical
-
2020-04-25historical
-
2020-04-25historical
-
2004-05-19historical
-
2004-03-23$33,500
-
2002-12-13soldstatus $48,000
-
2002-05-31soldstatus $51,000
-
2002-04-08$54,500
-
2002-01-18$55,500
-
2001-07-18soldstatus $40,000
-
2001-07-06$59,900
-
2001-01-04$45,000
-
2000-10-03$45,000
-
2000-03-27$63,900
-
2000-03-15$62,000
-
1999-05-03soldstatus $57,500
-
1999-01-27soldstatus $16,000
-
1998-11-12$13,500
ⓘ Source: listings_history table (triggers on properties + properties_extension) + one-shot
backfill from property_details.listing_events for pre-trigger history.
Climate risk First Street
- Flood 4/10 Moderate FEMA zone X (shaded) · 22% chance over 30 yrs
- Wildfire 8/10 Severe
- Heat 6/10 Major 7 d/yr ≥97°F today · 16 d/yr by 30 yrs out
- Wind 1/10 Low
- Air quality 10/10 Extreme 29 unhealthy d/yr today · 31 by 30 yrs out
Nearby sold comps map
Loading sold comps map…
Walkable amenities ~0.75 mi
Loading nearby amenities…
Taxation est. · year 1
- Rental income
- $19,159
- − Mortgage interest
- −$3,361
- − Property taxes
- −$900
- − Insurance
- −$300
- − Repairs & maintenance
- −$1,533
- − Management
- −$1,533
- − Depreciation
- −$1,745
- Taxable income
- $9,788
- Est. tax owed @ 24.0%
- −$2,349
- After-tax cash flow
- $7,811/yr
For passive investors: Depreciation is non-cash, so a rental often shows a tax loss while cash-flowing — sheltering income. Rental losses are passive: they offset passive income freely, and up to $25,000/yr can offset ordinary (W-2) income if you actively participate and your MAGI is under $100k (phasing out to $0 by $150k); unused losses carry forward. On sale, claimed depreciation is recaptured at up to 25%, and gains may owe capital-gains tax (a 1031 exchange can defer both). Figures are a year-1 estimate at your 24.0% rate — not tax advice; consult a CPA.
Schools (NCES district)
- District
- Eagle Point SD 9
- NCES district ID
- 4104500
- Math proficiency
- 26% ▬ 0.00%
- Reading proficiency
- 45% ▬ 0.00%
- Median HH income
- $47,834
- Composite
- 33.13/100
- National rank
- #10630
- State rank
- #134 of 183 in OR
Livability — Shady Cove
- Score
- 68/100
- State rank
- #156
- US rank
- #9143
Category grades
Schools grade is shown separately in the Schools card above.
Census & demographics
- Census place
- Shady Cove, OR
- Population (ZIP)
- 3,349
Population outlook (Jackson County) Hauer SSP2
- Today (2025)
- 234,433 people
- By 2030
- 243,834 · +4.0%
- By 2040
- 259,717 · +10.8%
- By 2050
- 273,269 · +16.6%
- By 2075
- 300,624 · +28.2%
- By 2100
- 305,256 · +30.2%
Race, ethnicity, and origin ACS 2023
- Neighborhood character
- Predominantly White (79%)
- Race & ethnicity
- White 79% Two or more races 11% Hispanic / Latino 6% Native American 3% Black 3% Asian 1%
- Hispanic origin (detail)
- Mexican 3%
- Common ancestry
- Italian 9% Lithuanian 8% Danish 4%
- Foreign-born
- 2% · Canada
- Languages at home
- 99% English-only · Other Asian/Pacific 1%
Political lean MEDSL · Jackson
- 2024 margin
- Lean R (+6.4) · D 45.5% · R 51.9% · Other 2.6%
- 2008→2024 swing
- -6.5pp toward R · 2008: 0.1pp · 2024: -6.4pp
- All cycles
- 2024: R+6.4 2020: R+3.5 2016: R+9.2 2012: R+5.0 2008: D+0.1
Not yet ingested
- Civics
- —
Market trends
- HPI YoY
- ▼ -22.55%
- Current HPI
- 281.9845
- Rent YoY
- —
- Metro
- —
- State GDP YoY
- ▲ 2.05%
- F500 in state
- 2
Industry mix (Fortune 500 HQ in OR)
| Industry | F500 HQs | Revenue |
|---|---|---|
| Consumer Goods | 1 | $51B |
|
||
Price history
-85.0% since first listed67 events — show timeline
- 2026-05-12 Listed $60,000 FSBO.com
- 2020-04-26 Listing Removed — MLSCO
- 2020-04-26 Listing Removed — MLSCO
- 2020-04-26 Listing Removed — MLSCO
- 2020-04-26 Listing Removed — MLSCO
- 2020-04-26 Listing Removed — MLSCO
- 2020-04-26 Listing Removed — MLSCO
- 2020-04-25 Listing Removed — MLSCO
- 2020-04-25 Listing Removed — MLSCO
- 2020-04-25 Listing Removed — MLSCO
- 2020-04-25 Listing Removed — MLSCO
- 2020-04-25 Listing Removed — MLSCO
- 2020-04-25 Listing Removed — MLSCO
- 2020-04-25 Listing Removed — MLSCO
- 2020-04-25 Listing Removed — MLSCO
- 2020-04-25 Listing Removed — MLSCO
- 2020-04-25 Listing Removed — MLSCO
- 2020-04-25 Listing Removed — MLSCO
- 2020-04-25 Listing Removed — MLSCO
- 2004-05-19 Listing Removed — MLSCO
- 2004-03-23 Listed $33,500 MLSCO
- 2002-12-13 Sold (MLS) $48,000 MLSCO
- 2002-05-31 Sold (MLS) $51,000 MLSCO
- 2002-04-08 Listed $54,500 MLSCO
- 2002-01-18 Listed $55,500 MLSCO
- 2001-07-18 Sold (MLS) $40,000 MLSCO
- 2001-07-06 Listed $59,900 MLSCO
- 2001-01-04 Listed $45,000 MLSCO
- 2000-10-03 Listed $45,000 MLSCO
- 2000-03-27 Listed $63,900 MLSCO
- 2000-03-15 Listed $62,000 MLSCO
- 1999-05-03 Sold (MLS) $57,500 MLSCO
- 1999-01-27 Sold (MLS) $16,000 MLSCO
- 1998-11-12 Listed $13,500 MLSCO
- 1998-10-30 Listed $59,500 MLSCO
- 1998-07-08 Sold (MLS) $57,500 MLSCO
- 1998-06-11 Sold (MLS) $12,000 MLSCO
- 1998-06-08 Sold (MLS) $8,500 MLSCO
- 1998-05-26 Sold (MLS) $44,650 MLSCO
- 1998-04-15 Listed $59,950 MLSCO
- 1998-04-15 Listed $45,000 MLSCO
- 1998-03-25 Listed $9,500 MLSCO
- 1998-02-19 Listed $35,000 MLSCO
- 1998-01-30 Listed $62,500 MLSCO
- 1997-12-29 Listed $44,000 MLSCO
- 1997-11-21 Listed $26,000 MLSCO
- 1997-11-10 Listed $15,500 MLSCO
- 1997-09-04 Listed $19,900 MLSCO
- 1997-08-26 Listed $59,950 MLSCO
- 1997-08-01 Sold (MLS) $30,000 MLSCO
- 1997-07-29 Listed $18,800 MLSCO
- 1997-07-16 Listed $62,500 MLSCO
- 1997-07-16 Listed $37,500 MLSCO
- 1997-06-05 Sold (MLS) $14,000 MLSCO
- 1997-04-24 Listed $32,000 MLSCO
- 1997-02-13 Listed $58,900 MLSCO
- 1997-01-29 Listed $16,600 MLSCO
- 1997-01-25 Listed $32,000 MLSCO
- 1997-01-06 Listed $35,000 MLSCO
- 1996-09-27 Sold (MLS) $11,000 MLSCO
- 1996-09-17 Listed $14,500 MLSCO
- 1996-08-26 Listed $38,500 MLSCO
- 1996-07-24 Listed $48,000 MLSCO
- 1990-07-31 Sold (Public Records) $450,000 Public Records
- 1990-07-31 Sold (Public Records) $450,000 Public Records
- 1987-07-01 Sold (Public Records) $339,000 Public Records
- 1984-06-18 Sold (Public Records) $400,000 Public Records
Property tax history
+1.5%/yrLatest (2025): $5,414 · +2.3% YoY. Source: county tax records.
Cash-flow waterfall
monthlySold comps — $/sqft
last 12 mo · ≤1 miLoading sold comps…