 Duplex
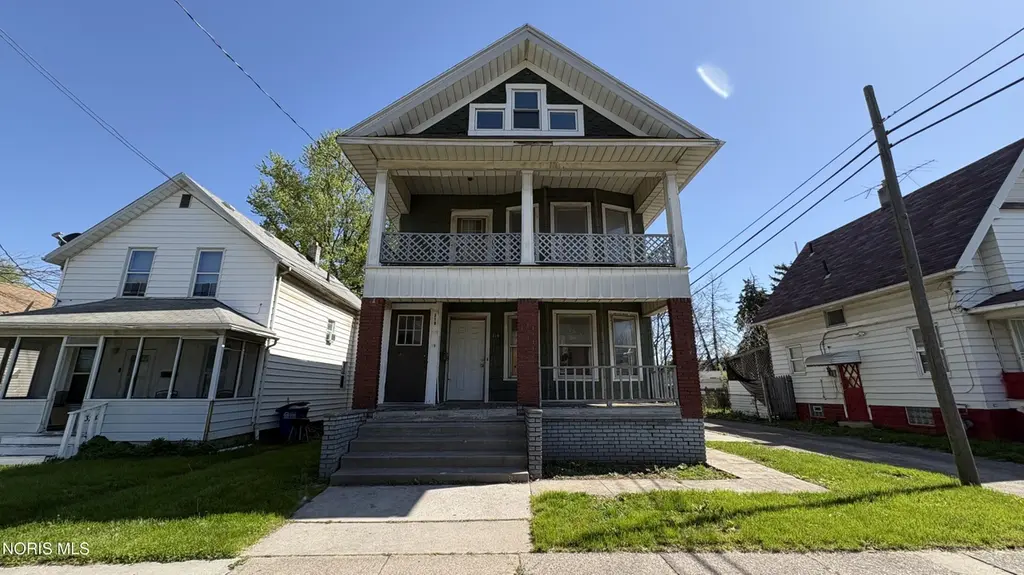
318 Troy St · Toledo, OH
Flood risk 1/10 · Minimal
- FEMA flood zone
- X (unshaded)
- Chance of flooding over 30 yrs
- 0.0%
- Est. flood insurance / yr
- $473 – $860
Fire risk 1/10 · Minimal
- Est. fire insurance / yr
- $713 – $1,323
Heat risk 3/10 · Minor
- Hot days now (above 100°F)
- 7 days/yr
- Hot days in 30 yrs
- 16 days/yr
Wind risk 2/10 · Minimal
- Chance of severe wind over 30 yrs
- —
Air-quality risk 2/10 · Minimal
- Unhealthy air days now
- 1 days/yr
- Unhealthy air days in 30 yrs
- 3 days/yr
Risk factors via First Street. Map © Google.
Why this score? — see what drove the B grade
The composite is a weighted blend of 9 inputs, each scored 0–100. Each bar is that input's sub-score; the figure is the points it added to the 100-point composite (weight × sub-score).
- Cash flow +30.0/30.0
- ARV discount +14.9/15.0
- 1% rule +10.0/10.0
- DSCR +10.0/10.0
- Livability +3.3/5.0
- Rent growth +2.5/5.0
- Condition / age +2.5/5.0
- Schools +1.6/10.0
- Appreciation +0.0/10.0
$49,900
🖨 Deal sheet 📄 Offer letter ✓ Due diligence
Multi-family units
County records classify this as Multi-Family (2-4 Unit). Listing-text estimate: 2 units. confirmed
Listing remarks
This duplex has the bones investors look for — newer hot water tanks, an updated furnace, and two units ready to be turned and leased. A full basement and walk-up attic add meaningful storage without sacrificing usable square footage. The cosmetic work that remains offers solid value-add potential. Schedule your showing today!
Key facts
- Full basement
- Updated furnace
- Walk-up attic
Tags
Property features AI
Finance
- Other: Living area approximately 1,806; Lot about 0.09 acres
- Financial info: Duplex with 2 total units (both currently vacant); 1 building; Tenant/owner payment responsibilities: other
Exterior
- Parking: 2 parking spaces; Alley access; Off-street parking
- Utilities: Electricity connected; Natural gas available; Public water; Public sewer
- Home design: Residential income property (duplex); Two and one half levels; 2 stories total
- Construction: Shake siding; Raised foundation
- Exterior features: Shingle roof
Interior
- Flooring: Carpet; Hardwood; Laminate
- Heating & cooling: Forced air heating; Natural gas heating
- Interior features: Other interior features
- Laundry & utility: Other laundry features
Neighborhood map
What this means for you Summary
Snapshot
- This is a 2 × 2-bed/1.0-bath units multifamily listed at $50k.
Deal economics
- At list price, monthly cash flow is $1k ($12k/yr) — positive. Per door: $502/mo.
- The deal already cash-flows at list — no discount required.
- Meets the 1% rule at list price ($2k rent vs $50k).
- Recommended offer: $48k (3.0% below list) — sets the bar for market timing.
- Cap rate 30.4% vs local median 7.6% in Toledo — top-decile yield for the area; either an underpriced asset or a hidden risk that comps aren't pricing in. Stress-test before assuming the spread holds.
Location & tenants
- Location reads 66/100 on livability (#645 in OH) — a middle-class / working-renter tenant base. Strengths: cost of living A+, housing A+, health & safety A+; Watch: amenities C-, crime F, commute F.
- Toledo City (urban): math 15% / reading 24% proficiency, ranked #634 of 656 in OH (top 97%) — low school quality limits family demand, transient renter base, plan for 1-2y turnover; 72% free/reduced lunch — lower-income household profile, screen leases tightly.
- Zoned schools: Woodward High School (math 2% / reading 22%, grade F, #726 of 781 statewide, top 94%, 672 students, 0% FRL) — zoned schools average 0% FRL vs 72% district-wide (72 pts lower); this property's tenant base skews higher-income than the district average.
- Market conditions: 64 active listings in the ZIP; 2 comparable units currently listed for rent nearby; 415 units permitted in Lucas County in 2024 (122 in 5+ unit buildings).
- This rent runs 33% of the median local income ($62k/yr) — at the standard rent-burdened threshold; future hikes will face affordability resistance.
Forward outlook
- Local home prices are declining (-3.0%/yr); year-one equity from $345 of loan paydown is wiped out by about $1k of value loss. Plan a longer hold.
- Lucas County population projected at -16% by 2050 — secular population decline; favor cash flow + early exit over multi-decade hold.
- At projected returns (-3.0% appreciation + 3.0% rent growth), your $14k cash investment doubles in ~2 years — after that, you're playing with house money.
Negotiation context
- It's been on market 34 days — a 3% lower offer ($48k) is reasonable based on typical stale-listing flexibility.
- 7 sale attempts since 2y ago; this cycle's ask has dropped $9k (15%) from the opening price — seller is motivated, your offer sets the floor, not the list.
Risks & watch-outs
- Watch-outs: built in 1915 — expect roof / HVAC / electrical / plumbing capex.
Questions for the listing agent
- It's been on market 34 days. Have you received any prior offers? Is the seller open to a 3% concession, seller financing, or rate buy-down credit?
- Can we see the unit-by-unit rent roll, current vacancy, and any below-market leases? What's the average tenancy length?
- What capital expenditures (roof, boiler, parking lot, exteriors) have been made in the last 5 years, and what's planned in the next 2?
- Built in 1915 — when were the roof, HVAC, electrical panel, plumbing, and water heater last replaced?
- Is there a deadline driving the sale (1031 exchange, divorce, estate, relocation)? That informs how much negotiation room exists.
- Schools are D-rated, which usually means shorter tenancies and higher turnover. Who's the typical renter profile here, and what's been the actual vacancy rate?
- Crime grade is F in this area — have there been break-ins, vandalism, or insurance claims at this property in the last 3 years? What carrier currently insures it and at what premium?
- What's the average days-on-market for RENTAL listings here right now (not sales)? A rising rental-DOM trend means longer vacancies and softer asking-rent achievability than the comps imply.
- What's the recent tenant-quality profile in this submarket — average credit score on applications, eviction rate, late-payment / NSF rate, and stable-employment percentage? A property-management company in the area should have these aggregated.
- How much new apartment / multifamily construction is in the pipeline within 1–3 miles? Heavy new supply (>2% of stock underway) typically softens rents 12–24 months out; light construction supports rent growth.
Investment metrics
- 1% rule
- 3.43% ✓
- Cap rate
- 30.44%
- Cash-on-cash
- 86.25%
- DSCR
- 4.84
- GRM
- 2.4
CMA / ARV
- ARV (median comp)
- $59,659
- List price
- $49,900
- Delta
- -16.36%
- Verdict
- UNDERPRICED
- Comps
- 3 within 1.0 mi
Projected returns pro-forma
-3.0% appreciation · 3.0% rent growth · sell at horizon
- IRR
- 86.7%
- Equity multiple
- 5.00×
- Total profit
- $55,901
- Equity at exit
- $7,440
- IRR
- 89.9%
- Equity multiple
- 10.39×
- Total profit
- $131,152
- Equity at exit
- $4,314
Cash invested: $13,972 (down + closing). Projections, not guarantees.
Landlord ↔ Tenant lean methodology
- Overall (STATE)
- 73 Landlord-Friendly
- State Ohio
- 73 Landlord-Friendly · R+6
- County
- — inherits STATE
- City
- — inherits STATE
ZIP-level market 43611
- Home prices YoY
- -24.4%
- Active inventory
- 64
- Price-to-rent
- 4.9×
Monthly cashflow live
- Estimated rent
- $1,714 high interval (Pro) →
- Mortgage (P&I)
- −$262
- Tax from tax record
- −$67 /mo · $809/yr
- Insurance
- −$21
- HOA
- −$0
- Vacancy / Maint / Mgmt
- −$360
- Net cashflow
- $1,004
Break-even live
2-unit breakdown (identical units grouped — click to expand)
| Units | Beds | Baths | Est. rent |
|---|---|---|---|
| 2× units | 2 | 1 | $1,714 |
| #1 | 2 | 1 | $857 |
| #2 | 2 | 1 | $857 |
| Total (2 units) | $1,714 | ||
UW: 25.0% down · 7.5% · 30yr · 1.5% tax · 5.0% vac · 8.0% maint · 8.0% mgmt
Financing live
Cash to close
- Down payment
- $12,475
- Closing costs
- $1,497
- Reserves months
- —
- Total cash needed
- —
Loan-product check · same deal, 3 products live
Conventional
25% down · 7.5% · 30yr
- Down + closing
- —
- Monthly P&I
- —
- Monthly cashflow
- —
- DSCR
- —
- Eligible?
- —
Personal DTI + credit; lowest rate.
DSCR
20% down · 8.5% · 30yr
- Down + closing
- —
- Monthly P&I
- —
- Monthly cashflow
- —
- DSCR
- —
- Eligible?
- —
No personal income docs; deal must DSCR.
Hard money
10% down · 12.0% · 12mo
- Down + closing
- —
- Monthly P&I
- —
- Monthly cashflow
- —
- DSCR
- —
- Eligible?
- —
Short-term bridge; refi at stabilization.
Rent comps 2 comps
| Address | Beds | Baths | Sqft | Rent | $/sqft | DOM | Units | Dist |
|---|---|---|---|---|---|---|---|---|
| 601 Chicago St Toledo, OH | 3.0 | 2.0 | 1924 | $1,300 | $0.68 | 23d | 1 | 0.59mi |
| 1536 N Erie St Toledo, OH | 4.0 | 1.0 | 1600 | $1,300 | $0.81 | 43d | 1 | 1.38mi |
Listing history 35 events
-
2026-06-18price $49,900 Active 34 DOM
-
2026-06-18days on market $52,900 Active 34 DOM
-
2026-06-17days on market $52,900 Active 33 DOM
-
2026-06-16days on market $52,900 Active 32 DOM
-
2026-06-15days on market $52,900 Active 31 DOM
-
2026-06-14days on market $52,900 Active 29 DOM
-
2026-06-10days on market $52,900 Active 26 DOM
-
2026-06-09days on market $52,900 Active 25 DOM
-
2026-06-08days on market $52,900 Active 24 DOM
-
2026-06-07pricedays on market $52,900 Active 23 DOM
-
2026-06-05days on market $54,900 Active 20 DOM
-
2026-06-03days on market $54,900 Active 19 DOM
-
2026-06-02days on market $54,900 Active 18 DOM
-
2026-06-01days on market $54,900 Active 17 DOM
-
2026-05-31days on market $54,900 Active 16 DOM
-
2026-05-30days on market $54,900 Active 15 DOM
-
2026-05-18price $54,900 334-char remark
-
2026-05-15$58,900 Active 334-char remark
-
2026-05-14historical
-
2026-05-12price $59,900
-
2026-05-09price $63,900
-
2026-05-05$64,900 Active
-
2025-09-11soldstatus $110,000
-
2025-09-11soldstatus $110,000
-
2025-03-22historical $650
-
2025-03-12$650
-
2025-03-10historical $950
-
2025-02-01$950
-
2024-11-13historical
-
2024-09-16status Active
-
2024-08-26status Pending
-
2024-02-21status Active
-
2024-02-05status Pending
-
2024-01-15$59,000 Active
-
2023-09-13soldstatus $25,000
ⓘ Source: listings_history table (triggers on properties + properties_extension) + one-shot
backfill from property_details.listing_events for pre-trigger history.
Tax reassessment forecast OH · Partial reset (capped growth)
- Current annual tax
- $809 · $67/mo
- Projected year-2 tax
- $809 · $67/mo
- Expected delta
- $0/yr ($0/mo · 0.0%)
ⓘ Screening estimate from a state-policy table — verify with the county assessor before closing.
Climate risk First Street
- Flood 1/10 Low FEMA zone X (unshaded) · 0% chance over 30 yrs
- Wildfire 1/10 Low
- Heat 3/10 Moderate 7 d/yr ≥100°F today · 16 d/yr by 30 yrs out
- Wind 2/10 Low
- Air quality 2/10 Low 1 unhealthy d/yr today · 3 by 30 yrs out
Nearby sold comps map
Loading sold comps map…
Walkable amenities ~0.75 mi
Loading nearby amenities…
Taxation est. · year 1
- Rental income
- $20,568
- − Mortgage interest
- −$2,795
- − Property taxes
- −$809
- − Insurance
- −$250
- − Repairs & maintenance
- −$1,645
- − Management
- −$1,645
- − Depreciation
- −$1,452
- Taxable income
- $11,972
- Est. tax owed @ 24.0%
- −$2,873
- After-tax cash flow
- $9,177/yr
For passive investors: Depreciation is non-cash, so a rental often shows a tax loss while cash-flowing — sheltering income. Rental losses are passive: they offset passive income freely, and up to $25,000/yr can offset ordinary (W-2) income if you actively participate and your MAGI is under $100k (phasing out to $0 by $150k); unused losses carry forward. On sale, claimed depreciation is recaptured at up to 25%, and gains may owe capital-gains tax (a 1031 exchange can defer both). Figures are a year-1 estimate at your 24.0% rate — not tax advice; consult a CPA.
Schools (NCES district)
- District
- Toledo City
- NCES district ID
- 3904490
- Math proficiency
- 15% ▼ -16.00%
- Reading proficiency
- 24% ▼ -13.00%
- Median HH income
- $32,137
- Composite
- 15.76/100
- National rank
- #9276
- State rank
- #634 of 656 in OH
Livability — Toledo
- Score
- 66/100
- State rank
- #645
- US rank
- #11442
Category grades
Schools grade is shown separately in the Schools card above.
Census & demographics
- Census place
- Toledo, OH
- County
- Lucas County · 380,724 people
- City population
- 280,811
- Metro
- Toledo, OH
- Population (ZIP)
- 18,664
- Household income
- $62,042
- Rent vs Own
- Severe rent burden
- 298.0
Population outlook (Lucas County) Hauer SSP2
- Today (2025)
- 420,751 people
- By 2030
- 410,187 · -2.5%
- By 2040
- 384,019 · -8.7%
- By 2050
- 355,125 · -15.6%
- By 2075
- 291,683 · -30.7%
- By 2100
- 233,670 · -44.5%
Race, ethnicity, and origin ACS 2023
- Neighborhood character
- Predominantly White (77%)
- Race & ethnicity
- White 77% Black 11% Hispanic / Latino 8% Two or more races 6%
- Hispanic origin (detail)
- Mexican 6%
- Common ancestry
- Romanian 13% Lithuanian 5% Slovak 2%
- Foreign-born
- 1% · Canada
- Languages at home
- 96% English-only · Spanish 2% French/Haitian/Cajun 1%
Political lean MEDSL · Lucas
- 2024 margin
- D (+12.6) · D 55.8% · R 43.2%
- 2008→2024 swing
- -18.9pp toward R · 2008: 31.4pp · 2024: 12.6pp
- All cycles
- 2024: D+12.6 2020: D+16.8 2016: D+17.4 2012: D+30.4 2008: D+31.4
Not yet ingested
- Civics
- —
Market trends
- HPI YoY
- ▼ -79.15%
- Current HPI
- 245.2841
- Rent YoY
- —
- Metro
- Toledo, OH
- State GDP YoY
- ▲ 1.98%
- F500 in state
- 48
Industry mix (Fortune 500 HQ in OH)
| Industry | F500 HQs | Revenue |
|---|---|---|
| Insurance | 3 | $145B |
|
||
| Industrial Machinery | 3 | $49B |
|
||
| Financial Services | 3 | $24B |
|
||
| Consumer Goods | 2 | $93B |
|
||
| Aerospace / Defense | 2 | $47B |
|
||
| Utilities | 2 | $33B |
|
||
Price history
+111.6% since first listed20 events — show timeline
- 2026-06-06 Price Changed $52,900 NORIS
- 2026-05-18 Price Changed $54,900 NORIS
- 2026-05-15 Listed $58,900 NORIS
- 2026-05-14 Listing Removed — NORIS
- 2026-05-12 Price Changed $59,900 NORIS
- 2026-05-09 Price Changed $63,900 NORIS
- 2026-05-05 Listed $64,900 NORIS
- 2025-09-11 Sold (Public Records) $110,000 Public Records
- 2025-09-11 Sold (Public Records) $110,000 Public Records
- 2025-03-22 Rental Removed $650 RENTALBEAST
- 2025-03-12 Listed for Rent $650 RENTALBEAST
- 2025-03-10 Rental Removed $950 RENTALBEAST
- 2025-02-01 Listed for Rent $950 RENTALBEAST
- 2024-11-13 Listing Removed — NORIS
- 2024-09-16 Relisted — NORIS
- 2024-08-26 Pending — NORIS
- 2024-02-21 Relisted — NORIS
- 2024-02-05 Pending — NORIS
- 2024-01-15 Listed $59,000 NORIS
- 2023-09-13 Sold (Public Records) $25,000 Public Records
Property tax history
-1.0%/yrLatest (2025): $809 · -11.1% YoY. Source: county tax records.
Cash-flow waterfall
monthlySold comps — $/sqft
last 12 mo · ≤1 miLoading sold comps…