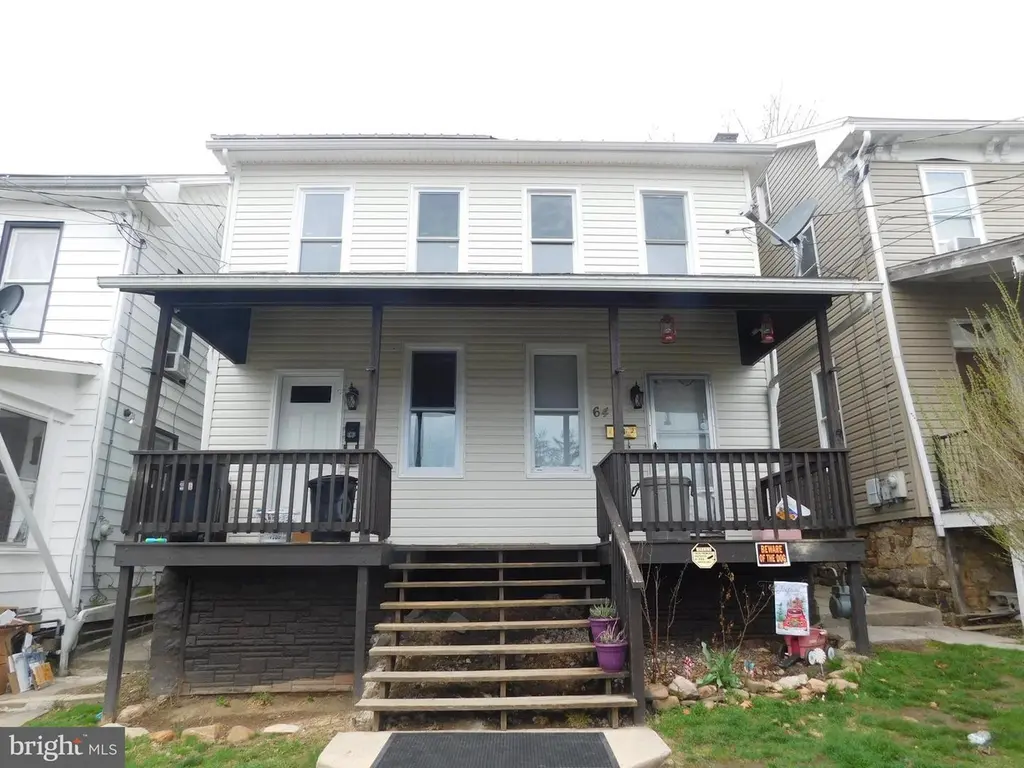
62 & 64 Catherine St · Lewistown, PA
Flood risk 1/10 · Minimal
- FEMA flood zone
- X (unshaded)
- Chance of flooding over 30 yrs
- 0.0%
- Est. flood insurance / yr
- $473 – $860
Fire risk 3/10 · Minor
- Est. fire insurance / yr
- $511 – $949
Heat risk 4/10 · Minor
- Hot days now (above 96°F)
- 7 days/yr
- Hot days in 30 yrs
- 16 days/yr
Wind risk 2/10 · Minimal
- Chance of severe wind over 30 yrs
- 0.0%
Air-quality risk 2/10 · Minimal
- Unhealthy air days now
- 0 days/yr
- Unhealthy air days in 30 yrs
- 1 days/yr
Risk factors via First Street. Map © Google.
Why this score? — see what drove the D grade
The composite is a weighted blend of 9 inputs, each scored 0–100. Each bar is that input's sub-score; the figure is the points it added to the 100-point composite (weight × sub-score).
- Cash flow +14.9/30.0
- ARV discount +7.5/15.0
- DSCR +4.6/10.0
- 1% rule +3.3/10.0
- Livability +3.3/5.0
- Schools +3.2/10.0
- Rent growth +2.5/5.0
- Condition / age +2.5/5.0
- Appreciation +0.0/10.0
$129,900
🖨 Deal sheet 📄 Offer letter ✓ Due diligence
Listing remarks MLS
Great investment opportunity or live in 1 side & collect rent from the other. #64 features a walk-in closet, central air & finished attic. Move-in condition. Both sides are currently tenant occupied. Tenants pay heat & electric. Large yard w/ off street parking. One side has a walk-up attic the other side has no attic. The deed references for both sides are 428-0849 & 2010-1331.
Key facts
- Remodeled
- Separate deeds
- Duplex
Tags
Neighborhood map
What this means for you Summary
Snapshot
- This is a 3-bed/1.0-bath other listed at $130k.
Deal economics
- At list price, monthly cash flow is $39 ($468/yr) — positive.
- The deal already cash-flows at list — no discount required.
- To meet the 1% rule (rent ≥ 1% of price), the offer needs to be $107k (17.4% below list).
- Recommended offer: $107k (17.4% below list) — sets the bar for 1% rule.
- Cap rate 6.7% vs local median 5.0% in Lewistown — top-decile yield for the area; either an underpriced asset or a hidden risk that comps aren't pricing in. Stress-test before assuming the spread holds.
Location & tenants
- Location reads 66/100 on livability (#1,057 in PA) — a middle-class / working-renter tenant base. Strengths: cost of living A+, housing A+, health & safety A+; Watch: schools C-, amenities D+, commute F.
- Mifflin County SD (town): math 28% / reading 49% proficiency, ranked #380 of 539 in PA (top 70%) — families likely to look elsewhere, expect single-tenant / working-renter base with shorter leases.
- Market conditions: 73 active listings in the ZIP; 58 units permitted in Mifflin County in 2024 (0 in 5+ unit buildings).
Forward outlook
- Local home prices are declining (-3.0%/yr); year-one equity from $898 of loan paydown is wiped out by about $4k of value loss. Plan a longer hold.
- Mifflin County population projected at -18% by 2050 — secular population decline; favor cash flow + early exit over multi-decade hold.
Negotiation context
- It's been on market 18 days — a 2% lower offer ($128k) is reasonable based on typical stale-listing flexibility.
- 4 sale attempts since 11y ago with the ask held roughly flat each time — persistent listings suggest the price (not the market) is what's stuck; bring a comps-based counter.
- Current owner paid $25k; list at $130k implies a 420% gain — meaningful room to come down on a strong offer.
Risks & watch-outs
- Watch-outs: built in 1935 — expect roof / HVAC / electrical / plumbing capex.
Questions for the listing agent
- Built in 1935 — when were the roof, HVAC, electrical panel, plumbing, and water heater last replaced?
- Is there a deadline driving the sale (1031 exchange, divorce, estate, relocation)? That informs how much negotiation room exists.
- The area grade is low — what's the realistic commute time and amenity access for the typical tenant pool here? Any planned neighborhood developments (good or bad) we should know about?
- What's the average days-on-market for RENTAL listings here right now (not sales)? A rising rental-DOM trend means longer vacancies and softer asking-rent achievability than the comps imply.
- What's the recent tenant-quality profile in this submarket — average credit score on applications, eviction rate, late-payment / NSF rate, and stable-employment percentage? A property-management company in the area should have these aggregated.
- How much new for-sale + rental construction is in the pipeline within 1–3 miles? Heavy new supply typically softens prices + rents 12–24 months out; constrained supply supports both.
Investment metrics
- 1% rule
- 0.83% ✗
- Cap rate
- 6.65%
- Cash-on-cash
- 1.29%
- DSCR
- 1.06
- GRM
- 10.1
CMA / ARV
No comps found within radius.
Projected returns pro-forma
-3.0% appreciation · 3.0% rent growth · sell at horizon
- IRR
- -14.3%
- Equity multiple
- 0.49×
- Total profit
- $-18,602
- Equity at exit
- $19,369
- IRR
- -5.6%
- Equity multiple
- 0.64×
- Total profit
- $-13,153
- Equity at exit
- $11,231
Cash invested: $36,372 (down + closing). Projections, not guarantees.
Landlord ↔ Tenant lean methodology
- Overall (STATE)
- 62 Landlord-Friendly
- State Pennsylvania
- 62 Landlord-Friendly · EVEN
- County
- — inherits STATE
- City
- — inherits STATE
ZIP-level market 17044
- Home prices YoY
- -6.7%
- Active inventory
- 73
- Price-to-rent
- 10.1×
Monthly cashflow live
- Estimated rent
- $1,073 medium interval (Pro) →
- Mortgage (P&I)
- −$681
- Tax from tax record
- −$73 /mo · $879/yr
- Insurance
- −$54
- HOA
- −$0
- Vacancy / Maint / Mgmt
- −$225
- Net cashflow
- $39
Break-even live
UW: 25.0% down · 7.5% · 30yr · 1.5% tax · 5.0% vac · 8.0% maint · 8.0% mgmt
Financing live
Cash to close
- Down payment
- $32,475
- Closing costs
- $3,897
- Reserves months
- —
- Total cash needed
- —
Loan-product check · same deal, 3 products live
Conventional
25% down · 7.5% · 30yr
- Down + closing
- —
- Monthly P&I
- —
- Monthly cashflow
- —
- DSCR
- —
- Eligible?
- —
Personal DTI + credit; lowest rate.
DSCR
20% down · 8.5% · 30yr
- Down + closing
- —
- Monthly P&I
- —
- Monthly cashflow
- —
- DSCR
- —
- Eligible?
- —
No personal income docs; deal must DSCR.
Hard money
10% down · 12.0% · 12mo
- Down + closing
- —
- Monthly P&I
- —
- Monthly cashflow
- —
- DSCR
- —
- Eligible?
- —
Short-term bridge; refi at stabilization.
Listing history 13 events
-
2026-04-24status Pending
-
2026-04-06$129,900 Active
-
2024-01-04soldstatus $25,000 Closed
-
2024-01-04soldstatus $24,000
-
2023-12-18status Pending
-
2023-09-18$32,000 Active
-
2015-09-23soldstatus $18,100
-
2015-09-22soldstatus $36,500 405-char remark
Show marketing remark (405 chars)
Great investment opportunity or live in 1 side & collect rent from the other. #64 features a walk-in closet, central air & finished attic. Move-in condition. Both sides are currently tenant occupied. Tenants pay heat & electric. Large yard w/ off street parking. One side has a walk-up attic the other side has no attic. The deed references for both sides are 428-0849 & 2010-1331.
-
2015-09-22soldstatus $36,500
Show marketing remark (405 chars)
Great investment opportunity or live in 1 side & collect rent from the other. #64 features a walk-in closet, central air & finished attic. Move-in condition. Both sides are currently tenant occupied. Tenants pay heat & electric. Large yard w/ off street parking. One side has a walk-up attic the other side has no attic. The deed references for both sides are 428-0849 & 2010-1331.
-
2015-05-01$39,900 405-char remark
Show marketing remark (405 chars)
Great investment opportunity or live in 1 side & collect rent from the other. #64 features a walk-in closet, central air & finished attic. Move-in condition. Both sides are currently tenant occupied. Tenants pay heat & electric. Large yard w/ off street parking. One side has a walk-up attic the other side has no attic. The deed references for both sides are 428-0849 & 2010-1331.
-
2015-05-01$39,900
Show marketing remark (405 chars)
Great investment opportunity or live in 1 side & collect rent from the other. #64 features a walk-in closet, central air & finished attic. Move-in condition. Both sides are currently tenant occupied. Tenants pay heat & electric. Large yard w/ off street parking. One side has a walk-up attic the other side has no attic. The deed references for both sides are 428-0849 & 2010-1331.
-
2010-04-06soldstatus $16,000
-
1989-07-10soldstatus $20,500
ⓘ Source: listings_history table (triggers on properties + properties_extension) + one-shot
backfill from property_details.listing_events for pre-trigger history.
Tax reassessment forecast PA · Partial reset (capped growth)
- Current annual tax
- $879 · $73/mo
- Projected year-2 tax
- $1,466 · $122/mo
- Expected delta
- +$587/yr (+$49/mo · 66.7%)
ⓘ Screening estimate from a state-policy table — verify with the county assessor before closing.
Climate risk First Street
- Flood 1/10 Low FEMA zone X (unshaded) · 0% chance over 30 yrs
- Wildfire 3/10 Moderate
- Heat 4/10 Moderate 7 d/yr ≥96°F today · 16 d/yr by 30 yrs out
- Wind 2/10 Low 0% chance of damaging wind over 30 yrs
- Air quality 2/10 Low 0 unhealthy d/yr today · 1 by 30 yrs out
Nearby sold comps map
Loading sold comps map…
Walkable amenities ~0.75 mi
Loading nearby amenities…
Taxation est. · year 1
- Rental income
- $12,876
- − Mortgage interest
- −$7,276
- − Property taxes
- −$879
- − Insurance
- −$650
- − Repairs & maintenance
- −$1,030
- − Management
- −$1,030
- − Depreciation
- −$3,779
- Taxable loss
- −$1,769
- Est. tax savings @ 24.0%
- +$424
- After-tax cash flow
- $893/yr
For passive investors: Depreciation is non-cash, so a rental often shows a tax loss while cash-flowing — sheltering income. Rental losses are passive: they offset passive income freely, and up to $25,000/yr can offset ordinary (W-2) income if you actively participate and your MAGI is under $100k (phasing out to $0 by $150k); unused losses carry forward. On sale, claimed depreciation is recaptured at up to 25%, and gains may owe capital-gains tax (a 1031 exchange can defer both). Figures are a year-1 estimate at your 24.0% rate — not tax advice; consult a CPA.
Schools (NCES district)
- District
- Mifflin County SD
- NCES district ID
- 4215290
- Math proficiency
- 28% ▼ -7.00%
- Reading proficiency
- 49% ▼ -9.00%
- Median HH income
- $40,718
- Composite
- 32.28/100
- National rank
- #5755
- State rank
- #380 of 539 in PA
Livability — Lewistown
- Score
- 66/100
- State rank
- #1057
- US rank
- #11920
Category grades
Schools grade is shown separately in the Schools card above.
Census & demographics
- Census place
- Lewistown, PA
- Population (ZIP)
- 20,526
Population outlook (Mifflin County) Hauer SSP2
- Today (2025)
- 44,611 people
- By 2030
- 43,212 · -3.1%
- By 2040
- 40,197 · -9.9%
- By 2050
- 36,813 · -17.5%
- By 2075
- 28,833 · -35.4%
- By 2100
- 20,296 · -54.5%
Race, ethnicity, and origin ACS 2023
- Neighborhood character
- Predominantly White (92%)
- Race & ethnicity
- White 92% Two or more races 6% Hispanic / Latino 3%
- Common ancestry
- Romanian 2% Polish 2% Serbian 1%
- Foreign-born
- 1%
- Languages at home
- 97% English-only · Spanish 1% German/W. Germanic 1%
Political lean MEDSL · Mifflin
- 2024 margin
- Solid R (+56.4) · D 21.4% · R 77.9%
- 2008→2024 swing
- -22.8pp toward R · 2008: -33.7pp · 2024: -56.4pp
- All cycles
- 2024: R+56.4 2020: R+56.1 2016: R+57.5 2012: R+46.8 2008: R+33.7
Not yet ingested
- Civics
- —
Market trends
- HPI YoY
- ▼ -15.27%
- Current HPI
- 214.2729
- Rent YoY
- —
- Metro
- —
- State GDP YoY
- ▲ 1.68%
- F500 in state
- 34
Industry mix (Fortune 500 HQ in PA)
| Industry | F500 HQs | Revenue |
|---|---|---|
| Healthcare | 2 | $309B |
|
||
| Insurance | 2 | $27B |
|
||
| Telecommunications / Media | 1 | $124B |
|
||
| Industrial Distribution | 1 | $22B |
|
||
| Financial Services | 1 | $20B |
|
||
| Chemicals / Materials | 1 | $18B |
|
||
Price history
+533.7% since first listed13 events — show timeline
- 2026-04-24 Pending — BRIGHT MLS
- 2026-04-06 Listed $129,900 BRIGHT MLS
- 2024-01-04 Sold (Public Records) $24,000 Public Records
- 2024-01-04 Sold (MLS) $25,000 BRIGHT MLS
- 2023-12-18 Pending — BRIGHT MLS
- 2023-09-18 Listed $32,000 BRIGHT MLS
- 2015-09-23 Sold (Public Records) $18,100 Public Records
- 2015-09-22 Sold (MLS) $36,500 BRIGHT MLS
- 2015-09-22 Sold (MLS) $36,500 BRIGHT MLS
- 2015-05-01 Listed $39,900 BRIGHT MLS
- 2015-05-01 Listed $39,900 BRIGHT MLS
- 2010-04-06 Sold (Public Records) $16,000 Public Records
- 1989-07-10 Sold (Public Records) $20,500 Public Records
Property tax history
+0.8%/yrLatest (2026): $879 · +2.8% YoY. Source: county tax records.
Cash-flow waterfall
monthlySold comps — $/sqft
last 12 mo · ≤1 miLoading sold comps…