 Duplex
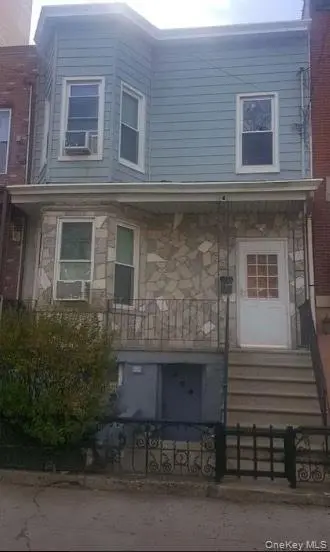
2304 30th Ave · New York, NY
Flood risk 4/10 · Minor
- FEMA flood zone
- X (unshaded)
- Chance of flooding over 30 yrs
- 0.22%
- Est. flood insurance / yr
- $507 – $1,088
Fire risk 1/10 · Minimal
- Est. fire insurance / yr
- $691 – $1,283
Heat risk 6/10 · Moderate
- Hot days now (above 99°F)
- 7 days/yr
- Hot days in 30 yrs
- 15 days/yr
Wind risk 6/10 · Moderate
- Chance of severe wind over 30 yrs
- 27.0%
Air-quality risk 4/10 · Minor
- Unhealthy air days now
- 5 days/yr
- Unhealthy air days in 30 yrs
- 6 days/yr
Risk factors via First Street. Map © Google.
Why this score? — see what drove the B- grade
The composite is a weighted blend of 9 inputs, each scored 0–100. Each bar is that input's sub-score; the figure is the points it added to the 100-point composite (weight × sub-score).
- Cash flow +20.8/30.0
- ARV discount +15.0/15.0
- DSCR +6.6/10.0
- Appreciation +5.1/10.0
- Schools +5.0/10.0
- 1% rule +4.6/10.0
- Livability +3.8/5.0
- Rent growth +3.7/5.0
- Condition / age +2.5/5.0
$1,195,000
🖨 Deal sheet 📄 Offer letter ✓ Due diligence
Multi-family units
County records classify this as Multi-Family (2-4 Unit). Listing-text estimate: 2 units. confirmed
Listing remarks
Welcome to a legal Two-Family home located in a prime, desirable neighborhood of Astoria. This property offers many options for investors and users, considering R6A zoning, FAR 3, over 4700 square foot buildable, or you can renovate it and keep it as either a One- or Two Family. The property is within walking distance to N subway train, just 10 minutes from NYC, as well as restaurants, shopping areas and parks. The first floor has 2 bedroom 1 bathroom apartment and the second floor 2 bedroom 1 bathroom apartment. The property will be delivered Vacant.
Key facts
- 1,592 sq ft lot
- Built 1920
- Listed 80 days
Property features AI
Exterior
- Parking: No carport; No designated parking
- Utilities: Public sewer; Electricity connected; Natural gas connected
- Home design: Duplex
- Construction: Aluminum siding construction
- Exterior features: Aluminum siding; Not waterfront
Interior
- Bedrooms: One 4-bedroom unit (multi-unit property)
- Flooring: Hardwood floors
- Bathrooms: Two full bathrooms
- Heating & cooling: Natural gas heating; Radiant heat; Wall/window air conditioning units
- Interior features: First-floor bedroom; First-floor full bathroom; Full unfinished basement
Neighborhood map
What this means for you Summary
Snapshot
- This is a 2 × 2-bed/1.0-bath units multifamily listed at $1.20M.
Deal economics
- At list price, monthly cash flow is $2k ($20k/yr) — positive. Per door: $821/mo.
- The deal already cash-flows at list — no discount required.
- To meet the 1% rule (rent ≥ 1% of price), the offer needs to be $1.14M (4.3% below list).
- Recommended offer: $1.12M (6.0% below list) — sets the bar for market timing.
- Cap rate 7.9% vs local median 2.6% in New York — top-decile yield for the area; either an underpriced asset or a hidden risk that comps aren't pricing in. Stress-test before assuming the spread holds.
Location & tenants
- Location reads 75/100 on livability (#268 in NY, #4,188 nationally) — a middle-class / working-renter tenant base. Strengths: amenities A+, commute A+, health & safety A; Watch: crime F, cost of living F.
- Market conditions: Rents rising fast (+4.8%/yr); 114 active listings in the ZIP; 3 comparable units currently listed for rent nearby; rentals at typical pace (median 19d on market — plan ~3-4 weeks tenant-placement turnaround); solid renter incomes; 5,302 units permitted in Queens County in 2024 (4,918 in 5+ unit buildings).
- At $11,439/mo this rent would consume 142% of the median local household income ($97k/yr) (locally 2407% of renters already pay >50% of income on rent) — very limited rent-growth headroom before tenants either downsize or default.
Forward outlook
- In year one you build about $10k of equity ($8k loan paydown + $2k appreciation (0.2% local appreciation)).
- Queens County population projected at +16% by 2050 — long-run rental-demand tailwind backs the buy-and-hold thesis.
- At projected returns (0.2% appreciation + 4.8% rent growth), your $335k cash investment doubles in ~7 years — after that, you're playing with house money.
- By year 6, paydown + projected appreciation supports a ~$69k cash-out refi (75% LTV) — recoverable capital for the next deal without selling this one.
Negotiation context
- It's been on market 80 days — a 6% lower offer ($1.12M) is reasonable based on typical stale-listing flexibility.
- 8 sale attempts since 11y ago; this cycle's ask has dropped $155k (11%) from the opening price — seller is motivated, your offer sets the floor, not the list.
Risks & watch-outs
- Watch-outs: built in 1920 — expect roof / HVAC / electrical / plumbing capex.
- Climate carrying-cost: major wind risk, 27% chance of damaging wind over 30y; extreme-heat days projected 7→15/yr by 2055 (HVAC capex compounding) — expect insurance premiums to compound above CPI over the hold.
Questions for the listing agent
- It's been on market 80 days. Have you received any prior offers? Is the seller open to a 6% concession, seller financing, or rate buy-down credit?
- Can we see the unit-by-unit rent roll, current vacancy, and any below-market leases? What's the average tenancy length?
- What capital expenditures (roof, boiler, parking lot, exteriors) have been made in the last 5 years, and what's planned in the next 2?
- Built in 1920 — when were the roof, HVAC, electrical panel, plumbing, and water heater last replaced?
- Why hasn't it sold? Are there any deal-killer items the seller is aware of (foundation, flood, title, zoning, code violations)?
- Is there a deadline driving the sale (1031 exchange, divorce, estate, relocation)? That informs how much negotiation room exists.
- Schools are B-rated — typically a magnet for longer-tenancy family renters. What's the average tenant stay here, and is there a school-zone premium baked into asking?
- Crime grade is F in this area — have there been break-ins, vandalism, or insurance claims at this property in the last 3 years? What carrier currently insures it and at what premium?
- What's the average days-on-market for RENTAL listings here right now (not sales)? A rising rental-DOM trend means longer vacancies and softer asking-rent achievability than the comps imply.
- What's the recent tenant-quality profile in this submarket — average credit score on applications, eviction rate, late-payment / NSF rate, and stable-employment percentage? A property-management company in the area should have these aggregated.
- How much new apartment / multifamily construction is in the pipeline within 1–3 miles? Heavy new supply (>2% of stock underway) typically softens rents 12–24 months out; light construction supports rent growth.
Investment metrics
- 1% rule
- 0.96% ✗
- Cap rate
- 7.94%
- Cash-on-cash
- 5.89%
- DSCR
- 1.26
- GRM
- 8.7
CMA / ARV
- ARV (on-the-fly)
- $1,471,808
- Comps found
- 9
Show comp detail 9 sales within ~0.75 mi
| Address | Dist | Beds/Ba | Sqft | Sold | Price | $/sf | Match |
|---|---|---|---|---|---|---|---|
| 31-71 32 St | 0.50mi | 4/2.0 | 1,764 (-0%) | 1mo | $1,475,000 | $836 | 75 |
| 3004 14th St | 0.23mi | 5/2.0 (+1) | 1,800 (+2%) | 10mo | $1,150,000 | $639 | 73 |
| 2308 31 Dr | 0.32mi | 4/2.0 | 1,566 (-12%) | 5mo | $1,130,000 | $722 | 62 |
| 2364 35th St | 0.73mi | 4/3.0 | 1,768 (-0%) | 0mo | $1,471,000 | $832 | 61 |
| 3329 29th St Unit 2FAM | 0.54mi | 5/2.0 (+1) | 1,800 (+2%) | 13mo | $1,725,000 | $958 | 56 |
| 3361 29th St | 0.59mi | 4/— | 1,890 (+7%) | 6mo | $1,510,000 | $799 | 56 |
| 26-19 14th Pl | 0.34mi | 3/3.0 (-1) | 1,600 (-10%) | 4mo | $1,339,000 | $837 | 56 |
| 1916 23rd Rd | 0.72mi | 3/2.0 (-1) | 1,590 (-10%) | 6mo | $1,380,000 | $868 | 39 |
| 23-60 33rd St | 0.72mi | 3/3.0 (-1) | 1,860 (+5%) | 16mo | $1,300,000 | $699 | 36 |
Match score weights: distance 35% · size 25% · config 20% · recency 20%. Top-matched comps best support the ARV.
Projected returns pro-forma
0.16% appreciation · 4.79% rent growth · sell at horizon
- IRR
- 6.1%
- Equity multiple
- 1.30×
- Total profit
- $99,443
- Equity at exit
- $356,828
- IRR
- 12.2%
- Equity multiple
- 2.42×
- Total profit
- $476,297
- Equity at exit
- $436,855
Cash invested: $334,600 (down + closing). Projections, not guarantees.
Landlord ↔ Tenant lean methodology
- Overall (CITY)
- 0 Strongly Tenant-Friendly
- State New York
- 15 Strongly Tenant-Friendly · D+10
- County
- — inherits STATE
- City New York
- 0 Strongly Tenant-Friendly · D+34
ZIP-level market 11102
- Home prices YoY
- 0.1%
- Rents YoY
- 4.8%
- Active inventory
- 114
- Price-to-rent
- 17.4×
Monthly cashflow live
- Estimated rent
- $11,439 high interval (Pro) →
- Mortgage (P&I)
- −$6,267
- Tax from tax record
- −$631 /mo · $7,569/yr
- Insurance
- −$498
- HOA
- −$0
- Vacancy / Maint / Mgmt
- −$2,402
- Net cashflow
- $1,641
Break-even live
2-unit breakdown (identical units grouped — click to expand)
| Units | Beds | Baths | Est. rent |
|---|---|---|---|
| 2× units | 2 | 1 | $11,438 |
| #1 | 2 | 1 | $5,719 |
| #2 | 2 | 1 | $5,719 |
| Total (2 units) | $11,439 | ||
UW: 25.0% down · 7.5% · 30yr · 1.5% tax · 5.0% vac · 8.0% maint · 8.0% mgmt
Financing live
Cash to close
- Down payment
- $298,750
- Closing costs
- $35,850
- Reserves months
- —
- Total cash needed
- —
Loan-product check · same deal, 3 products live
Conventional
25% down · 7.5% · 30yr
- Down + closing
- —
- Monthly P&I
- —
- Monthly cashflow
- —
- DSCR
- —
- Eligible?
- —
Personal DTI + credit; lowest rate.
DSCR
20% down · 8.5% · 30yr
- Down + closing
- —
- Monthly P&I
- —
- Monthly cashflow
- —
- DSCR
- —
- Eligible?
- —
No personal income docs; deal must DSCR.
Hard money
10% down · 12.0% · 12mo
- Down + closing
- —
- Monthly P&I
- —
- Monthly cashflow
- —
- DSCR
- —
- Eligible?
- —
Short-term bridge; refi at stabilization.
Rent comps 3 comps
| Address | Beds | Baths | Sqft | Rent | $/sqft | DOM | Units | Dist |
|---|---|---|---|---|---|---|---|---|
| 2812 37th St Astoria, NY | 3.0 | 1.5 | 2200 | $4,700 | $2.14 | 18d | 1 | 0.57mi |
| 888 Main St New York, NY | 1.0–3.0 | 1.0–2.0 | 963 | $7,375 | $7.66 | 6d | 7 | 0.94mi |
| 344 E 84th St #1 New York, NY | 3.0 | 2.5 | 2100 | $14,000 | $6.67 | 22d | 1 | 1.40mi |
Listing history 35 events
-
2026-06-18days on market $1,195,000 Active 80 DOM
-
2026-06-17days on market $1,195,000 Active 79 DOM
-
2026-06-15days on market $1,195,000 Active 77 DOM
-
2026-06-13days on market $1,195,000 Active 75 DOM
-
2026-06-10days on market $1,195,000 Active 71 DOM
-
2026-06-08days on market $1,195,000 Active 70 DOM
-
2026-06-08days on market $1,195,000 Active 69 DOM
-
2026-06-04days on market $1,195,000 Active 66 DOM
-
2026-06-03days on market $1,195,000 Active 65 DOM
-
2026-06-01days on market $1,195,000 Active 63 DOM
-
2026-05-31days on market $1,195,000 Active 62 DOM
-
2026-05-13price $1,195,000
-
2026-03-30$1,350,000 Active
-
2021-11-18historical
-
2020-09-21price $1,349,000
-
2020-04-24status Active
-
2020-03-27status Pending
-
2019-07-26status Under Contract
-
2018-11-02price $1,450,000
-
2018-10-22price $1,520,000
-
2018-01-16$1,580,000 New
-
2016-11-28soldstatus $1,100,000
-
2016-11-21soldstatus $1,100,000
-
2016-11-21soldstatus $1,100,000 Closed
-
2016-11-18soldstatus $1,100,000
-
2016-11-18soldstatus $1,100,000 Closed
-
2016-08-22status Under Contract
-
2016-08-22historical
-
2016-08-21historical
-
2016-06-13$1,200,000 New
-
2016-06-13$1,200,000
-
2016-05-21$1,200,000
-
2016-01-22status Under Contract
-
2015-12-03$1,200,000 New
-
2015-12-02$1,200,000
ⓘ Source: listings_history table (triggers on properties + properties_extension) + one-shot
backfill from property_details.listing_events for pre-trigger history.
Tax reassessment forecast NY · Partial reset (capped growth)
- Current annual tax
- $7,569 · $631/mo
- Projected year-2 tax
- $13,882 · $1,157/mo
- Expected delta
- +$6,313/yr (+$526/mo · 83.4%)
ⓘ Screening estimate from a state-policy table — verify with the county assessor before closing.
Climate risk First Street
- Flood 4/10 Moderate FEMA zone X (unshaded) · 22% chance over 30 yrs
- Wildfire 1/10 Low
- Heat 6/10 Major 7 d/yr ≥99°F today · 15 d/yr by 30 yrs out
- Wind 6/10 Major 27% chance of damaging wind over 30 yrs
- Air quality 4/10 Moderate 5 unhealthy d/yr today · 6 by 30 yrs out
Nearby sold comps map
Loading sold comps map…
Walkable amenities ~0.75 mi
Loading nearby amenities…
Taxation est. · year 1
- Rental income
- $137,268
- − Mortgage interest
- −$66,939
- − Property taxes
- −$7,569
- − Insurance
- −$5,975
- − Repairs & maintenance
- −$10,981
- − Management
- −$10,981
- − Depreciation
- −$34,764
- Taxable income
- $59
- Est. tax owed @ 24.0%
- −$14
- After-tax cash flow
- $19,683/yr
For passive investors: Depreciation is non-cash, so a rental often shows a tax loss while cash-flowing — sheltering income. Rental losses are passive: they offset passive income freely, and up to $25,000/yr can offset ordinary (W-2) income if you actively participate and your MAGI is under $100k (phasing out to $0 by $150k); unused losses carry forward. On sale, claimed depreciation is recaptured at up to 25%, and gains may owe capital-gains tax (a 1031 exchange can defer both). Figures are a year-1 estimate at your 24.0% rate — not tax advice; consult a CPA.
Schools (NCES district)
No district data.
Livability — New York
- Score
- 75/100
- State rank
- #268
- US rank
- #4188
Category grades
Schools grade is shown separately in the Schools card above.
Census & demographics
- Census place
- New York, NY
- County
- Queens County · 1,914,869 people
- City population
- 7,731,280
- Metro
- New York-Newark-Jersey City, NY-NJ-PA
- Population (ZIP)
- 28,503
- Household income
- $96,617
- Rent vs Own
- Severe rent burden
- 2407.0
Population outlook (Queens County) Hauer SSP2
- Today (2025)
- 2,546,320 people
- By 2030
- 2,643,059 · +3.8%
- By 2040
- 2,815,563 · +10.6%
- By 2050
- 2,944,423 · +15.6%
- By 2075
- 3,123,338 · +22.7%
- By 2100
- 3,098,688 · +21.7%
Race, ethnicity, and origin ACS 2023
- Neighborhood character
- Diverse neighborhood (Simpson 0.69)
- Race & ethnicity
- White 47% Hispanic / Latino 26% Asian 15% Two or more races 12% Black 6%
- Hispanic origin (detail)
- Mexican 4% Puerto Rican 5% Dominican 3%
- Common ancestry
- Romanian 2% Lithuanian 1% Italian 1%
- Foreign-born
- 34% · Canada, China, Jamaica
- Languages at home
- 55% English-only · Spanish 21% Other Indo-European 14% Russian/Polish/Slavic 3%
Political lean MEDSL · Queens
- 2024 margin
- Strong D (+24.6) · D 62.3% · R 37.7%
- 2008→2024 swing
- -26.2pp toward R · 2008: 50.8pp · 2024: 24.6pp
- All cycles
- 2024: D+24.6 2020: D+45.2 2016: D+53.4 2012: D+58.5 2008: D+50.8
Not yet ingested
- Civics
- —
Market trends
- HPI YoY
- ▲ 0.16%
- Current HPI
- 144.3118
- Rent YoY
- ▲ 4.79%
- Metro
- New York-Newark-Jersey City, NY-NJ-PA
- State GDP YoY
- ▲ 2.60%
- F500 in state
- 92
Industry mix (Fortune 500 HQ in NY)
| Industry | F500 HQs | Revenue |
|---|---|---|
| Financial Services | 10 | $950B |
|
||
| Consumer Goods | 9 | $162B |
|
||
| Insurance | 4 | $225B |
|
||
| Telecommunications | 2 | $144B |
|
||
| Pharmaceuticals | 2 | $112B |
|
||
| Media / Entertainment | 2 | $69B |
|
||
Price history
-0.4% since first listed24 events — show timeline
- 2026-05-13 Price Changed $1,195,000 OneKey® MLS as Distributed by MLS Grid
- 2026-03-30 Listed $1,350,000 OneKey® MLS as Distributed by MLS Grid
- 2021-11-18 Listing Removed — OneKey® MLS as Distributed by MLS Grid
- 2020-09-21 Price Changed $1,349,000 OneKey® MLS as Distributed by MLS Grid
- 2020-04-24 Relisted — OneKey® MLS as Distributed by MLS Grid
- 2020-03-27 Pending — OneKey® MLS as Distributed by MLS Grid
- 2019-07-26 Pending — OneKey® MLS as Distributed by MLS Grid
- 2018-11-02 Price Changed $1,450,000 OneKey® MLS as Distributed by MLS Grid
- 2018-10-22 Price Changed $1,520,000 OneKey® MLS as Distributed by MLS Grid
- 2018-01-16 Listed $1,580,000 OneKey® MLS as Distributed by MLS Grid
- 2016-11-28 Sold (Public Records) $1,100,000 Public Records
- 2016-11-21 Sold (MLS) $1,100,000 OneKey® MLS as Distributed by MLS Grid
- 2016-11-21 Sold (MLS) $1,100,000 MLSLI
- 2016-11-18 Sold (MLS) $1,100,000 OneKey® MLS as Distributed by MLS Grid
- 2016-11-18 Sold (MLS) $1,100,000 MLSLI
- 2016-08-22 Pending — MLSLI
- 2016-08-22 Delisted — MLSLI
- 2016-08-21 Listing Removed — OneKey® MLS as Distributed by MLS Grid
- 2016-06-13 Listed $1,200,000 MLSLI
- 2016-06-13 Listed $1,200,000 OneKey® MLS as Distributed by MLS Grid
- 2016-05-21 Listed $1,200,000 OneKey® MLS as Distributed by MLS Grid
- 2016-01-22 Pending — MLSLI
- 2015-12-03 Listed $1,200,000 MLSLI
- 2015-12-02 Listed $1,200,000 OneKey® MLS as Distributed by MLS Grid
Property tax history
+6.5%/yrLatest (2025): $7,569 · +3.4% YoY. Source: county tax records.
Cash-flow waterfall
monthlySold comps — $/sqft
last 12 mo · ≤1 miLoading sold comps…