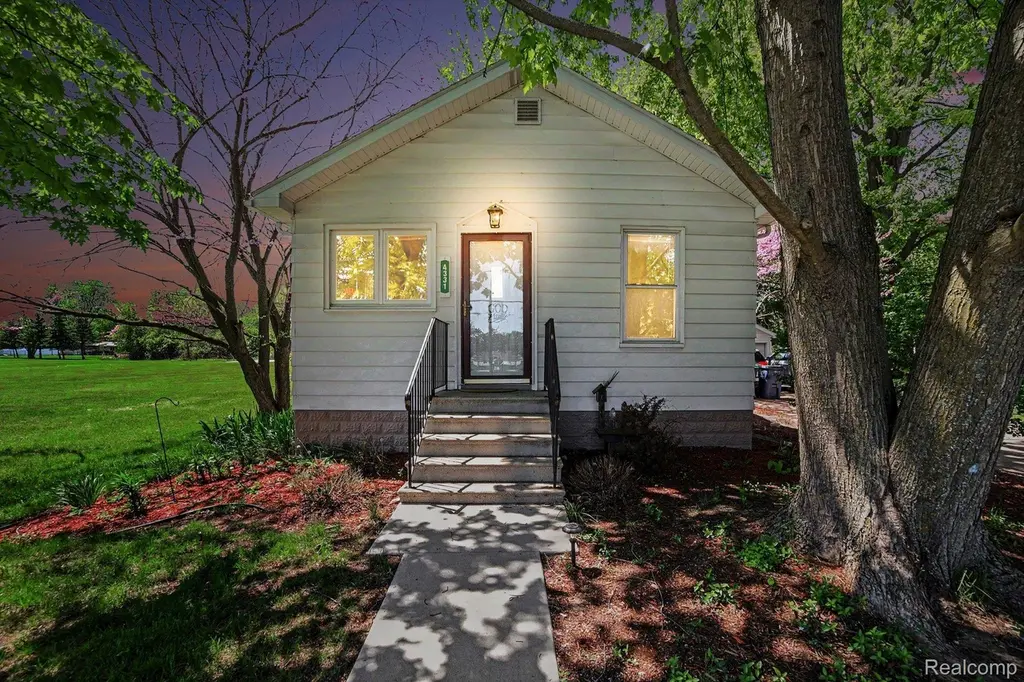
4331 N Michigan Ave · Zilwaukee, MI
Flood risk 1/10 · Minimal
- FEMA flood zone
- X (unshaded)
- Chance of flooding over 30 yrs
- 0.0%
- Est. flood insurance / yr
- $507 – $1,088
Fire risk 1/10 · Minimal
- Est. fire insurance / yr
- $784 – $1,456
Heat risk 2/10 · Minimal
- Hot days now (above 99°F)
- 7 days/yr
- Hot days in 30 yrs
- 14 days/yr
Wind risk 1/10 · Minimal
- Chance of severe wind over 30 yrs
- —
Air-quality risk 2/10 · Minimal
- Unhealthy air days now
- 1 days/yr
- Unhealthy air days in 30 yrs
- 2 days/yr
Risk factors via First Street. Map © Google.
Why this score? — see what drove the B grade
The composite is a weighted blend of 9 inputs, each scored 0–100. Each bar is that input's sub-score; the figure is the points it added to the 100-point composite (weight × sub-score).
- Cash flow +30.0/30.0
- ARV discount +15.0/15.0
- DSCR +10.0/10.0
- 1% rule +9.4/10.0
- Livability +3.8/5.0
- Rent growth +2.5/5.0
- Condition / age +2.5/5.0
- Schools +1.5/10.0
- Appreciation +0.0/10.0
$79,900
🖨 Deal sheet 📄 Offer letter ✓ Due diligence
Listing remarks MLS
Here's your chance at owning a home or income opportunity at an amazing price! This 2 bed 1 bath home has many newer upgrades including flooring in the work areas of the home (2025), front door (2025) and more. There's a 9 x 4 walk-in pantry off the kitchen for convenience. Separate laundry area. Room to entertain with your backyard deck (2019). There's plenty of space to play or garden with your almost 300 ft lot! Storage space in the detached 2 car garage. All appliances stay. BATVAI
Key facts
- Backyard deck
- Walk-in pantry
- Detached garage
Tags
Property features AI
Exterior
- Parking: Detached 2-car garage
- Utilities: Public water; Public sewer
- Home design: Single family residence; One story; Ground-level entry with steps
- Construction: Aluminum siding; Vinyl siding
- Exterior features: Deck; Paved road access; Lot approximately 0.45 acres (66 x 297)
Interior
- Kitchen: Free‑standing electric range; Free‑standing refrigerator; Portable dishwasher
- Bedrooms: 6 total rooms (includes bedrooms and living spaces)
- Bathrooms: 1 full bathroom
- Heating & cooling: Central air conditioning; Forced air heating; Natural gas heating
- Interior features: Ceiling fan(s); Electric water heater; Portable dishwasher; Crawl space basement
- Laundry & utility: Dedicated laundry room; Washer; Dryer
Neighborhood map
What this means for you Summary
Snapshot
- This is a 2-bed/1.0-bath single-family listed at $80k.
Deal economics
- At list price, monthly cash flow is $433 ($5k/yr) — positive.
- The deal already cash-flows at list — no discount required.
- Meets the 1% rule at list price ($1k rent vs $80k).
Location & tenants
- Location reads 76/100 on livability (#138 in MI, #3,375 nationally) — a middle-class / working-renter tenant base. Strengths: crime A+, cost of living A+, housing A+; Watch: schools F, amenities F, commute F.
- Carrollton Public Schools (suburban): math 9% / reading 26% proficiency, ranked #485 of 540 in MI (top 90%) — low school quality limits family demand, transient renter base, plan for 1-2y turnover; 72% free/reduced lunch — lower-income household profile, screen leases tightly.
- Market conditions: 70 active listings in the ZIP; 1 comparable units currently listed for rent nearby; 154 units permitted in Saginaw County in 2024 (0 in 5+ unit buildings).
Forward outlook
- Local home prices are declining (-3.0%/yr); year-one equity from $552 of loan paydown is wiped out by about $2k of value loss. Plan a longer hold.
- Saginaw County population projected at -25% by 2050 — secular population decline; favor cash flow + early exit over multi-decade hold.
- At projected returns (-3.0% appreciation + 3.0% rent growth), your $22k cash investment doubles in ~6 years — after that, you're playing with house money.
Negotiation context
- Only 8 days on market — expect competitive offers; lowballing is unlikely to land.
- 4 sale attempts with the ask held roughly flat each time — persistent listings suggest the price (not the market) is what's stuck; bring a comps-based counter.
Risks & watch-outs
- Watch-outs: built in 1932 — expect roof / HVAC / electrical / plumbing capex.
Questions for the listing agent
- Built in 1932 — when were the roof, HVAC, electrical panel, plumbing, and water heater last replaced?
- Is there a deadline driving the sale (1031 exchange, divorce, estate, relocation)? That informs how much negotiation room exists.
- Schools are F-rated, which usually means shorter tenancies and higher turnover. Who's the typical renter profile here, and what's been the actual vacancy rate?
- What's the average days-on-market for RENTAL listings here right now (not sales)? A rising rental-DOM trend means longer vacancies and softer asking-rent achievability than the comps imply.
- What's the recent tenant-quality profile in this submarket — average credit score on applications, eviction rate, late-payment / NSF rate, and stable-employment percentage? A property-management company in the area should have these aggregated.
- How much new for-sale + rental construction is in the pipeline within 1–3 miles? Heavy new supply typically softens prices + rents 12–24 months out; constrained supply supports both.
Investment metrics
- 1% rule
- 1.44% ✓
- Cap rate
- 12.79%
- Cash-on-cash
- 23.20%
- DSCR
- 2.03
- GRM
- 5.8
CMA / ARV
- ARV (on-the-fly)
- $118,680
- Comps found
- 11
Show comp detail 11 sales within ~0.75 mi
| Address | Dist | Beds/Ba | Sqft | Sold | Price | $/sf | Match |
|---|---|---|---|---|---|---|---|
| 1580 Bel Air St | 0.16mi | 3/1.0 (+1) | 952 (+4%) | 11mo | $141,000 | $148 | 73 |
| 3365 Bobendick St | 0.17mi | 3/1.0 (+1) | 1,025 (+11%) | 5mo | $123,000 | $120 | 64 |
| 3805 Ventura Dr | 0.60mi | 3/1.0 (+1) | 950 (+3%) | 2mo | $166,000 | $175 | 60 |
| 4994 N Michigan Ave | 0.65mi | 2/1.5 | 936 (+2%) | 7mo | $121,000 | $129 | 59 |
| 4520 Alura Pl | 0.27mi | 3/1.0 (+1) | 988 (+7%) | 17mo | $94,000 | $95 | 56 |
| 3030 Carla Dr | 0.60mi | 3/1.0 (+1) | 864 (-6%) | 5mo | $115,000 | $133 | 52 |
| 895 Schust Rd | 0.71mi | 3/1.0 (+1) | 868 (-6%) | 3mo | $77,000 | $89 | 50 |
| 3782 Church St | 0.54mi | 3/1.0 (+1) | 1,008 (+10%) | 7mo | $75,000 | $74 | 48 |
| 1325 Savoy Dr | 0.51mi | 3/1.0 (+1) | 1,050 (+14%) | 14mo | $135,000 | $129 | 36 |
| 3754 Ventura Dr | 0.66mi | 3/1.0 (+1) | 988 (+7%) | 22mo | $135,000 | $137 | 33 |
| 736 Caravelle Dr | 0.47mi | 3/1.5 (+1) | 1,040 (+13%) | 22mo | $139,900 | $135 | 31 |
Match score weights: distance 35% · size 25% · config 20% · recency 20%. Top-matched comps best support the ARV.
Projected returns pro-forma
-3.0% appreciation · 3.0% rent growth · sell at horizon
- IRR
- 16.2%
- Equity multiple
- 1.65×
- Total profit
- $14,577
- Equity at exit
- $11,913
- IRR
- 24.8%
- Equity multiple
- 3.15×
- Total profit
- $48,052
- Equity at exit
- $6,908
Cash invested: $22,372 (down + closing). Projections, not guarantees.
Landlord ↔ Tenant lean methodology
- Overall (STATE)
- 62 Landlord-Friendly
- State Michigan
- 62 Landlord-Friendly · EVEN
- County
- — inherits STATE
- City
- — inherits STATE
ZIP-level market 48604
- Home prices YoY
- -24.6%
- Active inventory
- 70
- Price-to-rent
- 5.8×
Monthly cashflow live
- Estimated rent
- $1,150 medium interval (Pro) →
- Mortgage (P&I)
- −$419
- Tax from tax record
- −$24 /mo · $283/yr
- Insurance
- −$33
- HOA
- −$0
- Vacancy / Maint / Mgmt
- −$242
- Net cashflow
- $433
Break-even live
UW: 25.0% down · 7.5% · 30yr · 1.5% tax · 5.0% vac · 8.0% maint · 8.0% mgmt
Financing live
Cash to close
- Down payment
- $19,975
- Closing costs
- $2,397
- Reserves months
- —
- Total cash needed
- —
Loan-product check · same deal, 3 products live
Conventional
25% down · 7.5% · 30yr
- Down + closing
- —
- Monthly P&I
- —
- Monthly cashflow
- —
- DSCR
- —
- Eligible?
- —
Personal DTI + credit; lowest rate.
DSCR
20% down · 8.5% · 30yr
- Down + closing
- —
- Monthly P&I
- —
- Monthly cashflow
- —
- DSCR
- —
- Eligible?
- —
No personal income docs; deal must DSCR.
Hard money
10% down · 12.0% · 12mo
- Down + closing
- —
- Monthly P&I
- —
- Monthly cashflow
- —
- DSCR
- —
- Eligible?
- —
Short-term bridge; refi at stabilization.
Rent comps 1 comps
| Address | Beds | Baths | Sqft | Rent | $/sqft | DOM | Units | Dist |
|---|---|---|---|---|---|---|---|---|
| 4070 Green Isle Way Saginaw, MI | 1.0–3.0 | 1.0–1.5 | 950 | $1,150 | $1.21 | 43d | 15 | 0.91mi |
Listing history 8 events
-
2026-06-09status $79,900 Pending 8 DOM
-
2026-06-08days on market $79,900 Active 8 DOM
-
2026-06-07days on market $79,900 Active 7 DOM
-
2026-06-05days on market $79,900 Active 4 DOM
-
2026-06-03days on market $79,900 Active 3 DOM
-
2026-06-02days on market $79,900 Active 2 DOM
-
2026-05-31remarks 490-char remark
Show marketing remark (490 chars)
Here's your chance at owning a home or income opportunity at an amazing price! This 2 bed 1 bath home has many newer upgrades including flooring in the work areas of the home (2025), front door (2025) and more. There's a 9 x 4 walk-in pantry off the kitchen for convenience. Separate laundry area. Room to entertain with your backyard deck (2019). There's plenty of space to play or garden with your almost 300 ft lot! Storage space in the detached 2 car garage. All appliances stay. BATVAI
-
2026-05-31$79,900 Active 1 DOM
Show marketing remark (490 chars)
Here's your chance at owning a home or income opportunity at an amazing price! This 2 bed 1 bath home has many newer upgrades including flooring in the work areas of the home (2025), front door (2025) and more. There's a 9 x 4 walk-in pantry off the kitchen for convenience. Separate laundry area. Room to entertain with your backyard deck (2019). There's plenty of space to play or garden with your almost 300 ft lot! Storage space in the detached 2 car garage. All appliances stay. BATVAI
ⓘ Source: listings_history table (triggers on properties + properties_extension) + one-shot
backfill from property_details.listing_events for pre-trigger history.
Tax reassessment forecast MI · Partial reset (capped growth)
- Current annual tax
- $283 · $24/mo
- Projected year-2 tax
- $757 · $63/mo
- Expected delta
- +$474/yr (+$39/mo · 167.3%)
ⓘ Screening estimate from a state-policy table — verify with the county assessor before closing.
Climate risk First Street
- Flood 1/10 Low FEMA zone X (unshaded) · 0% chance over 30 yrs
- Wildfire 1/10 Low
- Heat 2/10 Low 7 d/yr ≥99°F today · 14 d/yr by 30 yrs out
- Wind 1/10 Low
- Air quality 2/10 Low 1 unhealthy d/yr today · 2 by 30 yrs out
Nearby sold comps map
Loading sold comps map…
Walkable amenities ~0.75 mi
Loading nearby amenities…
Taxation est. · year 1
- Rental income
- $13,800
- − Mortgage interest
- −$4,476
- − Property taxes
- −$283
- − Insurance
- −$400
- − Repairs & maintenance
- −$1,104
- − Management
- −$1,104
- − Depreciation
- −$2,324
- Taxable income
- $4,109
- Est. tax owed @ 24.0%
- −$986
- After-tax cash flow
- $4,205/yr
For passive investors: Depreciation is non-cash, so a rental often shows a tax loss while cash-flowing — sheltering income. Rental losses are passive: they offset passive income freely, and up to $25,000/yr can offset ordinary (W-2) income if you actively participate and your MAGI is under $100k (phasing out to $0 by $150k); unused losses carry forward. On sale, claimed depreciation is recaptured at up to 25%, and gains may owe capital-gains tax (a 1031 exchange can defer both). Figures are a year-1 estimate at your 24.0% rate — not tax advice; consult a CPA.
Schools (NCES district)
- District
- Carrollton Public Schools
- NCES district ID
- 2608070
- Math proficiency
- 9% ▼ -6.00%
- Reading proficiency
- 26% ▼ -8.00%
- Median HH income
- $39,147
- Composite
- 14.74/100
- National rank
- #9395
- State rank
- #485 of 540 in MI
Livability — Zilwaukee
- Score
- 76/100
- State rank
- #138
- US rank
- #3375
Category grades
Schools grade is shown separately in the Schools card above.
Census & demographics
- Population (ZIP)
- 11,284
Population outlook (Saginaw County) Hauer SSP2
- Today (2025)
- 180,568 people
- By 2030
- 172,302 · -4.6%
- By 2040
- 153,919 · -14.8%
- By 2050
- 135,519 · -24.9%
- By 2075
- 97,199 · -46.2%
- By 2100
- 65,037 · -64.0%
Race, ethnicity, and origin ACS 2023
- Neighborhood character
- Predominantly White (78%)
- Race & ethnicity
- White 78% Black 9% Hispanic / Latino 8% Two or more races 5% Asian 1%
- Hispanic origin (detail)
- Mexican 7%
- Common ancestry
- Romanian 10% Lithuanian 6% Italian 2%
- Foreign-born
- 2% · Canada
- Languages at home
- 95% English-only · Spanish 3% Other Indo-European 1% Arabic 1%
Political lean MEDSL · Saginaw
- 2024 margin
- Toss-up / Even · D 47.7% · R 51.0% · Other 1.4%
- 2008→2024 swing
- -20.6pp toward R · 2008: 17.3pp · 2024: -3.3pp
- All cycles
- 2024: R+3.3 2020: D+0.3 2016: R+1.1 2012: D+11.9 2008: D+17.3
Not yet ingested
- Civics
- —
Market trends
- HPI YoY
- ▼ -68.55%
- Current HPI
- 210.5278
- Rent YoY
- —
- Metro
- —
- State GDP YoY
- ▲ 1.37%
- F500 in state
- 28
Industry mix (Fortune 500 HQ in MI)
| Industry | F500 HQs | Revenue |
|---|---|---|
| Automotive Parts | 3 | $48B |
|
||
| Automotive | 2 | $372B |
|
||
| Chemicals | 1 | $45B |
|
||
| Automotive Retail | 1 | $29B |
|
||
| Healthcare / Medical Devices | 1 | $23B |
|
||
| Automotive Technology | 1 | $20B |
|
||
Price history
+0.0% since first listed5 events — show timeline
- 2026-05-31 Relisted — MiRealSource-MiMLS
- 2026-05-31 Relisted — REALCOMP
- 2026-05-21 Listed $79,900 REALCOMP
- 2026-05-21 Listing Removed — MiRealSource-MiMLS
- 2026-05-21 Listed $79,900 MiRealSource-MiMLS
Property tax history
-13.3%/yrLatest (2025): $283 · -85.3% YoY. Source: county tax records.
Cash-flow waterfall
monthlySold comps — $/sqft
last 12 mo · ≤1 miLoading sold comps…