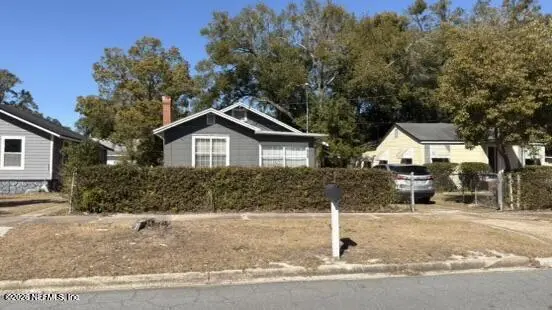
529 W 59th St · Jacksonville, FL
Flood risk 1/10 · Minimal
- FEMA flood zone
- X (unshaded)
- Chance of flooding over 30 yrs
- 0.0%
- Est. flood insurance / yr
- $507 – $1,088
Fire risk 1/10 · Minimal
- Est. fire insurance / yr
- $947 – $1,759
Heat risk 9/10 · Severe
- Hot days now (above 107°F)
- 7 days/yr
- Hot days in 30 yrs
- 20 days/yr
Wind risk 9/10 · Severe
- Chance of severe wind over 30 yrs
- 99.0%
Air-quality risk 4/10 · Minor
- Unhealthy air days now
- 6 days/yr
- Unhealthy air days in 30 yrs
- 6 days/yr
Risk factors via First Street. Map © Google.
Why this score? — see what drove the B grade
The composite is a weighted blend of 9 inputs, each scored 0–100. Each bar is that input's sub-score; the figure is the points it added to the 100-point composite (weight × sub-score).
- Cash flow +27.8/30.0
- ARV discount +15.0/15.0
- DSCR +9.8/10.0
- 1% rule +7.6/10.0
- Livability +4.2/5.0
- Schools +3.9/10.0
- Condition / age +2.5/5.0
- Rent growth +2.2/5.0
- Appreciation +0.0/10.0
$107,800
🖨 Deal sheet 📄 Offer letter ✓ Due diligence
Listing remarks MLS
Do not disturb the current tenant. The property is tenant-occupied. Do not enter or access the property without a confirmed appointment approved by the listing agent. All showing requests must be submitted with an offer and require at least 48 hours' notice for approval. The property is being sold as-is. The seller has never occupied the property. Buyer and Buyer's Agent are responsible for completing their own due diligence.
Key facts
- Screened patio
- Updated kitchen
- Refinished bathroom
Tags
Property features AI
Finance
- Other: Property offered by ZALLOUM REALTY LLC
- HOA & community: Not a senior community
Exterior
- Parking: Off-street parking
- Utilities: Electricity connected; Sewer available; Water available
- Home design: Single-family residence
- Exterior features: No private pool; Lot approximately 0.1 acres; Residential use
Interior
- Bedrooms: 3 bedrooms
- Bathrooms: 1 full bathroom
- Heating & cooling: Central heating (electric); Central air conditioning (electric)
- Interior features: Other appliances (unspecified)
Neighborhood map
What this means for you Summary
Snapshot
- This is a 3-bed/1.0-bath single-family listed at $108k.
Deal economics
- At list price, monthly cash flow is $329 ($4k/yr) — positive.
- The deal already cash-flows at list — no discount required.
- Meets the 1% rule at list price ($1k rent vs $108k).
- Recommended offer: $106k (1.5% below list) — sets the bar for market timing.
- Cap rate 10.0% vs local median 4.0% in Jacksonville — top-decile yield for the area; either an underpriced asset or a hidden risk that comps aren't pricing in. Stress-test before assuming the spread holds.
Location & tenants
- Location reads 83/100 on livability (#50 in FL, #911 nationally) — a professional / high-income tenant draw. Strengths: amenities A+, commute A+, housing A+.
- Duval (urban): math 46% / reading 45% proficiency, ranked #48 of 73 in FL (top 66%) — families likely to look elsewhere, expect single-tenant / working-renter base with shorter leases.
- Market conditions: Rents soft (-1.4%/yr); 291 active listings in the ZIP; 40 comparable units currently listed for rent nearby; rentals at typical pace (median 20d on market — plan ~3-4 weeks tenant-placement turnaround); lower-income renter base — watch delinquency; 6,503 units permitted in Duval County in 2024 (1,131 in 5+ unit buildings).
- This rent runs 40% of the median local income ($41k/yr) — at the standard rent-burdened threshold; future hikes will face affordability resistance.
Forward outlook
- Local home prices are declining (-3.0%/yr); year-one equity from $745 of loan paydown is wiped out by about $3k of value loss. Plan a longer hold.
- Duval County population projected at +19% by 2050 — long-run rental-demand tailwind backs the buy-and-hold thesis.
Negotiation context
- It's been on market 19 days — a 2% lower offer ($106k) is reasonable based on typical stale-listing flexibility.
- 3 sale attempts since 20y ago with the ask held roughly flat each time — persistent listings suggest the price (not the market) is what's stuck; bring a comps-based counter.
- Current owner paid $60k; list at $108k implies a 79% gain — meaningful room to come down on a strong offer.
Risks & watch-outs
- Watch-outs: built in 1938 — expect roof / HVAC / electrical / plumbing capex.
- Climate carrying-cost: severe wind risk, 99% chance of damaging wind over 30y; extreme-heat days projected 7→20/yr by 2055 (HVAC capex compounding) — expect insurance premiums to compound above CPI over the hold.
Questions for the listing agent
- Built in 1938 — when were the roof, HVAC, electrical panel, plumbing, and water heater last replaced?
- Is there a deadline driving the sale (1031 exchange, divorce, estate, relocation)? That informs how much negotiation room exists.
- Schools are B-rated — typically a magnet for longer-tenancy family renters. What's the average tenant stay here, and is there a school-zone premium baked into asking?
- What's the average days-on-market for RENTAL listings here right now (not sales)? A rising rental-DOM trend means longer vacancies and softer asking-rent achievability than the comps imply.
- What's the recent tenant-quality profile in this submarket — average credit score on applications, eviction rate, late-payment / NSF rate, and stable-employment percentage? A property-management company in the area should have these aggregated.
- How much new for-sale + rental construction is in the pipeline within 1–3 miles? Heavy new supply typically softens prices + rents 12–24 months out; constrained supply supports both.
Investment metrics
- 1% rule
- 1.26% ✓
- Cap rate
- 9.96%
- Cash-on-cash
- 13.09%
- DSCR
- 1.58
- GRM
- 6.6
CMA / ARV
- ARV (on-the-fly)
- $134,112
- Comps found
- 12
Show comp detail 12 sales within ~0.75 mi
| Address | Dist | Beds/Ba | Sqft | Sold | Price | $/sf | Match |
|---|---|---|---|---|---|---|---|
| 733 Escambia St | 0.36mi | 3/1.0 | 975 (-8%) | 0mo | $90,000 | $92 | 70 |
| 6711 Drayton St | 0.50mi | 3/1.0 | 1,088 (+3%) | 3mo | $138,000 | $127 | 69 |
| 110 Tallulah Ave | 0.50mi | 3/1.0 | 1,102 (+4%) | 2mo | $181,000 | $164 | 68 |
| 429 W 46th St | 0.44mi | 2/1.0 (-1) | 1,020 (-3%) | 2mo | $167,000 | $164 | 67 |
| 753 Fernway St | 0.36mi | 3/1.0 | 929 (-12%) | 1mo | $110,000 | $118 | 63 |
| 465 W 60th St | 0.11mi | 2/3.5 (-1) | 1,157 (+10%) | 3mo | $89,000 | $77 | 62 |
| 50 W 58th St | 0.62mi | 2/1.0 (-1) | 1,004 (-5%) | 1mo | $71,000 | $71 | 57 |
| 569 W 49th St | 0.37mi | 2/1.0 (-1) | 924 (-12%) | 2mo | $57,000 | $62 | 55 |
| 950 Ashton St | 0.72mi | 3/1.0 | 1,000 (-5%) | 4mo | $142,500 | $143 | 55 |
| 182 W 61st St | 0.41mi | 2/3.0 (-1) | 1,161 (+10%) | 3mo | $125,770 | $108 | 49 |
| 7625 N North Shore Dr | 0.46mi | 3/2.0 | 1,214 (+15%) | 1mo | $215,500 | $178 | 48 |
| 918 Deerwood Cir S | 0.61mi | 3/2.0 | 1,209 (+14%) | 3mo | $235,000 | $194 | 41 |
Match score weights: distance 35% · size 25% · config 20% · recency 20%. Top-matched comps best support the ARV.
Projected returns pro-forma
-3.0% appreciation · 0.0% rent growth · sell at horizon
- IRR
- -0.4%
- Equity multiple
- 0.98×
- Total profit
- $-466
- Equity at exit
- $16,073
- IRR
- 5.8%
- Equity multiple
- 1.37×
- Total profit
- $11,252
- Equity at exit
- $9,321
Cash invested: $30,184 (down + closing). Projections, not guarantees.
Landlord ↔ Tenant lean methodology
- Overall (STATE)
- 87 Strongly Landlord-Friendly
- State Florida
- 87 Strongly Landlord-Friendly · R+3
- County
- — inherits STATE
- City
- — inherits STATE
ZIP-level market 32208
- Home prices YoY
- -33.6%
- Rents YoY
- -1.4%
- Active inventory
- 291
- Price-to-rent
- 6.6×
Monthly cashflow live
- Estimated rent
- $1,364 high interval (Pro) →
- Mortgage (P&I)
- −$565
- Tax from tax record
- −$138 /mo · $1,652/yr
- Insurance
- −$45
- HOA
- −$0
- Vacancy / Maint / Mgmt
- −$286
- Net cashflow
- $329
Break-even live
UW: 25.0% down · 7.5% · 30yr · 1.5% tax · 5.0% vac · 8.0% maint · 8.0% mgmt
Financing live
Cash to close
- Down payment
- $26,950
- Closing costs
- $3,234
- Reserves months
- —
- Total cash needed
- —
Loan-product check · same deal, 3 products live
Conventional
25% down · 7.5% · 30yr
- Down + closing
- —
- Monthly P&I
- —
- Monthly cashflow
- —
- DSCR
- —
- Eligible?
- —
Personal DTI + credit; lowest rate.
DSCR
20% down · 8.5% · 30yr
- Down + closing
- —
- Monthly P&I
- —
- Monthly cashflow
- —
- DSCR
- —
- Eligible?
- —
No personal income docs; deal must DSCR.
Hard money
10% down · 12.0% · 12mo
- Down + closing
- —
- Monthly P&I
- —
- Monthly cashflow
- —
- DSCR
- —
- Eligible?
- —
Short-term bridge; refi at stabilization.
Rent comps 40 comps
| Address | Beds | Baths | Sqft | Rent | $/sqft | DOM | Units | Dist |
|---|---|---|---|---|---|---|---|---|
| 535 W 59th St Jacksonville, FL | 3.0 | 2.0 | 816 | $1,395 | $1.71 | 7d | 1 | 0.03mi |
| 385 Duray Ct Jacksonville, FL | 3.0 | 1.0 | 932 | $1,250 | $1.34 | 19d | 1 | 0.12mi |
| 356 Duray Ct Jacksonville, FL | 3.0 | 2.0 | 1070 | $1,425 | $1.33 | 14d | 1 | 0.16mi |
| 6460 Lanark Ave Jacksonville, FL | 2.0 | 1.0 | 708 | $1,095 | $1.55 | 23d | 1 | 0.20mi |
| 7124 Lorain St Jacksonville, FL | 3.0 | 1.0 | 864 | $1,043 | $1.21 | 3d | 1 | 0.22mi |
| 343 W 60th St Jacksonville, FL | 3.0 | 1.0 | 1238 | $1,299 | $1.05 | 21d | 1 | 0.24mi |
| 646 Escambia St Jacksonville, FL | 3.0 | 2.0 | 1200 | $1,395 | $1.16 | 21d | 1 | 0.32mi |
| 7210 Elwood Ave Jacksonville, FL | 2.0 | 1.0 | 831 | $995 | $1.20 | 21d | 1 | 0.32mi |
| 472 W 65th St Jacksonville, FL | 3.0 | 1.0 | 1312 | $1,295 | $0.99 | 21d | 1 | 0.33mi |
| 664 Escambia St Jacksonville, FL | 3.0 | 2.0 | 1352 | $1,500 | $1.11 | 17d | 1 | 0.34mi |
| 7511 N Shore Dr Jacksonville, FL | 2.0 | 1.0 | 1014 | $1,350 | $1.33 | 4d | 1 | 0.37mi |
| 319 W 49th St Jacksonville, FL | 2.0 | 1.0 | 977 | $1,200 | $1.23 | 23d | 1 | 0.39mi |
| 6418 Sapphire Dr Jacksonville, FL | 3.0 | 1.5 | 1296 | $1,350 | $1.04 | 23d | 1 | 0.40mi |
| 562 W 49th St Jacksonville, FL | 3.0 | 1.0 | 1091 | $1,195 | $1.10 | 23d | 1 | 0.40mi |
| 425 W 47th St Jacksonville, FL | 3.0 | 1.5 | 1083 | $1,193 | $1.10 | 7d | 1 | 0.41mi |
| 5616 Calvin Ave Jacksonville, FL | 3.0 | 1.0 | 1008 | $1,195 | $1.19 | 7d | 1 | 0.43mi |
| 5514 Long St Jacksonville, FL | 2.0 | 1.0 | 941 | $1,250 | $1.33 | 1d | 1 | 0.50mi |
| 7115 Lucky Dr W Jacksonville, FL | 3.0 | 1.0 | 1158 | $1,500 | $1.30 | 23d | 1 | 0.51mi |
| 346 W 68th St Jacksonville, FL | 3.0 | 1.0 | 1114 | $1,385 | $1.24 | 4d | 1 | 0.55mi |
| 920 Alderside St Jacksonville, FL | 3.0 | 1.0 | 1255 | $1,195 | $0.95 | 4d | 1 | 0.55mi |
| 33 W 55th St Jacksonville, FL | 4.0 | 2.0 | 1387 | $1,321 | $0.95 | 3d | 1 | 0.58mi |
| 209 Woodrow St Jacksonville, FL | 3.0 | 1.0 | 1282 | $1,325 | $1.03 | 23d | 1 | 0.59mi |
| 41 Tallulah Ave Jacksonville, FL | 3.0 | 1.0 | 1092 | $1,390 | $1.27 | 3d | 1 | 0.60mi |
| 6510 Avalon St Jacksonville, FL | 4.0 | 2.0 | 1488 | $1,425 | $0.96 | 23d | 1 | 0.63mi |
| 961 Dorchester St Jacksonville, FL | 2.0 | 1.0 | 884 | $1,025 | $1.16 | 3d | 1 | 0.63mi |
| 141 W 43rd St Jacksonville, FL | 3.0 | 2.0 | 1022 | $1,231 | $1.20 | 3d | 1 | 0.73mi |
| 1136 Maynard St Jacksonville, FL | 2.0 | 1.0 | 919 | $1,045 | $1.14 | 23d | 1 | 0.76mi |
| 18 W 43rd St Jacksonville, FL | 2.0 | 1.0 | 750 | $795 | $1.06 | 4d | 1 | 0.84mi |
| 4918 N Pearl St Jacksonville, FL | 2.0 | 1.0 | 850 | $895 | $1.05 | 23d | 1 | 0.85mi |
| 217 E 48th St Jacksonville, FL | 3.0 | 1.0 | 979 | $1,096 | $1.12 | 10d | 1 | 0.86mi |
| 643 Linwood Ave Jacksonville, FL | 3.0 | 2.0 | 1232 | $1,325 | $1.08 | 3d | 1 | 0.86mi |
| 4721 E Castlewood Dr Jacksonville, FL | 3.0 | 1.0 | 1008 | $1,250 | $1.24 | 23d | 1 | 0.87mi |
| 511 Ivy St Jacksonville, FL | 2.0 | 1.0 | 900 | $995 | $1.11 | 23d | 1 | 0.89mi |
| 205 E 44th St Jacksonville, FL | 3.0 | 1.0 | 955 | $1,075 | $1.13 | 21d | 1 | 0.95mi |
| 7525 Oakwood St Jacksonville, FL | 3.0 | 1.0 | 945 | $1,375 | $1.46 | 14d | 1 | 0.95mi |
| 516 E 58th St Jacksonville, FL | 4.0 | 2.0 | 1232 | $1,725 | $1.40 | 7d | 1 | 0.97mi |
| 1348 Crestwood St Jacksonville, FL | 3.0 | 1.0 | 1300 | $1,100 | $0.85 | 23d | 1 | 0.98mi |
| 5035 N Main St Jacksonville, FL | 3.0 | 1.0–2.0 | 816 | $1,459 | $1.79 | 23d | 69 | 0.99mi |
| 524 E 60th St Jacksonville, FL | 3.0 | 1.0 | 1212 | $1,195 | $0.99 | 7d | 1 | 1.01mi |
| 525 E 60th St Jacksonville, FL | 3.0 | 2.0 | 1120 | $1,471 | $1.31 | 23d | 1 | 1.01mi |
Listing history 15 events
-
2026-06-18days on market $107,800 Active 19 DOM
-
2026-06-17days on market $107,800 Active 18 DOM
-
2026-06-16days on market $107,800 Active 17 DOM
-
2026-06-15days on market $107,800 Active 16 DOM
-
2026-06-13days on market $107,800 Active 14 DOM
-
2026-06-13days on market $107,800 Active 13 DOM
-
2026-06-10days on market $107,800 Active 10 DOM
-
2026-06-08days on market $107,800 Active 9 DOM
-
2026-06-07days on market $107,800 Active 8 DOM
-
2026-06-05days on market $107,800 Active 5 DOM
-
2026-06-03days on market $107,800 Active 4 DOM
-
2026-06-02days on market $107,800 Active 3 DOM
-
2026-06-01days on market $107,800 Active 2 DOM
-
2026-05-31remarks 583-char remark
-
2026-05-31$107,800 Active 1 DOM
ⓘ Source: listings_history table (triggers on properties + properties_extension) + one-shot
backfill from property_details.listing_events for pre-trigger history.
Tax reassessment forecast FL · Resets to sale price
- Current annual tax
- $1,652 · $138/mo
- Projected year-2 tax
- $1,652 · $138/mo
- Expected delta
- $0/yr ($0/mo · 0.0%)
ⓘ Screening estimate from a state-policy table — verify with the county assessor before closing.
Climate risk First Street
- Flood 1/10 Low FEMA zone X (unshaded) · 0% chance over 30 yrs
- Wildfire 1/10 Low
- Heat 9/10 Extreme 7 d/yr ≥107°F today · 20 d/yr by 30 yrs out
- Wind 9/10 Extreme 99% chance of damaging wind over 30 yrs
- Air quality 4/10 Moderate 6 unhealthy d/yr today · 6 by 30 yrs out
Nearby sold comps map
Loading sold comps map…
Walkable amenities ~0.75 mi
Loading nearby amenities…
Taxation est. · year 1
- Rental income
- $16,363
- − Mortgage interest
- −$6,038
- − Property taxes
- −$1,652
- − Insurance
- −$539
- − Repairs & maintenance
- −$1,309
- − Management
- −$1,309
- − Depreciation
- −$3,136
- Taxable income
- $2,380
- Est. tax owed @ 24.0%
- −$571
- After-tax cash flow
- $3,381/yr
For passive investors: Depreciation is non-cash, so a rental often shows a tax loss while cash-flowing — sheltering income. Rental losses are passive: they offset passive income freely, and up to $25,000/yr can offset ordinary (W-2) income if you actively participate and your MAGI is under $100k (phasing out to $0 by $150k); unused losses carry forward. On sale, claimed depreciation is recaptured at up to 25%, and gains may owe capital-gains tax (a 1031 exchange can defer both). Figures are a year-1 estimate at your 24.0% rate — not tax advice; consult a CPA.
Schools (NCES district)
- District
- Duval
- NCES district ID
- 1200480
- Math proficiency
- 46% ▼ -11.00%
- Reading proficiency
- 45% ▼ -4.00%
- Median HH income
- $48,987
- Composite
- 38.97/100
- National rank
- #4076
- State rank
- #48 of 73 in FL
Livability — Jacksonville
- Score
- 83/100
- State rank
- #50
- US rank
- #911
Category grades
Schools grade is shown separately in the Schools card above.
Census & demographics
- Census place
- Jacksonville, FL
- County
- Duval County · 1,015,274 people
- City population
- 979,034
- Metro
- Jacksonville, FL
- Population (ZIP)
- 32,699
- Household income
- $41,324
- Rent vs Own
- Severe rent burden
- 1765.0
Population outlook (Duval County) Hauer SSP2
- Today (2025)
- 1,013,010 people
- By 2030
- 1,059,228 · +4.6%
- By 2040
- 1,141,439 · +12.7%
- By 2050
- 1,205,258 · +19.0%
- By 2075
- 1,324,282 · +30.7%
- By 2100
- 1,319,620 · +30.3%
Race, ethnicity, and origin ACS 2023
- Neighborhood character
- Predominantly Black (77%)
- Race & ethnicity
- Black 77% White 16% Two or more races 4% Hispanic / Latino 3%
- Common ancestry
- Italian 1%
- Foreign-born
- 2% · Canada
- Languages at home
- 97% English-only · Spanish 2%
Political lean MEDSL · Duval
- 2024 margin
- Toss-up / Even · D 48.7% · R 50.1% · Other 1.2%
- 2008→2024 swing
- +0.4pp no change · 2008: -1.9pp · 2024: -1.5pp
- All cycles
- 2024: R+1.5 2020: D+3.8 2016: R+1.5 2012: R+3.6 2008: R+1.9
Not yet ingested
- Civics
- —
Market trends
- HPI YoY
- ▼ -110.56%
- Current HPI
- 217.9706
- Rent YoY
- ▼ -1.36%
- Metro
- Jacksonville, FL
- State GDP YoY
- ▲ 3.28%
- F500 in state
- 36
Industry mix (Fortune 500 HQ in FL)
| Industry | F500 HQs | Revenue |
|---|---|---|
| Industrial Technology | 2 | $29B |
|
||
| Insurance | 2 | $17B |
|
||
| Retail | 1 | $60B |
|
||
| Technology Distribution | 1 | $58B |
|
||
| Homebuilding | 1 | $35B |
|
||
| Technology Manufacturing | 1 | $35B |
|
||
Price history
+331.2% since first listed7 events — show timeline
- 2026-05-30 Listed $107,800 realMLS
- 2026-05-08 Listing Removed — realMLS
- 2026-03-03 Listed $109,000 realMLS
- 2006-03-08 Sold (MLS) $60,250 realMLS
- 2006-01-13 Listed $53,000 realMLS
- 1999-04-23 Sold (Public Records) $57,900 Public Records
- 1998-09-18 Sold (Public Records) $25,000 Public Records
Property tax history
+7.6%/yrLatest (2025): $1,652 · +42.0% YoY. Source: county tax records.
Cash-flow waterfall
monthlySold comps — $/sqft
last 12 mo · ≤1 miLoading sold comps…