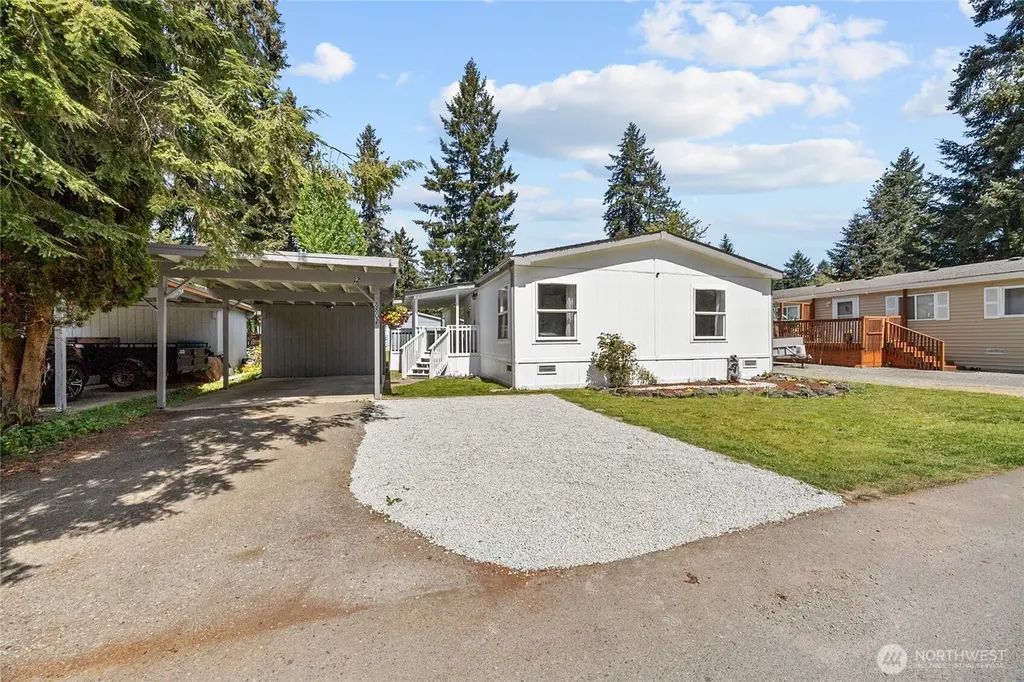
8807 226th St E #12 · Graham, WA
Flood risk No data
- FEMA flood zone
- —
- Chance of flooding over 30 yrs
- —
- Est. flood insurance / yr
- —
Fire risk No data
- Est. fire insurance / yr
- —
Heat risk No data
- Hot days now (above threshold)
- —
- Hot days in 30 yrs
- —
Wind risk No data
- Chance of severe wind over 30 yrs
- —
Air-quality risk No data
- Unhealthy air days now
- —
- Unhealthy air days in 30 yrs
- —
Risk factors via First Street. Map © Google.
Why this score? — see what drove the B- grade
The composite is a weighted blend of 9 inputs, each scored 0–100. Each bar is that input's sub-score; the figure is the points it added to the 100-point composite (weight × sub-score).
- Cash flow +30.0/30.0
- 1% rule +10.0/10.0
- DSCR +10.0/10.0
- Schools +4.9/10.0
- ARV discount +4.4/15.0
- Rent growth +3.3/5.0
- Livability +3.2/5.0
- Condition / age +2.5/5.0
- Appreciation +0.0/10.0
$149,950
🖨 Deal sheet 📄 Offer letter ✓ Due diligence
Listing remarks
Welcome to this charming 3-bedroom, 2-bath home offering 1,440 sqft of comfortable living in the all-ages Shadow Pines community! Situated in a cute, well-kept park. Step inside to a bright, open layout with abundant natural light throughout. The spacious living areas flow seamlessly into the dining space and kitchen—perfect for everyday living and entertaining. Cozy up by the freestanding stove or unwind on the inviting covered front porch, ideal for relaxing year-round. Outside, enjoy a covered carport with additional storage and easy, low-maintenance yard space. For added security and convenience, the home includes installed security cameras that will stay. Conveniently located nea
Key facts
- 2 parking spots
- Built 1994
- Listed 43 days
Property features AI
Finance
- Other: Located on a dead-end, paved street with open space nearby
- Financial info: Listing terms: Cash or Conventional
- HOA & community: Located in Shadow Pines park (approximately 50 homes); Land lease: $848/month; Park approved for manufactured home sale
Exterior
- Parking: Carport
- Utilities: Electric power; Community/shared well water (park); Park sewer; Electric water heater located in closet; Power service provided by TPU
- Home design: Manufactured double-wide home (Redman); One level; Faces south; Good condition; Mobile home remains in place
- Construction: Wood construction; Composition roof; Pillar/post/pier foundation with tie downs; Manufactured after June 15, 1976
- Exterior features: Wood exterior/wood products; Awnings; Patio/porch/deck; Drapes; Vaulted ceilings; Walk-in closet
Interior
- Kitchen: Dishwasher; Refrigerator; Stove/Range
- Bedrooms: 3 bedrooms
- Flooring: Laminate flooring; Carpet
- Bathrooms: 2 full bathrooms (2 bathtubs, 2 showers)
- Heating & cooling: Forced air heating
- Interior features: Fireplace (wood burning); Water heater
- Laundry & utility: Utility room
Neighborhood map
What this means for you Summary
Snapshot
- This is a 3-bed/2.0-bath manufactured listed at $150k.
Deal economics
- At list price, monthly cash flow is $1k ($15k/yr) — positive.
- The deal already cash-flows at list — no discount required.
- Meets the 1% rule at list price ($3k rent vs $150k).
- Recommended offer: $145k (3.0% below list) — sets the bar for market timing.
- Cap rate 16.4% vs local median 3.6% in Graham — top-decile yield for the area; either an underpriced asset or a hidden risk that comps aren't pricing in. Stress-test before assuming the spread holds.
Location & tenants
- Location reads 64/100 on livability (#373 in WA) — a middle-class / working-renter tenant base. Strengths: employment A+, housing A+; Watch: crime C-, health & safety C-, amenities F.
- Bethel School District (suburban): math 47% / reading 59% proficiency, ranked #103 of 291 in WA (top 35%) — acceptable for families but not a draw, mixed tenant base, ~2y average lease.
- Market conditions: Rents rising (+3.3%/yr); 232 active listings in the ZIP; high-income renter base; 3,209 units permitted in Pierce County in 2024 (1,269 in 5+ unit buildings).
Forward outlook
- Local home prices are declining (-3.0%/yr); year-one equity from $1k of loan paydown is wiped out by about $4k of value loss. Plan a longer hold.
- Pierce County population projected at +26% by 2050 — long-run rental-demand tailwind backs the buy-and-hold thesis.
- At projected returns (-3.0% appreciation + 3.3% rent growth), your $42k cash investment doubles in ~4 years — after that, you're playing with house money.
Negotiation context
- It's been on market 43 days — a 3% lower offer ($145k) is reasonable based on typical stale-listing flexibility.
- 3 sale attempts since 16y ago with the ask held roughly flat each time — persistent listings suggest the price (not the market) is what's stuck; bring a comps-based counter.
- Current owner paid $26k; list at $150k implies a 488% gain — meaningful room to come down on a strong offer.
Questions for the listing agent
- It's been on market 43 days. Have you received any prior offers? Is the seller open to a 3% concession, seller financing, or rate buy-down credit?
- Is there a deadline driving the sale (1031 exchange, divorce, estate, relocation)? That informs how much negotiation room exists.
- What's the average days-on-market for RENTAL listings here right now (not sales)? A rising rental-DOM trend means longer vacancies and softer asking-rent achievability than the comps imply.
- What's the recent tenant-quality profile in this submarket — average credit score on applications, eviction rate, late-payment / NSF rate, and stable-employment percentage? A property-management company in the area should have these aggregated.
- How much new for-sale + rental construction is in the pipeline within 1–3 miles? Heavy new supply typically softens prices + rents 12–24 months out; constrained supply supports both.
Investment metrics
- 1% rule
- 1.87% ✓
- Cap rate
- 16.40%
- Cash-on-cash
- 36.08%
- DSCR
- 2.61
- GRM
- 4.5
CMA / ARV
- ARV (on-the-fly)
- $140,400
- Comps found
- 11
Show comp detail 11 sales within ~0.75 mi
| Address | Dist | Beds/Ba | Sqft | Sold | Price | $/sf | Match |
|---|---|---|---|---|---|---|---|
| 22505 91st Ave E | 0.17mi | 3/2.0 | 1,344 (-4%) | 6mo | $113,300 | $84 | 80 |
| 9005 219th Street Ct E | 0.43mi | 3/2.0 | 1,340 (-5%) | 1mo | $380,000 | $284 | 71 |
| 22607 91st Avenue Ct E #10 | 0.22mi | 3/2.0 | 1,344 (-4%) | 15mo | $150,000 | $112 | 70 |
| 9016 220th Street Ct E | 0.35mi | 3/2.0 | 1,288 (-8%) | 3mo | $405,000 | $314 | 67 |
| 9309 221st St E #38 | 0.43mi | 3/2.0 | 1,512 (+8%) | 2mo | $157,000 | $104 | 65 |
| 22210 92nd Avenue Ct E #6 | 0.32mi | 3/2.0 | 1,294 (-8%) | 17mo | $130,000 | $100 | 58 |
| 9322 218th Street Ct E #12 | 0.54mi | 3/2.0 | 1,512 (+8%) | 7mo | $142,000 | $94 | 56 |
| 22317 92nd Avenue Ct E #16 | 0.31mi | 3/2.0 | 1,558 (+11%) | 16mo | $156,000 | $100 | 54 |
| 22716 91st Avenue Ct E #40 | 0.22mi | 3/2.0 | 1,232 (-12%) | 20mo | $120,000 | $97 | 53 |
| 9327 218th Street Ct E #9 | 0.59mi | 3/2.0 | 1,512 (+8%) | 9mo | $147,000 | $97 | 52 |
| 9009 219th Street Ct E | 0.45mi | 3/2.0 | 1,608 (+14%) | 9mo | $390,000 | $243 | 48 |
Match score weights: distance 35% · size 25% · config 20% · recency 20%. Top-matched comps best support the ARV.
Projected returns pro-forma
-3.0% appreciation · 3.32% rent growth · sell at horizon
- IRR
- 32.2%
- Equity multiple
- 2.36×
- Total profit
- $57,005
- Equity at exit
- $22,358
- IRR
- 39.4%
- Equity multiple
- 4.74×
- Total profit
- $156,882
- Equity at exit
- $12,965
Cash invested: $41,986 (down + closing). Projections, not guarantees.
Landlord ↔ Tenant lean methodology
- Overall (STATE)
- 28 Tenant-Leaning
- State Washington
- 28 Tenant-Leaning · D+8
- County
- — inherits STATE
- City
- — inherits STATE
ZIP-level market 98338
- Rents YoY
- 3.3%
- Active inventory
- 232
- Price-to-rent
- 4.5×
Monthly cashflow live
- Estimated rent
- $2,805 medium interval (Pro) →
- Mortgage (P&I)
- −$786
- Tax from tax record
- −$105 /mo · $1,258/yr
- Insurance
- −$62
- HOA
- −$0
- Vacancy / Maint / Mgmt
- −$589
- Net cashflow
- $1,262
Break-even live
UW: 25.0% down · 7.5% · 30yr · 1.5% tax · 5.0% vac · 8.0% maint · 8.0% mgmt
Financing live
Cash to close
- Down payment
- $37,488
- Closing costs
- $4,498
- Reserves months
- —
- Total cash needed
- —
Loan-product check · same deal, 3 products live
Conventional
25% down · 7.5% · 30yr
- Down + closing
- —
- Monthly P&I
- —
- Monthly cashflow
- —
- DSCR
- —
- Eligible?
- —
Personal DTI + credit; lowest rate.
DSCR
20% down · 8.5% · 30yr
- Down + closing
- —
- Monthly P&I
- —
- Monthly cashflow
- —
- DSCR
- —
- Eligible?
- —
No personal income docs; deal must DSCR.
Hard money
10% down · 12.0% · 12mo
- Down + closing
- —
- Monthly P&I
- —
- Monthly cashflow
- —
- DSCR
- —
- Eligible?
- —
Short-term bridge; refi at stabilization.
Listing history 21 events
-
2026-06-18days on market $149,950 Active 43 DOM
-
2026-06-17days on market $149,950 Active 42 DOM
-
2026-06-16days on market $149,950 Active 41 DOM
-
2026-06-15days on market $149,950 Active 40 DOM
-
2026-06-13days on market $149,950 Active 38 DOM
-
2026-06-13days on market $149,950 Active 37 DOM
-
2026-06-09days on market $149,950 Active 34 DOM
-
2026-06-08days on market $149,950 Active 33 DOM
-
2026-06-07days on market $149,950 Active 32 DOM
-
2026-06-04days on market $149,950 Active 29 DOM
-
2026-06-03days on market $149,950 Active 28 DOM
-
2026-06-02days on market $149,950 Active 27 DOM
-
2026-06-01days on market $149,950 Active 26 DOM
-
2026-05-31days on market $149,950 Active 25 DOM
-
2026-05-06$154,900 Active
-
2010-05-18soldstatus $25,500 Sold
-
2010-05-14status Pending
-
2010-05-09status Pending Inspection
-
2010-02-27status Active
-
2010-02-10status Pending
-
2010-01-03$30,000 Active
ⓘ Source: listings_history table (triggers on properties + properties_extension) + one-shot
backfill from property_details.listing_events for pre-trigger history.
Tax reassessment forecast WA · Resets to sale price
- Current annual tax
- $1,258 · $105/mo
- Projected year-2 tax
- $1,470 · $122/mo
- Expected delta
- +$211/yr (+$18/mo · 16.8%)
ⓘ Screening estimate from a state-policy table — verify with the county assessor before closing.
Nearby sold comps map
Loading sold comps map…
Walkable amenities ~0.75 mi
Loading nearby amenities…
Taxation est. · year 1
- Rental income
- $33,663
- − Mortgage interest
- −$8,400
- − Property taxes
- −$1,258
- − Insurance
- −$750
- − Repairs & maintenance
- −$2,693
- − Management
- −$2,693
- − Depreciation
- −$4,362
- Taxable income
- $13,507
- Est. tax owed @ 24.0%
- −$3,242
- After-tax cash flow
- $11,908/yr
For passive investors: Depreciation is non-cash, so a rental often shows a tax loss while cash-flowing — sheltering income. Rental losses are passive: they offset passive income freely, and up to $25,000/yr can offset ordinary (W-2) income if you actively participate and your MAGI is under $100k (phasing out to $0 by $150k); unused losses carry forward. On sale, claimed depreciation is recaptured at up to 25%, and gains may owe capital-gains tax (a 1031 exchange can defer both). Figures are a year-1 estimate at your 24.0% rate — not tax advice; consult a CPA.
Schools (NCES district)
- District
- Bethel School District
- NCES district ID
- 5300480
- Math proficiency
- 47% ▬ 0.00%
- Reading proficiency
- 59% ▲ 2.00%
- Median HH income
- $65,872
- Composite
- 48.66/100
- National rank
- #4568
- State rank
- #103 of 291 in WA
Livability — Graham
- Score
- 64/100
- State rank
- #373
- US rank
- #14219
Category grades
Schools grade is shown separately in the Schools card above.
Census & demographics
- Census place
- Graham, WA
- County
- Pierce County · 788,257 people
- City population
- 32,687
- Metro
- Seattle-Tacoma-Bellevue, WA
- Population (ZIP)
- 32,687
- Household income
- $114,819
- Rent vs Own
- Severe rent burden
- 236.0
Population outlook (Pierce County) Hauer SSP2
- Today (2025)
- 956,648 people
- By 2030
- 1,010,862 · +5.7%
- By 2040
- 1,113,170 · +16.4%
- By 2050
- 1,206,524 · +26.1%
- By 2075
- 1,436,425 · +50.2%
- By 2100
- 1,563,654 · +63.5%
Race, ethnicity, and origin ACS 2023
- Neighborhood character
- Predominantly White (71%)
- Race & ethnicity
- White 71% Two or more races 15% Hispanic / Latino 12% Asian 3% Black 3% Pacific Islander 2% Native American 1%
- Hispanic origin (detail)
- Mexican 7%
- Common ancestry
- Italian 4% Portuguese 4% Iranian 3%
- Foreign-born
- 7% · Canada, South Korea, China
- Languages at home
- 88% English-only · Spanish 5% Russian/Polish/Slavic 2% Other Asian/Pacific 1%
Political lean MEDSL · Pierce
- 2024 margin
- D (+10.8) · D 53.9% · R 43.1% · Other 3.0%
- 2008→2024 swing
- -1.4pp toward R · 2008: 12.2pp · 2024: 10.8pp
- All cycles
- 2024: D+10.8 2020: D+11.2 2016: D+7.5 2012: D+11.0 2008: D+12.2
Not yet ingested
- Civics
- —
Market trends
- HPI YoY
- ▼ -501.28%
- Current HPI
- 304.4241
- Rent YoY
- ▲ 3.32%
- Metro
- Seattle-Tacoma-Bellevue, WA
- State GDP YoY
- ▲ 4.65%
- F500 in state
- 22
Industry mix (Fortune 500 HQ in WA)
| Industry | F500 HQs | Revenue |
|---|---|---|
| Retail | 2 | $269B |
|
||
| Technology / Retail | 1 | $638B |
|
||
| Technology | 1 | $245B |
|
||
| Telecommunications | 1 | $38B |
|
||
| Food / Beverage | 1 | $36B |
|
||
| Automotive / Trucks | 1 | $34B |
|
||
Price history
+416.3% since first listed7 events — show timeline
- 2026-05-06 Listed $154,900 NWMLS as Distributed by MLS Grid
- 2010-05-18 Sold (MLS) $25,500 NWMLS as Distributed by MLS Grid
- 2010-05-14 Pending — NWMLS as Distributed by MLS Grid
- 2010-05-09 Pending — NWMLS as Distributed by MLS Grid
- 2010-02-27 Relisted — NWMLS as Distributed by MLS Grid
- 2010-02-10 Pending — NWMLS as Distributed by MLS Grid
- 2010-01-03 Listed $30,000 NWMLS as Distributed by MLS Grid
Property tax history
+6.8%/yrLatest (2026): $1,258 · +19.1% YoY. Source: county tax records.
Cash-flow waterfall
monthlySold comps — $/sqft
last 12 mo · ≤1 miLoading sold comps…