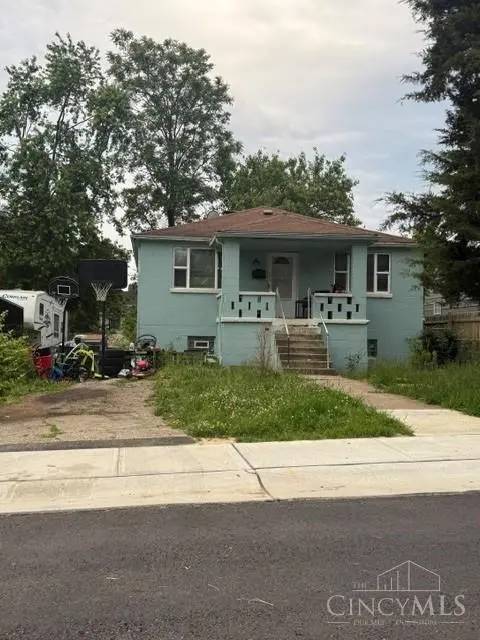
955 Simmons Ave · Lincoln Heights, OH
Flood risk 1/10 · Minimal
- FEMA flood zone
- X (unshaded)
- Chance of flooding over 30 yrs
- 0.0%
- Est. flood insurance / yr
- $473 – $860
Fire risk 1/10 · Minimal
- Est. fire insurance / yr
- $713 – $1,323
Heat risk 4/10 · Minor
- Hot days now (above 103°F)
- 7 days/yr
- Hot days in 30 yrs
- 19 days/yr
Wind risk 2/10 · Minimal
- Chance of severe wind over 30 yrs
- 1.0%
Air-quality risk 3/10 · Minor
- Unhealthy air days now
- 2 days/yr
- Unhealthy air days in 30 yrs
- 3 days/yr
Risk factors via First Street. Map © Google.
Why this score? — see what drove the D grade
The composite is a weighted blend of 9 inputs, each scored 0–100. Each bar is that input's sub-score; the figure is the points it added to the 100-point composite (weight × sub-score).
- Cash flow +13.2/30.0
- ARV discount +6.4/15.0
- Rent growth +4.5/5.0
- DSCR +4.0/10.0
- Livability +3.5/5.0
- Schools +3.4/10.0
- 1% rule +3.2/10.0
- Condition / age +2.5/5.0
- Appreciation +0.0/10.0
$160,000
🖨 Deal sheet (PDF) 📄 Offer letter ✓ Due diligence
Listing remarks
Great opportunity for investors or interested buyers looking to flip. This property offers a rare chance to build instant equity in a growing neighborhood. This is an excellent opportunity for flippers, buy and hold investors or anyone ready to take on a project. Property is sold as is. Seller will make no repairs. Serious buyers only.
Key facts
- 4,530 sq ft lot
- Built 1957
- Listed 32 days
Property features AI
Finance
- Other: Residential zoning; Lot approximately 40 x 113 (about 0.10 acre); Located on a city street in Lincoln Hts.; directions: N Wayne to Simmons
- HOA & community: No homeowners association
Exterior
- Parking: Driveway
- Utilities: Public water; Public sewer; Natural gas available; Water heating: electric and gas options
- Home design: Ranch-style single family home; One level
- Construction: Brick construction; Block foundation
- Exterior features: Front porch; Metal fencing; Shingle roof
Interior
- Kitchen: Kitchen approximately 11 x 11
- Bedrooms: Two bedrooms total; Primary bedroom on level 1, approximately 14 x 12; Second bedroom on level 1, approximately 14 x 11
- Bathrooms: One full bathroom on level 1; One half/partial bathroom on the lower level
- Heating & cooling: Electric heating
- Interior features: Five total rooms; Full basement with concrete floor and unfinished space
Neighborhood map
What this means for you Summary
Snapshot
- This is a 2-bed/1.5-bath single-family listed at $160k.
Deal economics
- At list price, monthly cash flow is $-2 ($-23/yr) — negative.
- To cash-flow at today's rent, offer at most $160k (0.2% below list).
- To meet the 1% rule (rent ≥ 1% of price), the offer needs to be $132k (17.5% below list).
- Recommended offer: $132k (17.5% below list) — sets the bar for 1% rule.
Location & tenants
- Location reads 69/100 on livability (#534 in OH) — a middle-class / working-renter tenant base. Strengths: commute A+, cost of living A+, crime B+; Watch: housing D, amenities F, employment F.
- Princeton City (suburban): math 34% / reading 43% proficiency, ranked #542 of 656 in OH (top 83%) — families likely to look elsewhere, expect single-tenant / working-renter base with shorter leases.
- Zoned schools: Princeton Community Middle School (math 28% / reading 38%, grade F, #553 of 654 statewide, top 85%, 1,290 students, 62% FRL) — zoned schools at 62% FRL track the district average.
- Market conditions: Rents rising fast (+8.0%/yr); 50 active listings in the ZIP; 6 comparable units currently listed for rent nearby; rentals at typical pace (median 26d on market — plan ~3-4 weeks tenant-placement turnaround); 801 units permitted in Hamilton County in 2024 (190 in 5+ unit buildings).
Forward outlook
- Local home prices are declining (-3.0%/yr); year-one equity from $1k of loan paydown is wiped out by about $5k of value loss. Plan a longer hold.
Negotiation context
- It's been on market 32 days — a 3% lower offer ($155k) is reasonable based on typical stale-listing flexibility.
Risks & watch-outs
- Watch-outs: built in 1957 — expect roof / HVAC / electrical / plumbing capex.
Questions for the listing agent
- What do current leases actually rent for vs. the listed asking? Can we see a recent rent roll and the last 12 months of T-12 income?
- It's been on market 32 days. Have you received any prior offers? Is the seller open to a 18% concession, seller financing, or rate buy-down credit?
- Built in 1957 — when were the roof, HVAC, electrical panel, plumbing, and water heater last replaced?
- Is there a deadline driving the sale (1031 exchange, divorce, estate, relocation)? That informs how much negotiation room exists.
- Schools are D-rated, which usually means shorter tenancies and higher turnover. Who's the typical renter profile here, and what's been the actual vacancy rate?
- The area grade is low — what's the realistic commute time and amenity access for the typical tenant pool here? Any planned neighborhood developments (good or bad) we should know about?
- What's the average days-on-market for RENTAL listings here right now (not sales)? A rising rental-DOM trend means longer vacancies and softer asking-rent achievability than the comps imply.
- What's the recent tenant-quality profile in this submarket — average credit score on applications, eviction rate, late-payment / NSF rate, and stable-employment percentage? A property-management company in the area should have these aggregated.
- How much new for-sale + rental construction is in the pipeline within 1–3 miles? Heavy new supply typically softens prices + rents 12–24 months out; constrained supply supports both.
Investment metrics
- 1% rule
- 0.82% ✗
- Cap rate
- 6.28%
- Cash-on-cash
- -0.05%
- DSCR
- 1.00
- GRM
- 10.1
CMA / ARV
- ARV (on-the-fly)
- $156,240
- Comps found
- 12
Show comp detail 12 sales within ~0.75 mi
| Address | Dist | Beds/Ba | Sqft | Sold | Price | $/sf | Match |
|---|---|---|---|---|---|---|---|
| 1089 Byrd Ave | 0.14mi | 3/1.0 (+1) | 1,019 (+1%) | 12mo | $68,000 | $67 | 75 |
| 1337 Shepherd Ln | 0.32mi | 2/1.0 | 979 (-3%) | 8mo | $155,000 | $158 | 72 |
| 1324 Behles Ave | 0.26mi | 3/1.0 (+1) | 1,000 (-1%) | 12mo | $155,000 | $155 | 70 |
| 315 Home Ave | 0.39mi | 2/1.0 | 945 (-6%) | 4mo | $188,000 | $199 | 66 |
| 964 Shepherd Ln | 0.18mi | 2/1.0 | 868 (-14%) | 5mo | $35,000 | $40 | 63 |
| 1401 Chamberlain Ave | 0.36mi | 2/1.0 | 891 (-12%) | 1mo | $60,000 | $67 | 61 |
| 837 Matthews Dr | 0.57mi | 3/1.0 (+1) | 1,036 (+3%) | 2mo | $110,000 | $106 | 60 |
| 1282 Steffen Ave | 0.25mi | 3/2.0 (+1) | 864 (-14%) | 3mo | $230,000 | $266 | 55 |
| 733 Stewart Ave | 0.63mi | 2/1.0 | 911 (-10%) | 6mo | $115,000 | $126 | 48 |
| 116 Eggerding Dr | 0.60mi | 3/1.0 (+1) | 1,082 (+7%) | 9mo | $209,900 | $194 | 45 |
| 707 Heimert Ave | 0.67mi | 2/1.0 | 1,136 (+13%) | 16mo | $154,500 | $136 | 32 |
| 405 W Forrer St | 0.73mi | 3/1.0 (+1) | 1,133 (+12%) | 8mo | $196,000 | $173 | 32 |
Match score weights: distance 35% · size 25% · config 20% · recency 20%. Top-matched comps best support the ARV.
Projected returns pro-forma
-3.0% appreciation · 8.0% rent growth · sell at horizon
- IRR
- -11.2%
- Equity multiple
- 0.57×
- Total profit
- $-19,095
- Equity at exit
- $23,857
- IRR
- 3.8%
- Equity multiple
- 1.33×
- Total profit
- $14,879
- Equity at exit
- $13,834
Cash invested: $44,800 (down + closing). Projections, not guarantees.
Landlord ↔ Tenant lean methodology
- Overall (STATE)
- 73 Landlord-Friendly
- State Ohio
- 73 Landlord-Friendly · R+6
- County
- — inherits STATE
- City
- — inherits STATE
ZIP-level market 45215
- Rents YoY
- 8.0%
- Active inventory
- 50
- Price-to-rent
- 10.1×
Monthly cashflow live
- Estimated rent
- $1,320 high interval (Pro) →
- Mortgage (P&I)
- −$839
- Tax from tax record
- −$139 /mo · $1,664/yr
- Insurance
- −$67
- HOA
- −$0
- Vacancy / Maint / Mgmt
- −$277
- Net cashflow
- $-2
Break-even live
Sensitivity live
| Price | -10% $89 | -5% $43 | +0% $-2 | +5% $-47 | +10% $-93 |
|---|---|---|---|---|---|
| Rent | -10% $-106 | -5% $-54 | +0% $-2 | +5% $50 | +10% $102 |
| Rate | -1.0pp $79 | -0.5pp $39 | base $-2 | +0.5pp $-43 | +1.0pp $-86 |
UW: 25.0% down · 7.5% · 30yr · 1.5% tax · 5.0% vac · 8.0% maint · 8.0% mgmt
Financing live
Cash to close
- Down payment
- $40,000
- Closing costs
- $4,800
- Reserves months
- —
- Total cash needed
- —
Loan-product check · same deal, 3 products live
Conventional
25% down · 7.5% · 30yr
- Down + closing
- —
- Monthly P&I
- —
- Monthly cashflow
- —
- DSCR
- —
- Eligible?
- —
Personal DTI + credit; lowest rate.
DSCR
20% down · 8.5% · 30yr
- Down + closing
- —
- Monthly P&I
- —
- Monthly cashflow
- —
- DSCR
- —
- Eligible?
- —
No personal income docs; deal must DSCR.
Hard money
10% down · 12.0% · 12mo
- Down + closing
- —
- Monthly P&I
- —
- Monthly cashflow
- —
- DSCR
- —
- Eligible?
- —
Short-term bridge; refi at stabilization.
Rent comps 6 comps
| Address | Beds | Baths | Sqft | Rent | $/sqft | DOM | Units | Dist |
|---|---|---|---|---|---|---|---|---|
| 738 Adams St Apt 1 Cincinnati, OH | 2.0 | 1.0 | 750 | $1,095 | $1.46 | 45d | 1 | 0.41mi |
| 617 Van Roberts Pl Cincinnati, OH | 2.0 | 1.0 | 1109 | $1,475 | $1.33 | 9d | 1 | 0.78mi |
| 325 Pike St #5 Cincinnati, OH | 1.0 | 1.0 | 800 | $875 | $1.09 | 25d | 1 | 1.23mi |
| 301 W Benson St Unit 6 Cincinnati, OH | 3.0 | 2.0 | 1500 | $1,995 | $1.33 | 45d | 1 | 1.31mi |
| 332 Arlington Ave Cincinnati, OH | 3.0 | 2.0 | 1500 | $1,750 | $1.17 | 19d | 1 | 1.34mi |
| 531 Davis St Unit 4 Cincinnati, OH | 1.0 | 1.0 | 800 | $850 | $1.06 | 4d | 1 | 1.44mi |
Listing history 16 events
-
2026-06-21days on market $160,000 Active 32 DOM
-
2026-06-18days on market $160,000 Active 29 DOM
-
2026-06-17days on market $160,000 Active 28 DOM
-
2026-06-16days on market $160,000 Active 27 DOM
-
2026-06-15days on market $160,000 Active 26 DOM
-
2026-06-13days on market $160,000 Active 24 DOM
-
2026-06-13days on market $160,000 Active 23 DOM
-
2026-06-09days on market $160,000 Active 20 DOM
-
2026-06-08days on market $160,000 Active 19 DOM
-
2026-06-07days on market $160,000 Active 18 DOM
-
2026-06-05days on market $160,000 Active 15 DOM
-
2026-06-03days on market $160,000 Active 14 DOM
-
2026-06-02days on market $160,000 Active 13 DOM
-
2026-06-01days on market $160,000 Active 12 DOM
-
2026-05-31days on market $160,000 Active 11 DOM
-
2026-05-20$160,000 Active
ⓘ Source: listings_history table (triggers on properties + properties_extension) + one-shot
backfill from property_details.listing_events for pre-trigger history.
Tax reassessment forecast OH · Partial reset (capped growth)
- Current annual tax
- $1,664 · $139/mo
- Projected year-2 tax
- $2,080 · $173/mo
- Expected delta
- +$416/yr (+$35/mo · 25.0%)
ⓘ Screening estimate from a state-policy table — verify with the county assessor before closing.
Climate risk First Street
- Flood 1/10 Low FEMA zone X (unshaded) · 0% chance over 30 yrs
- Wildfire 1/10 Low
- Heat 4/10 Moderate 7 d/yr ≥103°F today · 19 d/yr by 30 yrs out
- Wind 2/10 Low 100% chance of damaging wind over 30 yrs
- Air quality 3/10 Moderate 2 unhealthy d/yr today · 3 by 30 yrs out
Nearby sold comps map
Loading sold comps map…
Walkable amenities ~0.75 mi
Loading nearby amenities…
Taxation est. · year 1
- Rental income
- $15,834
- − Mortgage interest
- −$8,962
- − Property taxes
- −$1,664
- − Insurance
- −$800
- − Repairs & maintenance
- −$1,267
- − Management
- −$1,267
- − Depreciation
- −$4,655
- Taxable loss
- −$2,780
- Est. tax savings @ 24.0%
- +$667
- After-tax cash flow
- $644/yr
For passive investors: Depreciation is non-cash, so a rental often shows a tax loss while cash-flowing — sheltering income. Rental losses are passive: they offset passive income freely, and up to $25,000/yr can offset ordinary (W-2) income if you actively participate and your MAGI is under $100k (phasing out to $0 by $150k); unused losses carry forward. On sale, claimed depreciation is recaptured at up to 25%, and gains may owe capital-gains tax (a 1031 exchange can defer both). Figures are a year-1 estimate at your 24.0% rate — not tax advice; consult a CPA.
Schools (NCES district)
- District
- Princeton City
- NCES district ID
- 3904467
- Math proficiency
- 34% ▼ -18.00%
- Reading proficiency
- 43% ▼ -8.00%
- Median HH income
- $53,182
- Composite
- 33.52/100
- National rank
- #5436
- State rank
- #542 of 656 in OH
Livability — Lincoln Heights
- Score
- 69/100
- State rank
- #534
- US rank
- #9027
Category grades
Schools grade is shown separately in the Schools card above.
Census & demographics
- Census place
- Lincoln Heights, OH
- County
- Hamilton County · 701,295 people
- Metro
- Cincinnati, OH-KY-IN
- Population (ZIP)
- 30,586
- Household income
- $69,372
- Rent vs Own
- Severe rent burden
- 1529.0
Population outlook (Hamilton County) Hauer SSP2
- Today (2025)
- 826,054 people
- By 2030
- 830,947 · +0.6%
- By 2040
- 832,319 · +0.8%
- By 2050
- 822,428 · -0.4%
- By 2075
- 788,688 · -4.5%
- By 2100
- 710,674 · -14.0%
Race, ethnicity, and origin ACS 2023
- Neighborhood character
- Majority White (63%)
- Race & ethnicity
- White 63% Black 26% Two or more races 6% Hispanic / Latino 3% Asian 2%
- Common ancestry
- Italian 3% Slovak 2% Lithuanian 1%
- Foreign-born
- 4% · Canada
- Languages at home
- 95% English-only · Spanish 2% Other Indo-European 1% French/Haitian/Cajun 1%
Political lean MEDSL · Hamilton
- 2024 margin
- D (+14.9) · D 57.0% · R 42.1%
- 2008→2024 swing
- +7.9pp toward D · 2008: 7.0pp · 2024: 14.9pp
- All cycles
- 2024: D+14.9 2020: D+15.9 2016: D+9.5 2012: D+4.9 2008: D+7.0
Not yet ingested
- Civics
- —
Market trends
- HPI YoY
- ▼ -263.50%
- Current HPI
- 217.3319
- Rent YoY
- ▲ 8.02%
- Metro
- Cincinnati, OH-KY-IN
- State GDP YoY
- ▲ 1.98%
- F500 in state
- 48
Industry mix (Fortune 500 HQ in OH)
| Industry | F500 HQs | Revenue |
|---|---|---|
| Insurance | 3 | $145B |
|
||
| Industrial Machinery | 3 | $49B |
|
||
| Financial Services | 3 | $24B |
|
||
| Consumer Goods | 2 | $93B |
|
||
| Aerospace / Defense | 2 | $47B |
|
||
| Utilities | 2 | $33B |
|
||
Price history
1 event — show timeline
- 2026-05-20 Listed $160,000 Cincy MLS
Property tax history
+7.6%/yrLatest (2025): $1,664 · +17.1% YoY. Source: county tax records.
Cash-flow waterfall
monthlySold comps — $/sqft
last 12 mo · ≤1 miLoading sold comps…