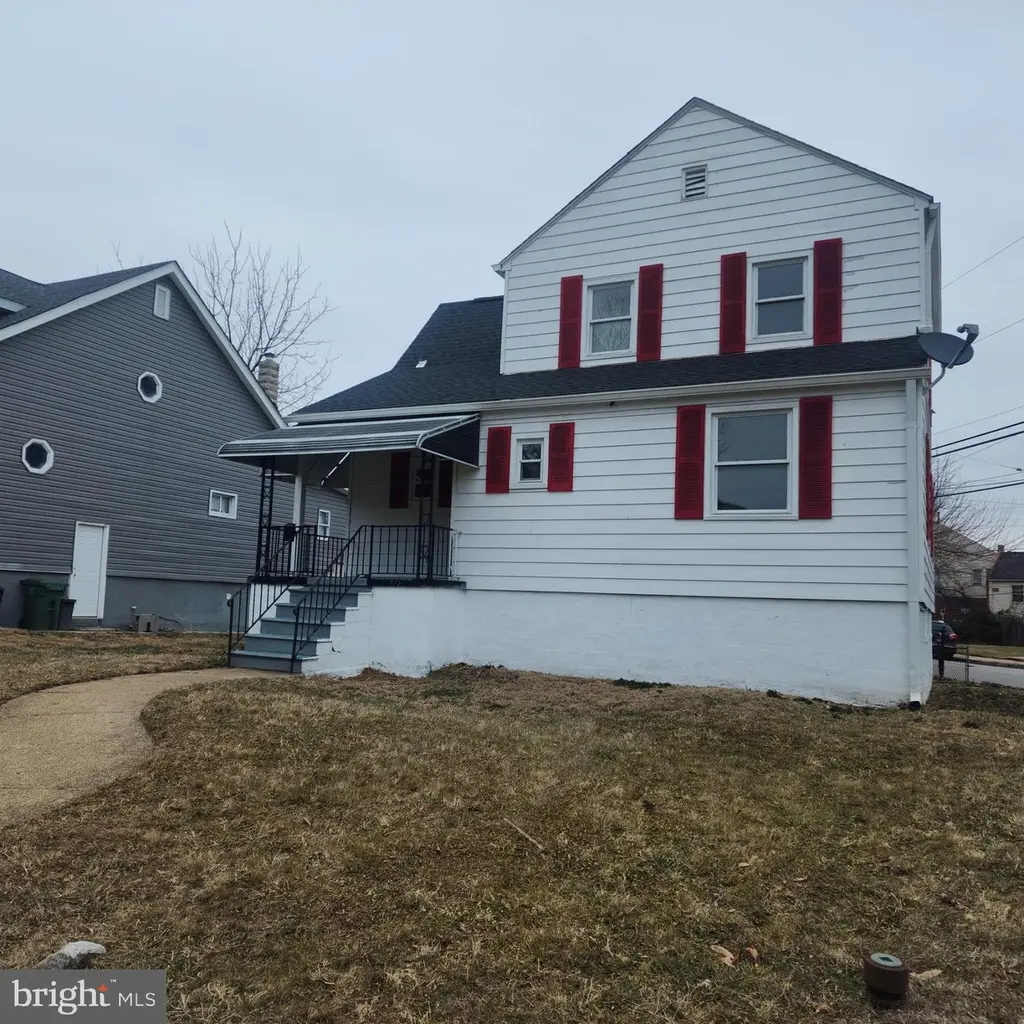
3800 Fernhill Ave · Baltimore, MD
Flood risk 1/10 · Minimal
- FEMA flood zone
- X (unshaded)
- Chance of flooding over 30 yrs
- 0.0%
- Est. flood insurance / yr
- $473 – $860
Fire risk 1/10 · Minimal
- Est. fire insurance / yr
- $755 – $1,403
Heat risk 7/10 · Major
- Hot days now (above 104°F)
- 7 days/yr
- Hot days in 30 yrs
- 15 days/yr
Wind risk 4/10 · Minor
- Chance of severe wind over 30 yrs
- 21.0%
Air-quality risk 3/10 · Minor
- Unhealthy air days now
- 3 days/yr
- Unhealthy air days in 30 yrs
- 4 days/yr
Risk factors via First Street. Map © Google.
Why this score? — see what drove the C grade
The composite is a weighted blend of 9 inputs, each scored 0–100. Each bar is that input's sub-score; the figure is the points it added to the 100-point composite (weight × sub-score).
- Cash flow +19.6/30.0
- ARV discount +15.0/15.0
- DSCR +6.2/10.0
- 1% rule +6.1/10.0
- Livability +3.8/5.0
- Rent growth +3.1/5.0
- Condition / age +2.5/5.0
- Schools +1.0/10.0
- Appreciation +0.0/10.0
$165,000
🖨 Deal sheet (PDF) 📄 Offer letter ✓ Due diligence
Listing remarks MLS
This is a Fannie Mae Homepath Property. Front porch cape cod style detached home with 3 Bedrooms, 1 Full Baths, and 2 Half Baths. Spacious living area, Outside Entrance, Rear Entrance basement, Rear Deck, Patio, and fence backyard.
Key facts
- Front porch
- Detached home
- Outside entrance
Tags
Neighborhood map
What this means for you Summary
Snapshot
- This is a 3-bed/1.0-bath single-family listed at $165k.
Deal economics
- At list price, monthly cash flow is $189 ($2k/yr) — positive.
- The deal already cash-flows at list — no discount required.
- Meets the 1% rule at list price ($2k rent vs $165k).
- Recommended offer: $150k (9.0% below list) — sets the bar for market timing.
- Cap rate 7.7% vs local median 6.0% in Baltimore — meaningfully above typical; check what's discounted (condition, days-on-market, listing class) to confirm the premium yield is real.
Location & tenants
- Location reads 76/100 on livability (#90 in MD, #3,396 nationally) — a middle-class / working-renter tenant base. Strengths: amenities A+, commute A+, housing A+; Watch: schools D, crime F.
- Baltimore City Public Schools (urban): math 7% / reading 16% proficiency, ranked #24 of 24 in MD (top 100%) — low school quality limits family demand, transient renter base, plan for 1-2y turnover; 79% free/reduced lunch — lower-income household profile, screen leases tightly.
- Market conditions: Rents rising (+2.4%/yr); 351 active listings in the ZIP; 21 comparable units currently listed for rent nearby; rentals at typical pace (median 25d on market — plan ~3-4 weeks tenant-placement turnaround); 48% of comp listings sitting > 30 days — soft ceiling on asking rent; 1,273 units permitted in Baltimore city in 2024 (1,104 in 5+ unit buildings).
- This rent runs 43% of the median local income ($52k/yr) — at the standard rent-burdened threshold; future hikes will face affordability resistance.
Forward outlook
- Local home prices are declining (-3.0%/yr); year-one equity from $1k of loan paydown is wiped out by about $5k of value loss. Plan a longer hold.
- Baltimore County population projected to shrink 4% by 2050 — rents likely to lag national; underwrite the cash flow, not the appreciation.
Negotiation context
- It's been on market 92 days — a 9% lower offer ($150k) is reasonable based on typical stale-listing flexibility.
- 4 sale attempts since 19y ago; this cycle's ask has dropped $10k (6%) from the opening price — seller is motivated, your offer sets the floor, not the list.
Risks & watch-outs
- Watch-outs: built in 1927 — expect roof / HVAC / electrical / plumbing capex.
- Climate carrying-cost: extreme-heat days projected 7→15/yr by 2055 (HVAC capex compounding) — expect insurance premiums to compound above CPI over the hold.
Questions for the listing agent
- It's been on market 92 days. Have you received any prior offers? Is the seller open to a 9% concession, seller financing, or rate buy-down credit?
- Built in 1927 — when were the roof, HVAC, electrical panel, plumbing, and water heater last replaced?
- Why hasn't it sold? Are there any deal-killer items the seller is aware of (foundation, flood, title, zoning, code violations)?
- Is there a deadline driving the sale (1031 exchange, divorce, estate, relocation)? That informs how much negotiation room exists.
- Schools are D-rated, which usually means shorter tenancies and higher turnover. Who's the typical renter profile here, and what's been the actual vacancy rate?
- Crime grade is F in this area — have there been break-ins, vandalism, or insurance claims at this property in the last 3 years? What carrier currently insures it and at what premium?
- What's the average days-on-market for RENTAL listings here right now (not sales)? A rising rental-DOM trend means longer vacancies and softer asking-rent achievability than the comps imply.
- What's the recent tenant-quality profile in this submarket — average credit score on applications, eviction rate, late-payment / NSF rate, and stable-employment percentage? A property-management company in the area should have these aggregated.
- How much new for-sale + rental construction is in the pipeline within 1–3 miles? Heavy new supply typically softens prices + rents 12–24 months out; constrained supply supports both.
Investment metrics
- 1% rule
- 1.11% ✓
- Cap rate
- 7.67%
- Cash-on-cash
- 4.92%
- DSCR
- 1.22
- GRM
- 7.5
CMA / ARV
- ARV (median comp)
- $288,685
- List price
- $165,000
- Delta
- -42.84%
- Verdict
- UNDERPRICED
- Comps
- 20 within 1.0 mi
Show comp detail 12 sales within ~0.75 mi
| Address | Dist | Beds/Ba | Sqft | Sold | Price | $/sf | Match |
|---|---|---|---|---|---|---|---|
| 3908 Fernhill Ave | 0.17mi | 3/1.0 | 1,578 (+4%) | 1mo | $139,900 | $89 | 84 |
| 3803 Fernhill Ave | 0.03mi | 3/1.5 | 1,380 (-9%) | 15mo | $255,000 | $185 | 70 |
| 3700 Belle Ave | 0.30mi | 3/2.0 | 1,359 (-10%) | 6mo | $295,000 | $217 | 60 |
| 5304 Wabash Ave | 0.67mi | 3/2.0 | 1,540 (+2%) | 3mo | $305,000 | $198 | 59 |
| 3802 Grantley Rd | 0.50mi | 3/1.5 | 1,664 (+10%) | 1mo | $193,900 | $117 | 57 |
| 3812 Callaway Ave | 0.39mi | 3/2.0 | 1,732 (+14%) | 11mo | $280,000 | $162 | 44 |
| 4217 Ridgewood Ave | 0.63mi | 2/2.0 (-1) | 1,352 (-11%) | 2mo | $150,000 | $111 | 42 |
| 4018 Elderon Ave | 0.51mi | 2/2.0 (-1) | 1,380 (-9%) | 14mo | $230,000 | $167 | 41 |
| 5222 Cuthbert Ave | 0.69mi | 4/2.0 (+1) | 1,455 (-4%) | 17mo | $215,000 | $148 | 38 |
| 3507 Cedardale Rd | 0.71mi | 4/1.5 (+1) | 1,321 (-13%) | 1mo | $185,000 | $140 | 38 |
| 4405 Vesta Ave | 0.70mi | 4/1.0 (+1) | 1,388 (-8%) | 19mo | $215,000 | $155 | 33 |
| 3314 Barrington Rd | 0.75mi | 4/3.0 (+1) | 1,364 (-10%) | 23mo | $379,900 | $279 | 17 |
Match score weights: distance 35% · size 25% · config 20% · recency 20%. Top-matched comps best support the ARV.
Projected returns pro-forma
-3.0% appreciation · 2.41% rent growth · sell at horizon
- IRR
- -9.3%
- Equity multiple
- 0.66×
- Total profit
- $-15,653
- Equity at exit
- $24,602
- IRR
- -0.7%
- Equity multiple
- 0.96×
- Total profit
- $-2,074
- Equity at exit
- $14,266
Cash invested: $46,200 (down + closing). Projections, not guarantees.
Landlord ↔ Tenant lean methodology
- Overall (CITY)
- 12 Strongly Tenant-Friendly
- State Maryland
- 27 Tenant-Leaning · D+14
- County
- — inherits STATE
- City Baltimore
- 12 Strongly Tenant-Friendly · D+58
ZIP-level market 21215
- Rents YoY
- 2.4%
- Active inventory
- 351
- Price-to-rent
- 7.5×
Monthly cashflow live
- Estimated rent
- $1,834 high interval (Pro) →
- Mortgage (P&I)
- −$865
- Tax from tax record
- −$325 /mo · $3,906/yr
- Insurance
- −$69
- HOA
- −$0
- Vacancy / Maint / Mgmt
- −$385
- Net cashflow
- $189
Break-even live
Sensitivity live
| Price | -10% $283 | -5% $236 | +0% $189 | +5% $143 | +10% $96 |
|---|---|---|---|---|---|
| Rent | -10% $45 | -5% $117 | +0% $189 | +5% $262 | +10% $334 |
| Rate | -1.0pp $273 | -0.5pp $231 | base $189 | +0.5pp $147 | +1.0pp $103 |
UW: 25.0% down · 7.5% · 30yr · 1.5% tax · 5.0% vac · 8.0% maint · 8.0% mgmt
Financing live
Cash to close
- Down payment
- $41,250
- Closing costs
- $4,950
- Reserves months
- —
- Total cash needed
- —
Loan-product check · same deal, 3 products live
Conventional
25% down · 7.5% · 30yr
- Down + closing
- —
- Monthly P&I
- —
- Monthly cashflow
- —
- DSCR
- —
- Eligible?
- —
Personal DTI + credit; lowest rate.
DSCR
20% down · 8.5% · 30yr
- Down + closing
- —
- Monthly P&I
- —
- Monthly cashflow
- —
- DSCR
- —
- Eligible?
- —
No personal income docs; deal must DSCR.
Hard money
10% down · 12.0% · 12mo
- Down + closing
- —
- Monthly P&I
- —
- Monthly cashflow
- —
- DSCR
- —
- Eligible?
- —
Short-term bridge; refi at stabilization.
Rent comps 21 comps
| Address | Beds | Baths | Sqft | Rent | $/sqft | DOM | Units | Dist |
|---|---|---|---|---|---|---|---|---|
| 3784 Columbus Dr Baltimore, MD | 4.0 | 2.0 | 1250 | $2,200 | $1.76 | 24d | 1 | 0.17mi |
| 4010 Fernhill Ave Unit 2 Baltimore, MD | 2.0 | 1.0 | 1100 | $1,500 | $1.36 | 44d | 1 | 0.40mi |
| 4828 Beaufort Ave Baltimore, MD | 2.0 | 2.5 | 1200 | $1,850 | $1.54 | 24d | 1 | 0.50mi |
| 5000 Litchfield Ave #1 Baltimore, MD | 2.0 | 1.0 | 1100 | $1,100 | $1.00 | 44d | 1 | 0.53mi |
| 4230 Towanda Ave Baltimore, MD | 3.0 | 2.0 | 1400 | $1,800 | $1.29 | 18d | 1 | 0.61mi |
| 3508 Grantley Rd Baltimore, MD | 2.0 | 1.0 | 1250 | $1,350 | $1.08 | 24d | 1 | 0.62mi |
| 3914 Maine Ave Unit 3 Baltimore, MD | 2.0 | 1.0 | 2127 | $1,150 | $0.54 | 44d | 1 | 0.76mi |
| 4704 Pimlico Rd Baltimore, MD | 3.0 | 1.5 | 2006 | $1,800 | $0.90 | 24d | 1 | 0.80mi |
| 3204 Sequoia Ave Baltimore, MD | 4.0 | 2.5 | 1791 | $2,600 | $1.45 | 44d | 1 | 0.85mi |
| 2915 Oakford Ave Baltimore, MD | 3.0 | 2.0 | 1102 | $1,600 | $1.45 | 18d | 1 | 0.88mi |
| 2619 Loyola Northway Baltimore, MD | 3.0 | 2.0 | 1400 | $1,995 | $1.43 | 24d | 1 | 0.90mi |
| 2454 W Cold Spring Ln Baltimore, MD | 3.0 | 1.0 | 1200 | $1,650 | $1.38 | 24d | 1 | 1.01mi |
| 5340 Maple Ave Baltimore, MD | 2.0 | 1.0 | 1200 | $1,950 | $1.62 | 44d | 1 | 1.03mi |
| 5115 Pembridge Ave Baltimore, MD | 3.0 | 2.0 | 1088 | $2,150 | $1.98 | 44d | 1 | 1.07mi |
| 3822 Pall Mall Rd Baltimore, MD | 3.0 | 1.5 | 1320 | $1,875 | $1.42 | 44d | 1 | 1.08mi |
| 2415 Loyola Southway Baltimore, MD | 3.0 | 1.5 | 1200 | $2,033 | $1.69 | 44d | 1 | 1.08mi |
| 3912 Mortimer Ave Baltimore, MD | 3.0 | 2.0 | 1204 | $2,723 | $2.26 | 44d | 1 | 1.15mi |
| 4309 Norfolk Ave Unit 1st Floor Baltimore, MD | 2.0 | 1.0 | 1470 | $1,500 | $1.02 | 12d | 1 | 1.16mi |
| 5807 Gist Ave Baltimore, MD | 2.0 | 1.5 | 2100 | $1,395 | $0.66 | 24d | 1 | 1.23mi |
| 3403 Carlisle Ave Apt 1 Baltimore, MD | 2.0 | 1.0 | 1100 | $1,600 | $1.45 | 12d | 1 | 1.25mi |
| 3807 Bowers Ave Gwynn Oak, MD | 3.0 | 1.5 | 1152 | $2,200 | $1.91 | 44d | 1 | 1.33mi |
Listing history 11 events
-
2026-05-06price $165,000 231-char remark
Show marketing remark (231 chars)
This is a Fannie Mae Homepath Property. Front porch cape cod style detached home with 3 Bedrooms, 1 Full Baths, and 2 Half Baths. Spacious living area, Outside Entrance, Rear Entrance basement, Rear Deck, Patio, and fence backyard.
-
2026-04-29status Active 231-char remark
Show marketing remark (231 chars)
This is a Fannie Mae Homepath Property. Front porch cape cod style detached home with 3 Bedrooms, 1 Full Baths, and 2 Half Baths. Spacious living area, Outside Entrance, Rear Entrance basement, Rear Deck, Patio, and fence backyard.
-
2026-03-21status Pending 231-char remark
Show marketing remark (231 chars)
This is a Fannie Mae Homepath Property. Front porch cape cod style detached home with 3 Bedrooms, 1 Full Baths, and 2 Half Baths. Spacious living area, Outside Entrance, Rear Entrance basement, Rear Deck, Patio, and fence backyard.
-
2026-01-17$175,000 Active 231-char remark
Show marketing remark (231 chars)
This is a Fannie Mae Homepath Property. Front porch cape cod style detached home with 3 Bedrooms, 1 Full Baths, and 2 Half Baths. Spacious living area, Outside Entrance, Rear Entrance basement, Rear Deck, Patio, and fence backyard.
-
2023-11-29historical
-
2023-11-10$365,000 Active
-
2008-03-22historical
-
2008-01-21price
-
2007-10-15price
-
2007-10-02price
-
2007-08-09
ⓘ Source: listings_history table (triggers on properties + properties_extension) + one-shot
backfill from property_details.listing_events for pre-trigger history.
Tax reassessment forecast MD · Partial reset (capped growth)
- Current annual tax
- $3,906 · $325/mo
- Projected year-2 tax
- $3,906 · $325/mo
- Expected delta
- $0/yr ($0/mo · 0.0%)
ⓘ Screening estimate from a state-policy table — verify with the county assessor before closing.
Climate risk First Street
- Flood 1/10 Low FEMA zone X (unshaded) · 0% chance over 30 yrs
- Wildfire 1/10 Low
- Heat 7/10 Severe 7 d/yr ≥104°F today · 15 d/yr by 30 yrs out
- Wind 4/10 Moderate 21% chance of damaging wind over 30 yrs
- Air quality 3/10 Moderate 3 unhealthy d/yr today · 4 by 30 yrs out
Nearby sold comps map
Loading sold comps map…
Walkable amenities ~0.75 mi
Loading nearby amenities…
Taxation est. · year 1
- Rental income
- $22,010
- − Mortgage interest
- −$9,243
- − Property taxes
- −$3,906
- − Insurance
- −$825
- − Repairs & maintenance
- −$1,761
- − Management
- −$1,761
- − Depreciation
- −$4,800
- Taxable loss
- −$286
- Est. tax savings @ 24.0%
- +$69
- After-tax cash flow
- $2,342/yr
For passive investors: Depreciation is non-cash, so a rental often shows a tax loss while cash-flowing — sheltering income. Rental losses are passive: they offset passive income freely, and up to $25,000/yr can offset ordinary (W-2) income if you actively participate and your MAGI is under $100k (phasing out to $0 by $150k); unused losses carry forward. On sale, claimed depreciation is recaptured at up to 25%, and gains may owe capital-gains tax (a 1031 exchange can defer both). Figures are a year-1 estimate at your 24.0% rate — not tax advice; consult a CPA.
Schools (NCES district)
- District
- Baltimore City Public Schools
- NCES district ID
- 2400090
- Math proficiency
- 7% ▼ -9.00%
- Reading proficiency
- 16% ▼ -5.00%
- Median HH income
- $42,108
- Composite
- 10.08/100
- National rank
- #9805
- State rank
- #24 of 24 in MD
Livability — Baltimore
- Score
- 76/100
- State rank
- #90
- US rank
- #3396
Category grades
Schools grade is shown separately in the Schools card above.
Census & demographics
- Census place
- Baltimore, MD
- County
- Baltimore City · 558,601 people
- City population
- 588,727
- Metro
- Baltimore-Columbia-Towson, MD
- Population (ZIP)
- 52,229
- Household income
- $51,587
- Rent vs Own
- Severe rent burden
- 3644.0
Population outlook (Baltimore County) Hauer SSP2
- Today (2025)
- 624,249 people
- By 2030
- 621,541 · -0.4%
- By 2040
- 609,756 · -2.3%
- By 2050
- 597,249 · -4.3%
- By 2075
- 552,236 · -11.5%
- By 2100
- 513,934 · -17.7%
Race, ethnicity, and origin ACS 2023
- Neighborhood character
- Predominantly Black (73%)
- Race & ethnicity
- Black 73% White 17% Hispanic / Latino 5% Two or more races 4% Asian 1%
- Common ancestry
- Scotch-Irish 2% Romanian 2% Italian 1%
- Foreign-born
- 9% · Canada, South Korea
- Languages at home
- 91% English-only · Spanish 4% French/Haitian/Cajun 1% Other Indo-European 1%
Political lean MEDSL · Baltimore
- 2024 margin
- Solid D (+73.0) · D 85.2% · R 12.2% · Other 2.6%
- 2008→2024 swing
- -2.5pp toward R · 2008: 75.5pp · 2024: 73.0pp
- All cycles
- 2024: D+73.0 2020: D+76.6 2016: D+74.6 2012: D+76.4 2008: D+75.5
Not yet ingested
- Civics
- —
Market trends
- HPI YoY
- ▼ -318.58%
- Current HPI
- 291.4926
- Rent YoY
- ▲ 2.41%
- Metro
- Baltimore-Columbia-Towson, MD
- State GDP YoY
- ▲ 2.97%
- F500 in state
- 12
Industry mix (Fortune 500 HQ in MD)
| Industry | F500 HQs | Revenue |
|---|---|---|
| Aerospace / Defense | 1 | $71B |
|
||
| Utilities | 1 | $25B |
|
||
| Hotels | 1 | $24B |
|
||
| Consumer Goods | 1 | $7B |
|
||
| Real Estate | 1 | $6B |
|
||
| Chemicals | 1 | $2B |
|
||
Price history
-54.8% since first listed11 events — show timeline
- 2026-05-06 Price Changed $165,000 BRIGHT MLS
- 2026-04-29 Relisted — BRIGHT MLS
- 2026-03-21 Pending — BRIGHT MLS
- 2026-01-17 Listed $175,000 BRIGHT MLS
- 2023-11-29 Listing Removed — BRIGHT MLS
- 2023-11-10 Listed $365,000 BRIGHT MLS
- 2008-03-22 Delisted — MRIS
- 2008-01-21 Price Changed — MRIS
- 2007-10-15 Price Changed — MRIS
- 2007-10-02 Price Changed — MRIS
- 2007-08-09 Listed — MRIS
Property tax history
+1.7%/yrLatest (2025): $3,906 · +5.8% YoY. Source: county tax records.
Cash-flow waterfall
monthlySold comps — $/sqft
last 12 mo · ≤1 miLoading sold comps…