194 Shohola Pkwy N Lot 2612 & lot 2613 · Gold Key Lake, PA
Flood risk 1/10 · Minimal
- FEMA flood zone
- X (unshaded)
- Chance of flooding over 30 yrs
- 0.0%
- Est. flood insurance / yr
- $507 – $1,088
Fire risk 5/10 · Moderate
- Est. fire insurance / yr
- $511 – $949
Heat risk 2/10 · Minimal
- Hot days now (above 91°F)
- 7 days/yr
- Hot days in 30 yrs
- 14 days/yr
Wind risk 3/10 · Minor
- Chance of severe wind over 30 yrs
- 6.0%
Air-quality risk 2/10 · Minimal
- Unhealthy air days now
- 1 days/yr
- Unhealthy air days in 30 yrs
- 2 days/yr
Risk factors via First Street. Map © Google.
Why this score? — see what drove the B+ grade
The composite is a weighted blend of 9 inputs, each scored 0–100. Each bar is that input's sub-score; the figure is the points it added to the 100-point composite (weight × sub-score).
- Cash flow +30.0/30.0
- 1% rule +10.0/10.0
- DSCR +10.0/10.0
- Appreciation +10.0/10.0
- ARV discount +7.5/15.0
- Schools +4.7/10.0
- Livability +3.5/5.0
- Rent growth +2.5/5.0
- Condition / age +1.0/5.0
$45,900
🖨 Deal sheet 📄 Offer letter ✓ Due diligence
Listing remarks
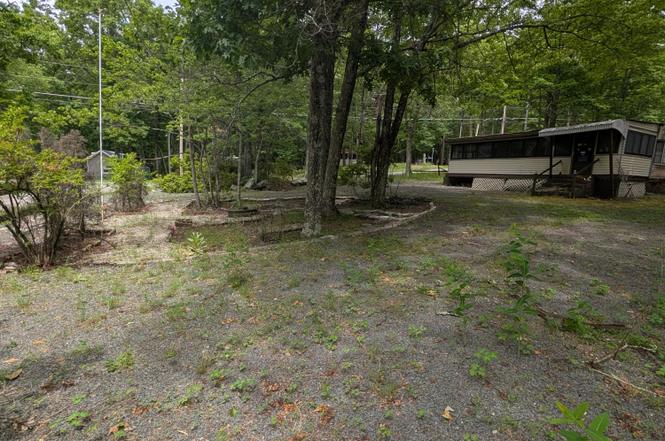
Handy Man SpecialThis property in Trails End Recreational Park is 2 Level stoned lots with an RV which needs repairs or removal. Great for that handyman to bring back to life or put on 1 or 2 new rvs on 2 great lots. . 1 shed on each property . Property close to Clubhouse and activities
Key facts
- 2 level stoned lots
- 9,583 sq ft lot
- Community pool
Tags
Property features AI
Finance
- Other: Private maintained road and private road frontage; Zoned commercial
- HOA & community: Has homeowners association; Annual association fee listed; One-time association fee listed; Association covers electricity, security, water, trash and sewer; Community amenities: pool, basketball court, racquetball, playground, game room, fitness center, clubhouse, restaurant
Exterior
- Parking: Gravel on-site parking; Off-street parking
- Security: Gated community
- Utilities: Electricity connected; Water available; Public sewer / sewer connected
- Home design: Manufactured home; Residential property; Manufactured house / Manufactured home; Vacation RV/Trailer subtype; Vacant; No common walls
- Construction: Shingle roof; Above-grade finished area listed as 250
- Exterior features: Enclosed front porch; Split rail fencing; Cleared lot with few trees; Close to clubhouse; Rectangular, interior corner lot; Has view
Interior
- Kitchen: Free-standing gas range; Free-standing refrigerator
- Bedrooms: 2 total rooms (includes living and sleeping areas)
- Bathrooms: 1 full bathroom
- Interior features: Free-standing gas range; Free-standing refrigerator; Storage
- Laundry & utility: No laundry on site; No basement
Neighborhood map
What this means for you Summary
Snapshot
- This is a 1-bed/1.0-bath manufactured listed at $46k. Condition is rated poor.
Deal economics
- At list price, monthly cash flow is $541 ($6k/yr) — positive.
- The deal already cash-flows at list — no discount required.
- Meets the 1% rule at list price ($1k rent vs $46k).
- Cap rate 20.4% vs local median 5.9% in Gold Key Lake — top-decile yield for the area; either an underpriced asset or a hidden risk that comps aren't pricing in. Stress-test before assuming the spread holds.
Location & tenants
- Location reads 70/100 on livability (#789 in PA) — a middle-class / working-renter tenant base. Strengths: crime A+, employment A+, housing A+; Watch: schools D, health & safety D, amenities F.
- Delaware Valley SD (rural): math 41% / reading 66% proficiency, ranked #121 of 539 in PA (top 22%) — acceptable for families but not a draw, mixed tenant base, ~2y average lease.
- Market conditions: 112 active listings in the ZIP; 213 units permitted in Pike County in 2024 (0 in 5+ unit buildings).
Forward outlook
- In year one you build about $5k of equity ($317 loan paydown + $5k appreciation (10.0% local appreciation)).
- Pike County population projected at -25% by 2050 — secular population decline; favor cash flow + early exit over multi-decade hold.
- At projected returns (10.0% appreciation + 3.0% rent growth), your $13k cash investment doubles in ~2 years — after that, you're playing with house money.
- By year 7, paydown + projected appreciation supports a ~$35k cash-out refi (75% LTV) — recoverable capital for the next deal without selling this one.
Negotiation context
- Only 2 days on market — expect competitive offers; lowballing is unlikely to land.
Risks & watch-outs
- Climate carrying-cost: moderate wildfire risk — expect insurance premiums to compound above CPI over the hold.
Questions for the listing agent
- Have any recent inspections been done? Can we get a copy of the seller's disclosures and any deferred-maintenance estimates?
- What does the HOA fee cover, when was the last increase, and are there any pending special assessments or reserve-fund shortfalls?
- Is there a deadline driving the sale (1031 exchange, divorce, estate, relocation)? That informs how much negotiation room exists.
- Schools are D-rated, which usually means shorter tenancies and higher turnover. Who's the typical renter profile here, and what's been the actual vacancy rate?
- What's the average days-on-market for RENTAL listings here right now (not sales)? A rising rental-DOM trend means longer vacancies and softer asking-rent achievability than the comps imply.
- What's the recent tenant-quality profile in this submarket — average credit score on applications, eviction rate, late-payment / NSF rate, and stable-employment percentage? A property-management company in the area should have these aggregated.
- How much new for-sale + rental construction is in the pipeline within 1–3 miles? Heavy new supply typically softens prices + rents 12–24 months out; constrained supply supports both.
Investment metrics
- 1% rule
- 2.82% ✓
- Cap rate
- 20.44%
- Cash-on-cash
- 50.54%
- DSCR
- 3.25
- GRM
- 3.0
CMA / ARV
- ARV (on-the-fly)
- $26,000
- Comps found
- 1
Show comp detail 1 sale within ~0.75 mi
| Address | Dist | Beds/Ba | Sqft | Sold | Price | $/sf | Match |
|---|---|---|---|---|---|---|---|
| 973 Beaver Ln | 0.19mi | 2/1.0 (+1) | 500 (0%) | 14mo | $26,000 | $52 | 74 |
Match score weights: distance 35% · size 25% · config 20% · recency 20%. Top-matched comps best support the ARV.
Projected returns pro-forma
10.0% appreciation · 3.0% rent growth · sell at horizon
- IRR
- 64.1%
- Equity multiple
- 5.64×
- Total profit
- $59,592
- Equity at exit
- $41,350
- IRR
- 57.7%
- Equity multiple
- 12.56×
- Total profit
- $148,617
- Equity at exit
- $89,174
Cash invested: $12,852 (down + closing). Projections, not guarantees.
Landlord ↔ Tenant lean methodology
- Overall (STATE)
- 62 Landlord-Friendly
- State Pennsylvania
- 62 Landlord-Friendly · EVEN
- County
- — inherits STATE
- City
- — inherits STATE
ZIP-level market 18458
- Home prices YoY
- 13.2%
- Active inventory
- 112
- Price-to-rent
- 3.0×
Monthly cashflow live
- Estimated rent
- $1,293 medium interval (Pro) →
- Mortgage (P&I)
- −$241
- Tax est. 1.5%
- −$57 /mo · $688/yr
- Insurance
- −$19
- HOA
- −$163
- Vacancy / Maint / Mgmt
- −$272
- Net cashflow
- $541
Break-even live
UW: 25.0% down · 7.5% · 30yr · 1.5% tax · 5.0% vac · 8.0% maint · 8.0% mgmt
Financing live
Cash to close
- Down payment
- $11,475
- Closing costs
- $1,377
- Reserves months
- —
- Total cash needed
- —
Loan-product check · same deal, 3 products live
Conventional
25% down · 7.5% · 30yr
- Down + closing
- —
- Monthly P&I
- —
- Monthly cashflow
- —
- DSCR
- —
- Eligible?
- —
Personal DTI + credit; lowest rate.
DSCR
20% down · 8.5% · 30yr
- Down + closing
- —
- Monthly P&I
- —
- Monthly cashflow
- —
- DSCR
- —
- Eligible?
- —
No personal income docs; deal must DSCR.
Hard money
10% down · 12.0% · 12mo
- Down + closing
- —
- Monthly P&I
- —
- Monthly cashflow
- —
- DSCR
- —
- Eligible?
- —
Short-term bridge; refi at stabilization.
HOA detail
- Monthly dues
- $163 · $1,956/yr
Listing history 3 events
-
2026-06-18days on market $45,900 Active 2 DOM
-
2026-06-17remarks 287-char remark
-
2026-06-17$45,900 Active 1 DOM
ⓘ Source: listings_history table (triggers on properties + properties_extension) + one-shot
backfill from property_details.listing_events for pre-trigger history.
Climate risk First Street
- Flood 1/10 Low FEMA zone X (unshaded) · 0% chance over 30 yrs
- Wildfire 5/10 Major
- Heat 2/10 Low 7 d/yr ≥91°F today · 14 d/yr by 30 yrs out
- Wind 3/10 Moderate 6% chance of damaging wind over 30 yrs
- Air quality 2/10 Low 1 unhealthy d/yr today · 2 by 30 yrs out
Nearby sold comps map
Loading sold comps map…
Walkable amenities ~0.75 mi
Loading nearby amenities…
Taxation est. · year 1
- Rental income
- $15,516
- − Mortgage interest
- −$2,571
- − Property taxes
- −$688
- − Insurance
- −$230
- − Repairs & maintenance
- −$1,241
- − Management
- −$1,241
- − HOA
- −$1,956
- − Depreciation
- −$1,335
- Taxable income
- $6,253
- Est. tax owed @ 24.0%
- −$1,501
- After-tax cash flow
- $4,995/yr
For passive investors: Depreciation is non-cash, so a rental often shows a tax loss while cash-flowing — sheltering income. Rental losses are passive: they offset passive income freely, and up to $25,000/yr can offset ordinary (W-2) income if you actively participate and your MAGI is under $100k (phasing out to $0 by $150k); unused losses carry forward. On sale, claimed depreciation is recaptured at up to 25%, and gains may owe capital-gains tax (a 1031 exchange can defer both). Figures are a year-1 estimate at your 24.0% rate — not tax advice; consult a CPA.
Condition & rehab AI · 12 photos
This property requires extensive repairs and landscaping to become livable and attractive. Significant investment is needed to improve its condition and resale value.
Repairs flagged
- Major Mobile home exterior — Significant rust and wear
- Major Roof — Appears to be in poor condition
Value-add opportunities
- Both Landscaping and exterior repairs — Improving curb appeal and overall condition
- Both Mobile home repairs — Restoring the home to livable condition
Renovation cost estimate screening
| Repair item | Severity | Est. cost |
|---|---|---|
| Mobile home exterior · Significant rust and wear | Major | $15,000–50,000 |
| Roof · Appears to be in poor condition | Major | $15,000–50,000 |
| Total estimated repair cost · 2 items | $30,000–100,000 |
Value-add ROI direction
- Both Landscaping and exterior repairs — Improving curb appeal and overall condition ↑
- Both Mobile home repairs — Restoring the home to livable condition ↑
ⓘ Cost ranges are severity-bucket heuristics (US national rule-of-thumb). Get contractor quotes + a written scope before underwriting a rehab budget.
Schools (NCES district)
- District
- Delaware Valley SD
- NCES district ID
- 4207530
- Math proficiency
- 41% ▼ -12.00%
- Reading proficiency
- 66% ▼ -9.00%
- Median HH income
- $64,202
- Composite
- 46.95/100
- National rank
- #2359
- State rank
- #121 of 539 in PA
Livability — Gold Key Lake
- Score
- 70/100
- State rank
- #789
- US rank
- #7969
Category grades
Schools grade is shown separately in the Schools card above.
Census & demographics
- Population (ZIP)
- 3,576
Population outlook (Pike County) Hauer SSP2
- Today (2025)
- 53,548 people
- By 2030
- 51,622 · -3.6%
- By 2040
- 46,490 · -13.2%
- By 2050
- 40,372 · -24.6%
- By 2075
- 31,951 · -40.3%
- By 2100
- 26,821 · -49.9%
Race, ethnicity, and origin ACS 2023
- Neighborhood character
- Predominantly White (93%)
- Race & ethnicity
- White 93% Two or more races 4% Hispanic / Latino 3% Asian 1%
- Common ancestry
- Romanian 7% Lithuanian 2% Serbian 1%
- Foreign-born
- 3% · Canada
- Languages at home
- 95% English-only · German/W. Germanic 2% Spanish 2% Other Indo-European 1%
Political lean MEDSL · Pike
- 2024 margin
- Strong R (+24.1) · D 37.6% · R 61.6%
- 2008→2024 swing
- -19.8pp toward R · 2008: -4.2pp · 2024: -24.1pp
- All cycles
- 2024: R+24.1 2020: R+19.0 2016: R+26.0 2012: R+11.0 2008: R+4.2
Not yet ingested
- Civics
- —
Market trends
- HPI YoY
- ▲ 31.80%
- Current HPI
- 272.6294
- Rent YoY
- —
- Metro
- —
- State GDP YoY
- ▲ 1.68%
- F500 in state
- 34
Industry mix (Fortune 500 HQ in PA)
| Industry | F500 HQs | Revenue |
|---|---|---|
| Healthcare | 2 | $309B |
|
||
| Insurance | 2 | $27B |
|
||
| Telecommunications / Media | 1 | $124B |
|
||
| Industrial Distribution | 1 | $22B |
|
||
| Financial Services | 1 | $20B |
|
||
| Chemicals / Materials | 1 | $18B |
|
||
Price history
1 event — show timeline
- 2026-06-13 Listed $45,900 PWMLS
Cash-flow waterfall
monthlySold comps — $/sqft
last 12 mo · ≤1 miLoading sold comps…