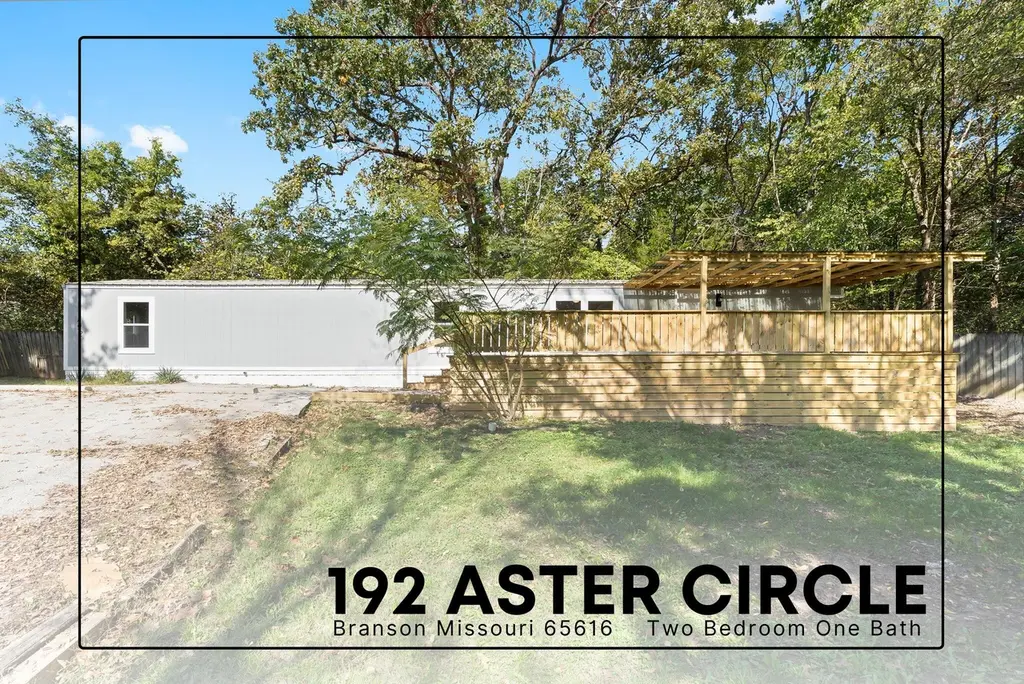
192 Aster Cir #25 · Branson, MO
Flood risk 1/10 · Minimal
- FEMA flood zone
- X (unshaded)
- Chance of flooding over 30 yrs
- 0.0%
- Est. flood insurance / yr
- $507 – $1,088
Fire risk 3/10 · Minor
- Est. fire insurance / yr
- $1,054 – $1,958
Heat risk 5/10 · Moderate
- Hot days now (above 106°F)
- 7 days/yr
- Hot days in 30 yrs
- 20 days/yr
Wind risk 2/10 · Minimal
- Chance of severe wind over 30 yrs
- 1.0%
Air-quality risk 2/10 · Minimal
- Unhealthy air days now
- 0 days/yr
- Unhealthy air days in 30 yrs
- 1 days/yr
Risk factors via First Street. Map © Google.
Why this score? — see what drove the C- grade
The composite is a weighted blend of 9 inputs, each scored 0–100. Each bar is that input's sub-score; the figure is the points it added to the 100-point composite (weight × sub-score).
- Cash flow +15.4/30.0
- ARV discount +11.9/15.0
- DSCR +4.7/10.0
- 1% rule +4.2/10.0
- Schools +4.2/10.0
- Condition / age +4.0/5.0
- Livability +3.9/5.0
- Rent growth +3.2/5.0
- Appreciation +0.0/10.0
$123,999
🖨 Deal sheet 📄 Offer letter ✓ Due diligence
Listing remarks MLS
Tucked into a quiet back corner of the neighborhood, 192 Aster Circle offers a comfortable 2-bedroom, 1-bath setup with a surprising amount of privacy and parking. The standout feature is the large front deck -- a great spot to unwind or host friends. You're just minutes from Lake Taneycomo, Table Rock Lake, the Branson Strip, plus all the shopping, dining, and entertainment the area is known for. It's the kind of location that keeps you close to everything while still feeling tucked away. Whether you're after a primary home, a weekend escape, or a solid long-term investment, this one checks a lot of boxes. YES LAND IS INCLUDED
Key facts
- Land is included
- Large front deck
- 6,098 sq ft lot
Tags
Neighborhood map
What this means for you Summary
Snapshot
- This is a 2-bed/1.0-bath manufactured listed at $124k. Condition is rated good.
Deal economics
- At list price, monthly cash flow is $47 ($561/yr) — positive.
- The deal already cash-flows at list — no discount required.
- To meet the 1% rule (rent ≥ 1% of price), the offer needs to be $114k (7.8% below list).
- Recommended offer: $114k (7.8% below list) — sets the bar for 1% rule.
- Cap rate 6.7% vs local median 2.5% in Branson — top-decile yield for the area; either an underpriced asset or a hidden risk that comps aren't pricing in. Stress-test before assuming the spread holds.
Location & tenants
- Location reads 77/100 on livability (#32 in MO, #2,940 nationally) — a middle-class / working-renter tenant base. Strengths: commute A+, cost of living A+, health & safety A+; Watch: employment C-, crime F.
- Branson R-IV (rural): math 48% / reading 52% proficiency, ranked #44 of 324 in MO (top 14%) — acceptable for families but not a draw, mixed tenant base, ~2y average lease.
- Market conditions: Rents rising (+2.9%/yr); 1048 active listings in the ZIP; 14 comparable units currently listed for rent nearby; rentals lingering (median 44d on market — plan ~5-8 weeks vacancy on turnover, expect pricing pressure); 100% of comp listings sitting > 30 days — soft ceiling on asking rent; 331 units permitted in Taney County in 2024 (50 in 5+ unit buildings).
Forward outlook
- Local home prices are declining (-3.0%/yr); year-one equity from $857 of loan paydown is wiped out by about $4k of value loss. Plan a longer hold.
- Taney County population projected at +17% by 2050 — long-run rental-demand tailwind backs the buy-and-hold thesis.
Negotiation context
- It's been on market 64 days — a 6% lower offer ($117k) is reasonable based on typical stale-listing flexibility.
- 2 sale attempts with the ask held roughly flat each time — persistent listings suggest the price (not the market) is what's stuck; bring a comps-based counter.
Risks & watch-outs
- Climate carrying-cost: extreme-heat days projected 7→20/yr by 2055 (HVAC capex compounding) — expect insurance premiums to compound above CPI over the hold.
Questions for the listing agent
- It's been on market 64 days. Have you received any prior offers? Is the seller open to a 8% concession, seller financing, or rate buy-down credit?
- Why hasn't it sold? Are there any deal-killer items the seller is aware of (foundation, flood, title, zoning, code violations)?
- Is there a deadline driving the sale (1031 exchange, divorce, estate, relocation)? That informs how much negotiation room exists.
- Crime grade is F in this area — have there been break-ins, vandalism, or insurance claims at this property in the last 3 years? What carrier currently insures it and at what premium?
- What's the average days-on-market for RENTAL listings here right now (not sales)? A rising rental-DOM trend means longer vacancies and softer asking-rent achievability than the comps imply.
- What's the recent tenant-quality profile in this submarket — average credit score on applications, eviction rate, late-payment / NSF rate, and stable-employment percentage? A property-management company in the area should have these aggregated.
- How much new for-sale + rental construction is in the pipeline within 1–3 miles? Heavy new supply typically softens prices + rents 12–24 months out; constrained supply supports both.
Investment metrics
- 1% rule
- 0.92% ✗
- Cap rate
- 6.75%
- Cash-on-cash
- 1.62%
- DSCR
- 1.07
- GRM
- 9.0
CMA / ARV
- ARV (median comp)
- $137,500
- List price
- $123,999
- Delta
- -9.82%
- Verdict
- FAIR
- Comps
- 1 within 2.0 mi
Show comp detail 2 sales within ~0.75 mi
| Address | Dist | Beds/Ba | Sqft | Sold | Price | $/sf | Match |
|---|---|---|---|---|---|---|---|
| 465 Royalty Ln | 0.61mi | 2/2.0 | 1,040 (+7%) | 16mo | $160,000 | $154 | 43 |
| 418 Monarch Dr | 0.66mi | 2/2.0 | 853 (-13%) | 13mo | $155,000 | $182 | 34 |
Match score weights: distance 35% · size 25% · config 20% · recency 20%. Top-matched comps best support the ARV.
Projected returns pro-forma
-3.0% appreciation · 2.9% rent growth · sell at horizon
- IRR
- -13.8%
- Equity multiple
- 0.50×
- Total profit
- $-17,214
- Equity at exit
- $18,489
- IRR
- -5.1%
- Equity multiple
- 0.67×
- Total profit
- $-11,558
- Equity at exit
- $10,721
Cash invested: $34,720 (down + closing). Projections, not guarantees.
Landlord ↔ Tenant lean methodology
- Overall (STATE)
- 81 Strongly Landlord-Friendly
- State Missouri
- 81 Strongly Landlord-Friendly · R+10
- County
- — inherits STATE
- City
- — inherits STATE
ZIP-level market 65616
- Home prices YoY
- -24.3%
- Rents YoY
- 2.9%
- Active inventory
- 1048
- Price-to-rent
- 9.0×
Monthly cashflow live
- Estimated rent
- $1,144 high interval (Pro) →
- Mortgage (P&I)
- −$650
- Tax est. 1.5%
- −$155 /mo · $1,860/yr
- Insurance
- −$52
- HOA
- −$0
- Vacancy / Maint / Mgmt
- −$240
- Net cashflow
- $47
Break-even live
UW: 25.0% down · 7.5% · 30yr · 1.5% tax · 5.0% vac · 8.0% maint · 8.0% mgmt
Financing live
Cash to close
- Down payment
- $31,000
- Closing costs
- $3,720
- Reserves months
- —
- Total cash needed
- —
Loan-product check · same deal, 3 products live
Conventional
25% down · 7.5% · 30yr
- Down + closing
- —
- Monthly P&I
- —
- Monthly cashflow
- —
- DSCR
- —
- Eligible?
- —
Personal DTI + credit; lowest rate.
DSCR
20% down · 8.5% · 30yr
- Down + closing
- —
- Monthly P&I
- —
- Monthly cashflow
- —
- DSCR
- —
- Eligible?
- —
No personal income docs; deal must DSCR.
Hard money
10% down · 12.0% · 12mo
- Down + closing
- —
- Monthly P&I
- —
- Monthly cashflow
- —
- DSCR
- —
- Eligible?
- —
Short-term bridge; refi at stabilization.
Rent comps 14 comps
| Address | Beds | Baths | Sqft | Rent | $/sqft | DOM | Units | Dist |
|---|---|---|---|---|---|---|---|---|
| 680 Fall Creek Dr Apt 10 Branson, MO | 2.0 | 2.0 | 750 | $1,295 | $1.73 | 43d | 1 | 0.63mi |
| 540 Abby Ln #8 Branson, MO | 2.0 | 2.0 | 1000 | $1,100 | $1.10 | 43d | 1 | 0.64mi |
| 1 Memory Ln #1 Branson, MO | 1.0 | 1.0 | 600 | $900 | $1.50 | 43d | 1 | 0.69mi |
| 1 Memory Ln #2 Branson, MO | 1.0 | 1.0 | 750 | $875 | $1.17 | 43d | 1 | 0.69mi |
| 3245 Falls Pkwy Unit 335 Branson, MO | 2.0 | 2.0 | 864 | $995 | $1.15 | 43d | 1 | 0.76mi |
| 21 Fall Creek Trl #1 Branson, MO | 1.0 | 1.0 | 619 | $800 | $1.29 | 43d | 1 | 0.81mi |
| 34 Golfshores Dr #6 Branson, MO | 2.0 | 2.0 | 1032 | $1,500 | $1.45 | 43d | 1 | 0.81mi |
| 25 Fall Creek Trl #8 Branson, MO | 2.0 | 2.0 | 859 | $900 | $1.05 | 43d | 1 | 0.83mi |
| 325 Majestic Dr Branson, MO | 1.0–3.0 | 1.0–2.0 | 941 | $1,322 | $1.41 | 43d | 2 | 1.33mi |
| 406 Judy St Unit 21 Branson, MO | 1.0 | 1.0 | 650 | $745 | $1.15 | 43d | 1 | 1.45mi |
| 400 Judy St Branson, MO | 2.0 | 1.0 | 900 | $900 | $1.00 | 43d | 1 | 1.49mi |
| 400 Judy St #05 Branson, MO | 2.0 | 1.0 | 900 | $800 | $0.89 | 43d | 1 | 1.49mi |
| 750 Windsor Ct Unit GQ 106 Branson, MO | 1.0 | 1.0 | 715 | $1,050 | $1.47 | 43d | 1 | 1.50mi |
| 750 Windsor Ct Apt 206 Branson, MO | 1.0 | 1.0 | 715 | $1,195 | $1.67 | 43d | 1 | 1.50mi |
Listing history 18 events
-
2026-06-19days on market $123,999 Active 64 DOM
-
2026-06-18days on market $123,999 Active 63 DOM
-
2026-06-17days on market $123,999 Active 62 DOM
-
2026-06-16days on market $123,999 Active 61 DOM
-
2026-06-15days on market $123,999 Active 60 DOM
-
2026-06-14days on market $123,999 Active 58 DOM
-
2026-06-12days on market $123,999 Active 57 DOM
-
2026-06-09days on market $123,999 Active 54 DOM
-
2026-06-08days on market $123,999 Active 53 DOM
-
2026-06-07days on market $123,999 Active 52 DOM
-
2026-06-03days on market $123,999 Active 48 DOM
-
2026-06-02days on market $123,999 Active 47 DOM
-
2026-06-01days on market $123,999 Active 46 DOM
-
2026-05-31days on market $123,999 Active 45 DOM
-
2026-05-30days on market $123,999 Active 44 DOM
-
2026-04-16$123,999 Active 635-char remark
Show marketing remark (635 chars)
Tucked into a quiet back corner of the neighborhood, 192 Aster Circle offers a comfortable 2-bedroom, 1-bath setup with a surprising amount of privacy and parking. The standout feature is the large front deck -- a great spot to unwind or host friends. You're just minutes from Lake Taneycomo, Table Rock Lake, the Branson Strip, plus all the shopping, dining, and entertainment the area is known for. It's the kind of location that keeps you close to everything while still feeling tucked away. Whether you're after a primary home, a weekend escape, or a solid long-term investment, this one checks a lot of boxes. YES LAND IS INCLUDED
-
2025-11-06price $134,000
-
2025-10-23$139,000 Active
ⓘ Source: listings_history table (triggers on properties + properties_extension) + one-shot
backfill from property_details.listing_events for pre-trigger history.
Climate risk First Street
- Flood 1/10 Low FEMA zone X (unshaded) · 0% chance over 30 yrs
- Wildfire 3/10 Moderate
- Heat 5/10 Major 7 d/yr ≥106°F today · 20 d/yr by 30 yrs out
- Wind 2/10 Low 100% chance of damaging wind over 30 yrs
- Air quality 2/10 Low 0 unhealthy d/yr today · 1 by 30 yrs out
Nearby sold comps map
Loading sold comps map…
Walkable amenities ~0.75 mi
Loading nearby amenities…
Taxation est. · year 1
- Rental income
- $13,727
- − Mortgage interest
- −$6,946
- − Property taxes
- −$1,860
- − Insurance
- −$620
- − Repairs & maintenance
- −$1,098
- − Management
- −$1,098
- − Depreciation
- −$3,607
- Taxable loss
- −$1,503
- Est. tax savings @ 24.0%
- +$361
- After-tax cash flow
- $921/yr
For passive investors: Depreciation is non-cash, so a rental often shows a tax loss while cash-flowing — sheltering income. Rental losses are passive: they offset passive income freely, and up to $25,000/yr can offset ordinary (W-2) income if you actively participate and your MAGI is under $100k (phasing out to $0 by $150k); unused losses carry forward. On sale, claimed depreciation is recaptured at up to 25%, and gains may owe capital-gains tax (a 1031 exchange can defer both). Figures are a year-1 estimate at your 24.0% rate — not tax advice; consult a CPA.
Condition & rehab AI · 12 photos
This 2-bedroom, 1-bath home in Branson, MO is in good condition with a fresh exterior and interior. It offers a large front deck and is located in a quiet neighborhood with easy access to local attractions. The property is move-in ready and would benefit from some landscaping and outdoor lighting to further enhance its curb appeal and rental value.
Value-add opportunities
- Both Landscaping — Enhances curb appeal and privacy
- Both Add outdoor lighting — Improves safety and curb appeal
Renovation cost estimate screening
Value-add ROI direction
- Both Landscaping — Enhances curb appeal and privacy ↑
- Both Add outdoor lighting — Improves safety and curb appeal ↑
ⓘ Cost ranges are severity-bucket heuristics (US national rule-of-thumb). Get contractor quotes + a written scope before underwriting a rehab budget.
Schools (NCES district)
- District
- Branson R-IV
- NCES district ID
- 2905760
- Math proficiency
- 48% ▼ -6.00%
- Reading proficiency
- 52% ▼ -3.00%
- Median HH income
- $41,473
- Composite
- 41.96/100
- National rank
- #3347
- State rank
- #44 of 324 in MO
Livability — Branson
- Score
- 77/100
- State rank
- #32
- US rank
- #2940
Category grades
Schools grade is shown separately in the Schools card above.
Census & demographics
- County
- Taney County · 28,460 people
- City population
- 28,460
- Metro
- Branson, MO
- Population (ZIP)
- 28,460
- Household income
- $60,489
- Rent vs Own
- Severe rent burden
- 1065.0
Population outlook (Taney County) Hauer SSP2
- Today (2025)
- 59,017 people
- By 2030
- 61,235 · +3.8%
- By 2040
- 65,225 · +10.5%
- By 2050
- 68,842 · +16.6%
- By 2075
- 77,705 · +31.7%
- By 2100
- 82,002 · +38.9%
Race, ethnicity, and origin ACS 2023
- Neighborhood character
- Predominantly White (82%)
- Race & ethnicity
- White 82% Two or more races 10% Hispanic / Latino 10% Black 2% Asian 2%
- Hispanic origin (detail)
- Mexican 6% Puerto Rican 2%
- Common ancestry
- Italian 4% Lithuanian 3% Slovak 2%
- Foreign-born
- 5% · Canada
- Languages at home
- 89% English-only · Spanish 7% Other Indo-European 1% Russian/Polish/Slavic 1%
Political lean MEDSL · Taney
- 2024 margin
- Solid R (+59.3) · D 19.9% · R 79.2%
- 2008→2024 swing
- -22.2pp toward R · 2008: -37.2pp · 2024: -59.3pp
- All cycles
- 2024: R+59.3 2020: R+57.7 2016: R+59.3 2012: R+47.4 2008: R+37.2
Not yet ingested
- Civics
- —
Market trends
- HPI YoY
- ▼ -64.45%
- Current HPI
- 200.8392
- Rent YoY
- ▲ 2.90%
- Metro
- Branson, MO
- State GDP YoY
- ▲ 1.84%
- F500 in state
- 20
Industry mix (Fortune 500 HQ in MO)
| Industry | F500 HQs | Revenue |
|---|---|---|
| Healthcare | 1 | $163B |
|
||
| Insurance | 1 | $21B |
|
||
| Industrial Technology | 1 | $17B |
|
||
| Retail | 1 | $16B |
|
||
| Industrial Distribution | 1 | $10B |
|
||
| Utilities | 1 | $9B |
|
||
Price history
-10.8% since first listed3 events — show timeline
- 2026-04-16 Listed $123,999 SOMO
- 2025-11-06 Price Changed $134,000 SOMO
- 2025-10-23 Listed $139,000 SOMO
Cash-flow waterfall
monthlySold comps — $/sqft
last 12 mo · ≤1 miLoading sold comps…