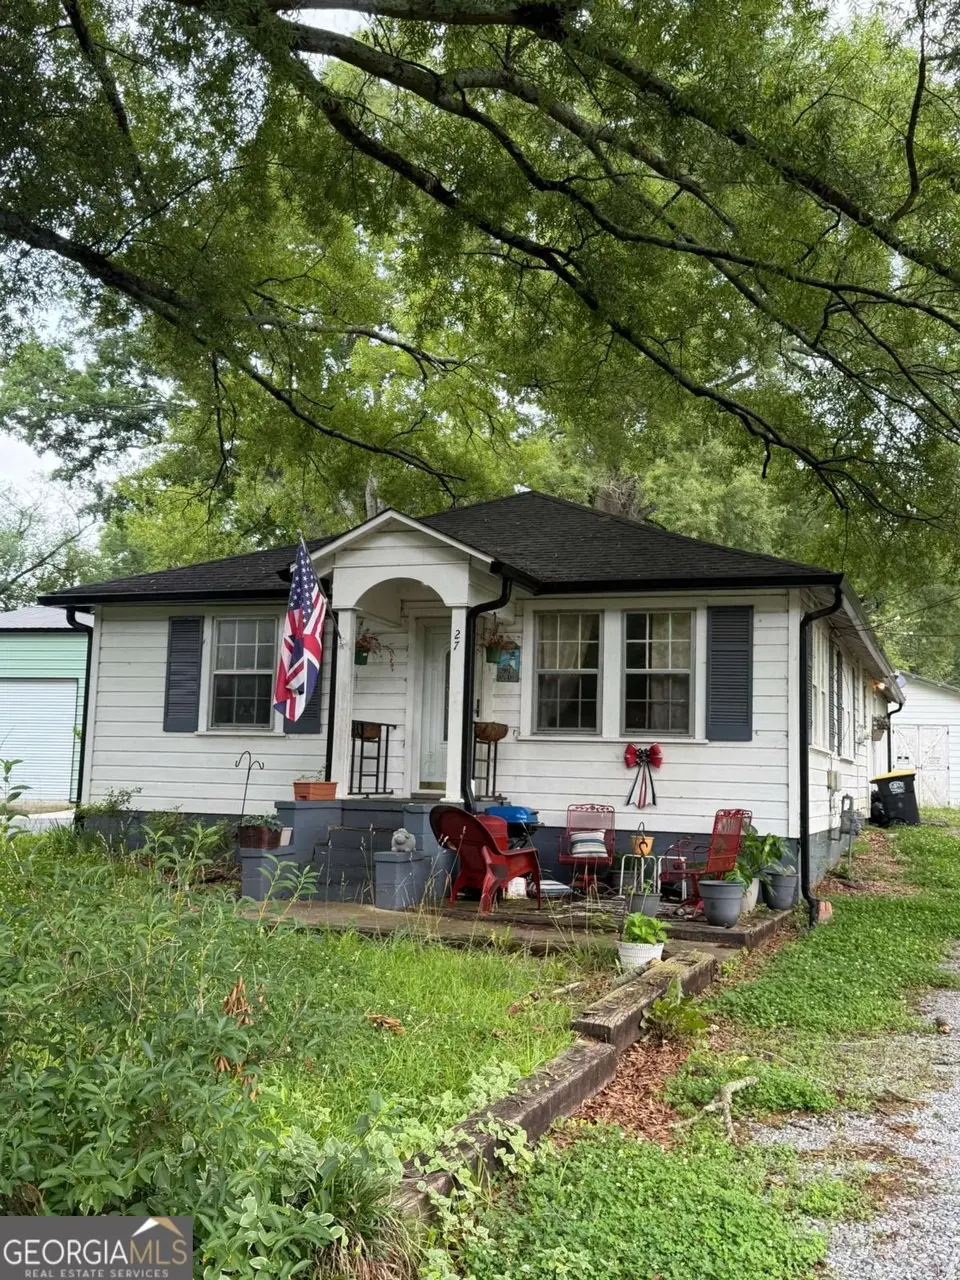
27 Willingham St SW · Rome, GA
Flood risk 1/10 · Minimal
- FEMA flood zone
- X (unshaded)
- Chance of flooding over 30 yrs
- 0.0%
- Est. flood insurance / yr
- $507 – $1,088
Fire risk 3/10 · Minor
- Est. fire insurance / yr
- $963 – $1,789
Heat risk 6/10 · Moderate
- Hot days now (above 104°F)
- 7 days/yr
- Hot days in 30 yrs
- 19 days/yr
Wind risk 4/10 · Minor
- Chance of severe wind over 30 yrs
- 18.0%
Air-quality risk 2/10 · Minimal
- Unhealthy air days now
- 2 days/yr
- Unhealthy air days in 30 yrs
- 2 days/yr
Risk factors via First Street. Map © Google.
Why this score? — see what drove the B- grade
The composite is a weighted blend of 9 inputs, each scored 0–100. Each bar is that input's sub-score; the figure is the points it added to the 100-point composite (weight × sub-score).
- Cash flow +26.1/30.0
- ARV discount +14.7/15.0
- DSCR +8.8/10.0
- 1% rule +6.1/10.0
- Rent growth +4.1/5.0
- Livability +3.2/5.0
- Condition / age +2.5/5.0
- Schools +2.3/10.0
- Appreciation +0.0/10.0
$179,900
🖨 Deal sheet 📄 Offer letter ✓ Due diligence
Listing remarks MLS
Currently rented at $1,350/month, this 4-bedroom, 2-bath home features central HVAC, a detached 2-car garage, and a crawlspace. Perfect opportunity for investors or buyers seeking an income-producing property in Rome.
Key facts
- Central hvac
- Detached garage
- 8,712 sq ft lot
Tags
Property features AI
Exterior
- Parking: Garage with 2 parking spaces
- Utilities: Electricity available; Other water source; Other sewer; Other electric details
- Home design: One level; Resale condition
- Construction: Block foundation; Other construction materials; Other roof type; Crawl space basement
- Exterior features: Other exterior features; Other structures
Interior
- Kitchen: Other kitchen features; Appliances: Other
- Bedrooms: Four main-level bedrooms; Other bedroom features
- Flooring: Hardwood floors
- Bathrooms: Two full bathrooms (both on main level); Master bath with other features
- Heating & cooling: Other heating; Other cooling
- Interior features: No common walls; Other interior features
- Laundry & utility: Laundry features: Other
Neighborhood map
What this means for you Summary
Snapshot
- This is a 4-bed/1.0-bath single-family listed at $180k.
Deal economics
- At list price, monthly cash flow is $452 ($5k/yr) — positive.
- The deal already cash-flows at list — no discount required.
- Meets the 1% rule at list price ($2k rent vs $180k).
- Recommended offer: $177k (1.5% below list) — sets the bar for market timing.
- Cap rate 9.3% vs local median 3.3% in Rome — top-decile yield for the area; either an underpriced asset or a hidden risk that comps aren't pricing in. Stress-test before assuming the spread holds.
Location & tenants
- Location reads 64/100 on livability (#266 in GA) — a middle-class / working-renter tenant base. Strengths: cost of living A+, housing A+, health & safety A+; Watch: crime F, amenities F, commute F.
- Rome City (urban): math 27% / reading 29% proficiency, ranked #112 of 174 in GA (top 64%) — low school quality limits family demand, transient renter base, plan for 1-2y turnover; 71% free/reduced lunch — lower-income household profile, screen leases tightly.
- Zoned schools: Anna K. Davie Elementary (math 2% / reading 8%, grade F, #1,160 of 1,228 statewide, top 98%, 434 students, 94% FRL); Rome Middle School (math 32% / reading 35%, grade F, #206 of 470 statewide, top 45%, 966 students, 55% FRL); Rome High School (math 12% / reading 15%, grade F, #325 of 424 statewide, top 78%, 2,095 students, 66% FRL) — zoned schools at 72% FRL track the district average.
- Market conditions: Rents rising fast (+6.3%/yr); 411 active listings in the ZIP; 5 comparable units currently listed for rent nearby; rentals lingering (median 44d on market — plan ~5-8 weeks vacancy on turnover, expect pricing pressure); 80% of comp listings sitting > 30 days — soft ceiling on asking rent; 355 units permitted in Floyd County in 2024 (0 in 5+ unit buildings).
Forward outlook
- Local home prices are declining (-3.0%/yr); year-one equity from $1k of loan paydown is wiped out by about $5k of value loss. Plan a longer hold.
- Floyd County population projected to shrink 6% by 2050 — rents likely to lag national; underwrite the cash flow, not the appreciation.
- At projected returns (-3.0% appreciation + 6.3% rent growth), your $50k cash investment doubles in ~8 years — after that, you're playing with house money.
Negotiation context
- It's been on market 17 days — a 2% lower offer ($177k) is reasonable based on typical stale-listing flexibility.
- 2 sale attempts with the ask held roughly flat each time — persistent listings suggest the price (not the market) is what's stuck; bring a comps-based counter.
- Current owner paid $62k; list at $180k implies a 188% gain — meaningful room to come down on a strong offer.
Risks & watch-outs
- Watch-outs: built in 1950 — expect roof / HVAC / electrical / plumbing capex.
- Climate carrying-cost: extreme-heat days projected 7→19/yr by 2055 (HVAC capex compounding) — expect insurance premiums to compound above CPI over the hold.
Questions for the listing agent
- Built in 1950 — when were the roof, HVAC, electrical panel, plumbing, and water heater last replaced?
- Is there a deadline driving the sale (1031 exchange, divorce, estate, relocation)? That informs how much negotiation room exists.
- Schools are F-rated, which usually means shorter tenancies and higher turnover. Who's the typical renter profile here, and what's been the actual vacancy rate?
- Crime grade is F in this area — have there been break-ins, vandalism, or insurance claims at this property in the last 3 years? What carrier currently insures it and at what premium?
- What's the average days-on-market for RENTAL listings here right now (not sales)? A rising rental-DOM trend means longer vacancies and softer asking-rent achievability than the comps imply.
- What's the recent tenant-quality profile in this submarket — average credit score on applications, eviction rate, late-payment / NSF rate, and stable-employment percentage? A property-management company in the area should have these aggregated.
- How much new for-sale + rental construction is in the pipeline within 1–3 miles? Heavy new supply typically softens prices + rents 12–24 months out; constrained supply supports both.
Investment metrics
- 1% rule
- 1.11% ✓
- Cap rate
- 9.31%
- Cash-on-cash
- 10.78%
- DSCR
- 1.48
- GRM
- 7.5
CMA / ARV
- ARV (on-the-fly)
- $214,176
- Comps found
- 12
Show comp detail 12 sales within ~0.75 mi
| Address | Dist | Beds/Ba | Sqft | Sold | Price | $/sf | Match |
|---|---|---|---|---|---|---|---|
| 2107 Maple Ave | 0.12mi | 5/2.0 (+1) | 1,520 (-2%) | 11mo | $210,000 | $138 | 73 |
| 12 Azalea St SE | 0.50mi | 4/1.5 | 1,539 (-1%) | 15mo | $250,000 | $162 | 61 |
| 1908 Flannery St SW | 0.28mi | 3/2.0 (-1) | 1,612 (+4%) | 13mo | $230,000 | $143 | 61 |
| 415 E 20th St SW | 0.25mi | 4/2.0 | 1,632 (+5%) | 21mo | $225,900 | $138 | 58 |
| 2001 Flannery St SW | 0.23mi | 3/2.0 (-1) | 1,611 (+4%) | 21mo | $146,000 | $91 | 57 |
| 1901 Hull Ave SW | 0.48mi | 3/2.5 (-1) | 1,444 (-7%) | 3mo | $200,000 | $139 | 52 |
| 407 E 19th St SW | 0.35mi | 3/2.5 (-1) | 1,355 (-13%) | 1mo | $180,000 | $133 | 51 |
| 308 E 20th St SW | 0.29mi | 3/1.0 (-1) | 1,360 (-12%) | 12mo | $84,900 | $62 | 51 |
| 211 Alfred Ave SE | 0.71mi | 3/2.0 (-1) | 1,412 (-9%) | 5mo | $220,000 | $156 | 39 |
| 109 E 15th St SW | 0.67mi | 3/1.0 (-1) | 1,422 (-8%) | 17mo | $155,000 | $109 | 36 |
| 2703 Maple Rd | 0.75mi | 3/2.0 (-1) | 1,677 (+8%) | 16mo | $212,000 | $126 | 29 |
| 1403 Flannery St SW | 0.69mi | 3/2.0 (-1) | 1,348 (-13%) | 20mo | $185,000 | $137 | 20 |
Match score weights: distance 35% · size 25% · config 20% · recency 20%. Top-matched comps best support the ARV.
Projected returns pro-forma
-3.0% appreciation · 6.28% rent growth · sell at horizon
- IRR
- 3.2%
- Equity multiple
- 1.13×
- Total profit
- $6,448
- Equity at exit
- $26,824
- IRR
- 15.5%
- Equity multiple
- 2.44×
- Total profit
- $72,524
- Equity at exit
- $15,554
Cash invested: $50,372 (down + closing). Projections, not guarantees.
Landlord ↔ Tenant lean methodology
- Overall (STATE)
- 90 Strongly Landlord-Friendly
- State Georgia
- 90 Strongly Landlord-Friendly · R+3
- County
- — inherits STATE
- City
- — inherits STATE
ZIP-level market 30161
- Rents YoY
- 6.3%
- Active inventory
- 411
- Price-to-rent
- 7.5×
Monthly cashflow live
- Estimated rent
- $2,003 high interval (Pro) →
- Mortgage (P&I)
- −$943
- Tax from tax record
- −$112 /mo · $1,339/yr
- Insurance
- −$75
- HOA
- −$0
- Vacancy / Maint / Mgmt
- −$421
- Net cashflow
- $452
Break-even live
UW: 25.0% down · 7.5% · 30yr · 1.5% tax · 5.0% vac · 8.0% maint · 8.0% mgmt
Financing live
Cash to close
- Down payment
- $44,975
- Closing costs
- $5,397
- Reserves months
- —
- Total cash needed
- —
Loan-product check · same deal, 3 products live
Conventional
25% down · 7.5% · 30yr
- Down + closing
- —
- Monthly P&I
- —
- Monthly cashflow
- —
- DSCR
- —
- Eligible?
- —
Personal DTI + credit; lowest rate.
DSCR
20% down · 8.5% · 30yr
- Down + closing
- —
- Monthly P&I
- —
- Monthly cashflow
- —
- DSCR
- —
- Eligible?
- —
No personal income docs; deal must DSCR.
Hard money
10% down · 12.0% · 12mo
- Down + closing
- —
- Monthly P&I
- —
- Monthly cashflow
- —
- DSCR
- —
- Eligible?
- —
Short-term bridge; refi at stabilization.
Rent comps 5 comps
| Address | Beds | Baths | Sqft | Rent | $/sqft | DOM | Units | Dist |
|---|---|---|---|---|---|---|---|---|
| 93 Chateau Dr SE Rome, GA | 4.0 | 3.0 | 1911 | $2,400 | $1.26 | 43d | 1 | 0.69mi |
| 77 Chateau Dr SE Rome, GA | 4.0 | 3.0 | 1911 | $2,400 | $1.26 | 43d | 1 | 0.76mi |
| 50 Chateau Dr SE Rome, GA | 2.0–3.0 | 1.5–2.0 | 1255 | $1,599 | $1.27 | 2d | 4 | 0.76mi |
| 109 Chateau Dr SE Rome, GA | 4.0 | 3.0 | 1911 | $2,400 | $1.26 | 43d | 1 | 0.87mi |
| 331 S McLin St SW Rome, GA | 3.0 | 1.0 | 1108 | $1,250 | $1.13 | 43d | 1 | 0.93mi |
Listing history 14 events
-
2026-06-19days on market $179,900 Active 17 DOM
-
2026-06-18days on market $179,900 Active 16 DOM
-
2026-06-17days on market $179,900 Active 15 DOM
-
2026-06-16days on market $179,900 Active 14 DOM
-
2026-06-15days on market $179,900 Active 13 DOM
-
2026-06-14days on market $179,900 Active 11 DOM
-
2026-06-13days on market $179,900 Active 10 DOM
-
2026-06-10days on market $179,900 Active 8 DOM
-
2026-06-09days on market $179,900 Active 7 DOM
-
2026-06-08days on market $179,900 Active 6 DOM
-
2026-06-07days on market $179,900 Active 5 DOM
-
2026-06-05days on market $179,900 Active 2 DOM
-
2026-06-03remarks 217-char remark
-
2026-06-03$179,900 Active 1 DOM
ⓘ Source: listings_history table (triggers on properties + properties_extension) + one-shot
backfill from property_details.listing_events for pre-trigger history.
Tax reassessment forecast GA · Resets to sale price
- Current annual tax
- $1,339 · $112/mo
- Projected year-2 tax
- $1,655 · $138/mo
- Expected delta
- +$317/yr (+$26/mo · 23.7%)
ⓘ Screening estimate from a state-policy table — verify with the county assessor before closing.
Climate risk First Street
- Flood 1/10 Low FEMA zone X (unshaded) · 0% chance over 30 yrs
- Wildfire 3/10 Moderate
- Heat 6/10 Major 7 d/yr ≥104°F today · 19 d/yr by 30 yrs out
- Wind 4/10 Moderate 18% chance of damaging wind over 30 yrs
- Air quality 2/10 Low 2 unhealthy d/yr today · 2 by 30 yrs out
Nearby sold comps map
Loading sold comps map…
Walkable amenities ~0.75 mi
Loading nearby amenities…
Taxation est. · year 1
- Rental income
- $24,035
- − Mortgage interest
- −$10,077
- − Property taxes
- −$1,339
- − Insurance
- −$900
- − Repairs & maintenance
- −$1,923
- − Management
- −$1,923
- − Depreciation
- −$5,233
- Taxable income
- $2,640
- Est. tax owed @ 24.0%
- −$634
- After-tax cash flow
- $4,795/yr
For passive investors: Depreciation is non-cash, so a rental often shows a tax loss while cash-flowing — sheltering income. Rental losses are passive: they offset passive income freely, and up to $25,000/yr can offset ordinary (W-2) income if you actively participate and your MAGI is under $100k (phasing out to $0 by $150k); unused losses carry forward. On sale, claimed depreciation is recaptured at up to 25%, and gains may owe capital-gains tax (a 1031 exchange can defer both). Figures are a year-1 estimate at your 24.0% rate — not tax advice; consult a CPA.
Schools (NCES district)
- District
- Rome City
- NCES district ID
- 1304440
- Math proficiency
- 27% ▼ -14.00%
- Reading proficiency
- 29% ▼ -4.00%
- Median HH income
- $34,889
- Composite
- 23.1/100
- National rank
- #7963
- State rank
- #112 of 174 in GA
Livability — Rome
- Score
- 64/100
- State rank
- #266
- US rank
- #14459
Category grades
Schools grade is shown separately in the Schools card above.
Census & demographics
- Census place
- Rome, GA
- County
- Floyd County · 77,706 people
- City population
- 77,706
- Metro
- Rome, GA
- Population (ZIP)
- 34,705
- Household income
- $61,667
- Rent vs Own
- Severe rent burden
- 1104.0
Population outlook (Floyd County) Hauer SSP2
- Today (2025)
- 96,321 people
- By 2030
- 95,532 · -0.8%
- By 2040
- 93,332 · -3.1%
- By 2050
- 90,850 · -5.7%
- By 2075
- 84,989 · -11.8%
- By 2100
- 76,097 · -21.0%
Race, ethnicity, and origin ACS 2023
- Neighborhood character
- Predominantly White (68%)
- Race & ethnicity
- White 68% Black 20% Hispanic / Latino 7% Two or more races 6% Asian 1%
- Hispanic origin (detail)
- Mexican 2%
- Common ancestry
- Slovak 3% Serbian 2% Italian 2%
- Foreign-born
- 5% · Canada
- Languages at home
- 91% English-only · Spanish 5% Other Indo-European 1%
Political lean MEDSL · Floyd
- 2024 margin
- Solid R (+42.0) · D 28.8% · R 70.7%
- 2008→2024 swing
- -5.6pp toward R · 2008: -36.4pp · 2024: -42.0pp
- All cycles
- 2024: R+42.0 2020: R+41.1 2016: R+43.5 2012: R+39.9 2008: R+36.4
Not yet ingested
- Civics
- —
Market trends
- HPI YoY
- ▼ -186.06%
- Current HPI
- 257.8168
- Rent YoY
- ▲ 6.28%
- Metro
- Rome, GA
- State GDP YoY
- ▲ 2.66%
- F500 in state
- 28
Industry mix (Fortune 500 HQ in GA)
| Industry | F500 HQs | Revenue |
|---|---|---|
| Paper / Packaging | 2 | $29B |
|
||
| Retail | 1 | $160B |
|
||
| Transportation / Logistics | 1 | $91B |
|
||
| Airlines | 1 | $62B |
|
||
| Consumer Goods | 1 | $47B |
|
||
| Utilities | 1 | $25B |
|
||
Price history
+187.8% since first listed3 events — show timeline
- 2026-06-02 Listed $179,900 GAMLS
- 2026-06-02 Listed $179,900 FMLS
- 2021-07-15 Sold (Public Records) $62,500 Public Records
Property tax history
+8.0%/yrLatest (2025): $1,339 · +10.2% YoY. Source: county tax records.
Cash-flow waterfall
monthlySold comps — $/sqft
last 12 mo · ≤1 miLoading sold comps…