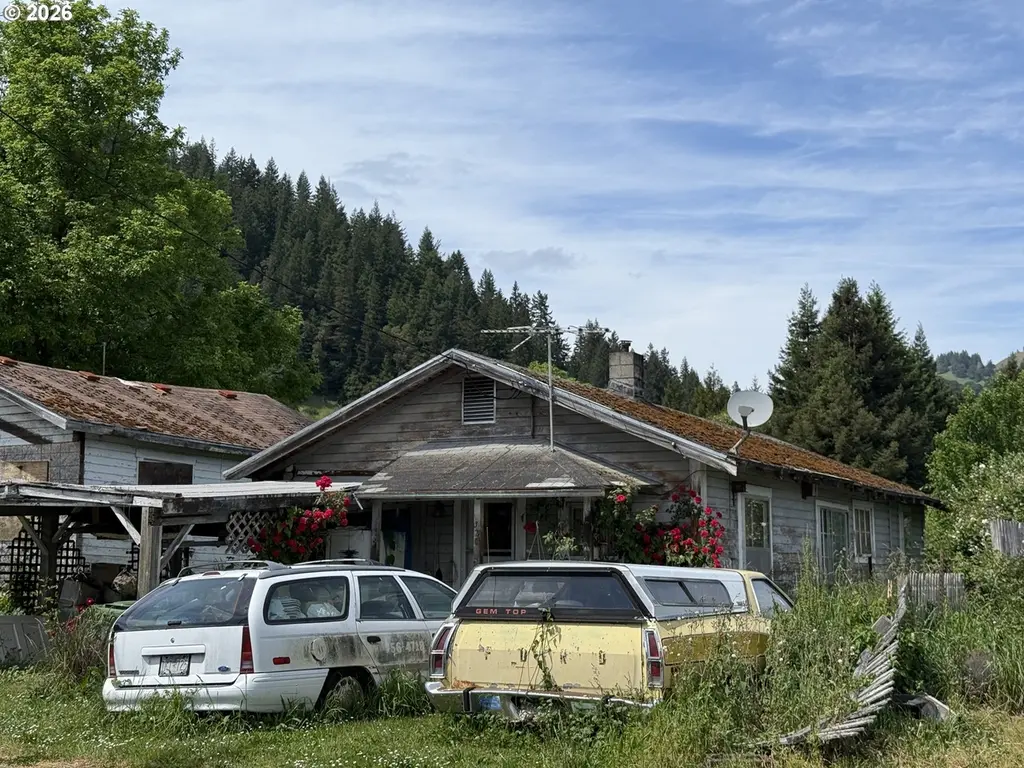
320 W Cedar St · Powers, OR
Flood risk 1/10 · Minimal
- FEMA flood zone
- X (unshaded)
- Chance of flooding over 30 yrs
- 0.0%
- Est. flood insurance / yr
- $507 – $1,088
Fire risk 4/10 · Minor
- Est. fire insurance / yr
- $498 – $926
Heat risk 3/10 · Minor
- Hot days now (above 86°F)
- 9 days/yr
- Hot days in 30 yrs
- 22 days/yr
Wind risk 1/10 · Minimal
- Chance of severe wind over 30 yrs
- —
Air-quality risk 6/10 · Moderate
- Unhealthy air days now
- 7 days/yr
- Unhealthy air days in 30 yrs
- 8 days/yr
Risk factors via First Street. Map © Google.
Why this score? — see what drove the B grade
The composite is a weighted blend of 9 inputs, each scored 0–100. Each bar is that input's sub-score; the figure is the points it added to the 100-point composite (weight × sub-score).
- Cash flow +30.0/30.0
- 1% rule +10.0/10.0
- DSCR +10.0/10.0
- ARV discount +7.5/15.0
- Appreciation +5.0/10.0
- Livability +3.1/5.0
- Rent growth +2.5/5.0
- Condition / age +2.5/5.0
- Schools +2.2/10.0
$33,000
🖨 Deal sheet (PDF) 📄 Offer letter ✓ Due diligence
Listing remarks
CASH ONLY! Great investment opportunity. Seller unable to remove personal property. Good size lot located in the beautiful community of Powers. House is AS IS with personal property. OWNER to do no repairs. BUYER to accept all personal property and property conditions.
Key facts
- 5,662 sq ft lot
- Built 1914
- Listed 4 days
Property features AI
Finance
- Other: Main level area: 720; Lot size approximately 0.13 acre (5,000–6,999 sq ft)
- Financial info: Land lease: No
- HOA & community: Not a senior community; Zoned R
Exterior
- Parking: Carport; Driveway
- Security: No security features
- Utilities: Public water; Public sewer; Electric service; Internet: DSL and Satellite
- Home design: Single-family residence; Detached; Fixer condition; Built in 1914; Main entry on main level
- Construction: Wood siding; Composition roof; Other roof material; 1914 construction
- Exterior features: Yard; Level lot; Paved road access; Territorial view
Interior
- Kitchen: Free-standing range; Free-standing refrigerator
- Bedrooms: Primary bedroom on main level; Second bedroom on main level
- Flooring: Vinyl flooring; Wall-to-wall carpet
- Bathrooms: 1 full bathroom (main level)
- Heating & cooling: Pellet stove heating; No central heating; No cooling system
- Interior features: Ceiling fan(s); Furnished; Laundry area; Washer and dryer included; Vinyl flooring; Wall-to-wall carpet; Pellet stove fireplace; Wood window frames
- Laundry & utility: Washer and dryer included; Electric hot water
Neighborhood map
What this means for you Summary
Snapshot
- This is a 2-bed/1.0-bath single-family listed at $33k.
Deal economics
- At list price, monthly cash flow is $467 ($6k/yr) — positive.
- The deal already cash-flows at list — no discount required.
- Meets the 1% rule at list price ($870 rent vs $33k).
Location & tenants
- Location reads 61/100 on livability (#274 in OR) — a middle-class / working-renter tenant base. Strengths: cost of living A+; Watch: health & safety C-, crime F, amenities F.
- Powers SD 31 (rural): math 20% / reading 25% proficiency, ranked #178 of 183 in OR (top 97%) — low school quality limits family demand, transient renter base, plan for 1-2y turnover.
- Zoned schools: Powers Elementary School (math 24% / reading 30%, grade F, #288 of 412 statewide, top 73%, 61 students, 75% FRL); Powers High School (math 10% / reading 10%, grade F, #141 of 143 statewide, top 99%, 66 students, 67% FRL).
- Market conditions: 20 active listings in the ZIP; 122 units permitted in Coos County in 2024 (16 in 5+ unit buildings).
Forward outlook
- In year one you build about $1k of equity ($228 loan paydown + $990 appreciation (3.0% local appreciation)).
- Coos County population projected to shrink 9% by 2050 — rents likely to lag national; underwrite the cash flow, not the appreciation.
- At projected returns (3.0% appreciation + 3.0% rent growth), your $9k cash investment doubles in ~2 years — after that, you're playing with house money.
Negotiation context
- Only 4 days on market — expect competitive offers; lowballing is unlikely to land.
Risks & watch-outs
- Watch-outs: built in 1914 — expect roof / HVAC / electrical / plumbing capex.
Questions for the listing agent
- Built in 1914 — when were the roof, HVAC, electrical panel, plumbing, and water heater last replaced?
- Is there a deadline driving the sale (1031 exchange, divorce, estate, relocation)? That informs how much negotiation room exists.
- Schools are F-rated, which usually means shorter tenancies and higher turnover. Who's the typical renter profile here, and what's been the actual vacancy rate?
- Crime grade is F in this area — have there been break-ins, vandalism, or insurance claims at this property in the last 3 years? What carrier currently insures it and at what premium?
- What's the average days-on-market for RENTAL listings here right now (not sales)? A rising rental-DOM trend means longer vacancies and softer asking-rent achievability than the comps imply.
- What's the recent tenant-quality profile in this submarket — average credit score on applications, eviction rate, late-payment / NSF rate, and stable-employment percentage? A property-management company in the area should have these aggregated.
- How much new for-sale + rental construction is in the pipeline within 1–3 miles? Heavy new supply typically softens prices + rents 12–24 months out; constrained supply supports both.
Investment metrics
- 1% rule
- 2.64% ✓
- Cap rate
- 23.27%
- Cash-on-cash
- 60.63%
- DSCR
- 3.70
- GRM
- 3.2
CMA / ARV
- ARV (median comp)
- $157,317
- List price
- $33,000
- Delta
- -79.02%
- Verdict
- UNDERPRICED
- Comps
- 8 within 1.0 mi
Show comp detail 1 sale within ~0.75 mi
| Address | Dist | Beds/Ba | Sqft | Sold | Price | $/sf | Match |
|---|---|---|---|---|---|---|---|
| 160 E Date St | 0.29mi | 1/1.0 (-1) | 720 (0%) | 22mo | $169,500 | $235 | 64 |
Match score weights: distance 35% · size 25% · config 20% · recency 20%. Top-matched comps best support the ARV.
Projected returns pro-forma
3.0% appreciation · 3.0% rent growth · sell at horizon
- IRR
- 65.5%
- Equity multiple
- 4.65×
- Total profit
- $33,716
- Equity at exit
- $14,838
- IRR
- 65.0%
- Equity multiple
- 9.48×
- Total profit
- $78,373
- Equity at exit
- $22,867
Cash invested: $9,240 (down + closing). Projections, not guarantees.
Landlord ↔ Tenant lean methodology
- Overall (STATE)
- 28 Tenant-Leaning
- State Oregon
- 28 Tenant-Leaning · D+6
- County
- — inherits STATE
- City
- — inherits STATE
ZIP-level market 97466
- Active inventory
- 20
- Price-to-rent
- 3.2×
Monthly cashflow live
- Estimated rent
- $870 medium interval (Pro) →
- Mortgage (P&I)
- −$173
- Tax from tax record
- −$33 /mo · $400/yr
- Insurance
- −$14
- HOA
- −$0
- Vacancy / Maint / Mgmt
- −$183
- Net cashflow
- $467
Break-even live
Sensitivity live
| Price | -10% $486 | -5% $476 | +0% $467 | +5% $457 | +10% $448 |
|---|---|---|---|---|---|
| Rent | -10% $398 | -5% $432 | +0% $467 | +5% $501 | +10% $536 |
| Rate | -1.0pp $483 | -0.5pp $475 | base $467 | +0.5pp $458 | +1.0pp $450 |
UW: 25.0% down · 7.5% · 30yr · 1.5% tax · 5.0% vac · 8.0% maint · 8.0% mgmt
Financing live
Cash to close
- Down payment
- $8,250
- Closing costs
- $990
- Reserves months
- —
- Total cash needed
- —
Loan-product check · same deal, 3 products live
Conventional
25% down · 7.5% · 30yr
- Down + closing
- —
- Monthly P&I
- —
- Monthly cashflow
- —
- DSCR
- —
- Eligible?
- —
Personal DTI + credit; lowest rate.
DSCR
20% down · 8.5% · 30yr
- Down + closing
- —
- Monthly P&I
- —
- Monthly cashflow
- —
- DSCR
- —
- Eligible?
- —
No personal income docs; deal must DSCR.
Hard money
10% down · 12.0% · 12mo
- Down + closing
- —
- Monthly P&I
- —
- Monthly cashflow
- —
- DSCR
- —
- Eligible?
- —
Short-term bridge; refi at stabilization.
Listing history 2 events
-
2026-05-17status Pending 269-char remark
-
2026-05-13$33,000 Active 269-char remark
ⓘ Source: listings_history table (triggers on properties + properties_extension) + one-shot
backfill from property_details.listing_events for pre-trigger history.
Tax reassessment forecast OR · Resets to sale price
- Current annual tax
- $400 · $33/mo
- Projected year-2 tax
- $400 · $33/mo
- Expected delta
- $0/yr ($0/mo · 0.0%)
ⓘ Screening estimate from a state-policy table — verify with the county assessor before closing.
Climate risk First Street
- Flood 1/10 Low FEMA zone X (unshaded) · 0% chance over 30 yrs
- Wildfire 4/10 Moderate
- Heat 3/10 Moderate 9 d/yr ≥86°F today · 22 d/yr by 30 yrs out
- Wind 1/10 Low
- Air quality 6/10 Major 7 unhealthy d/yr today · 8 by 30 yrs out
Nearby sold comps map
Loading sold comps map…
Walkable amenities ~0.75 mi
Loading nearby amenities…
Taxation est. · year 1
- Rental income
- $10,435
- − Mortgage interest
- −$1,849
- − Property taxes
- −$400
- − Insurance
- −$165
- − Repairs & maintenance
- −$835
- − Management
- −$835
- − Depreciation
- −$960
- Taxable income
- $5,392
- Est. tax owed @ 24.0%
- −$1,294
- After-tax cash flow
- $4,308/yr
For passive investors: Depreciation is non-cash, so a rental often shows a tax loss while cash-flowing — sheltering income. Rental losses are passive: they offset passive income freely, and up to $25,000/yr can offset ordinary (W-2) income if you actively participate and your MAGI is under $100k (phasing out to $0 by $150k); unused losses carry forward. On sale, claimed depreciation is recaptured at up to 25%, and gains may owe capital-gains tax (a 1031 exchange can defer both). Figures are a year-1 estimate at your 24.0% rate — not tax advice; consult a CPA.
Schools (NCES district)
- District
- Powers SD 31
- NCES district ID
- 4110080
- Math proficiency
- 20% ▲ 10.00%
- Reading proficiency
- 25% ▲ 5.00%
- Median HH income
- $34,872
- Composite
- 21.67/100
- National rank
- #13597
- State rank
- #178 of 183 in OR
Livability — Powers
- Score
- 61/100
- State rank
- #274
- US rank
- #18426
Category grades
Schools grade is shown separately in the Schools card above.
Census & demographics
- Census place
- Powers, OR
- Population (ZIP)
- 1,152
Population outlook (Coos County) Hauer SSP2
- Today (2025)
- 62,222 people
- By 2030
- 61,120 · -1.8%
- By 2040
- 58,478 · -6.0%
- By 2050
- 56,819 · -8.7%
- By 2075
- 54,915 · -11.7%
- By 2100
- 51,403 · -17.4%
Race, ethnicity, and origin ACS 2023
- Neighborhood character
- Predominantly White (75%)
- Race & ethnicity
- White 75% Two or more races 23% Hispanic / Latino 6% Native American 3%
- Hispanic origin (detail)
- Common ancestry
- Italian 10% Lithuanian 4% Portuguese 2%
- Foreign-born
- 1% · Canada
- Languages at home
- 99% English-only · Spanish 1%
Political lean MEDSL · Coos
- 2024 margin
- R (+19.9) · D 38.7% · R 58.5% · Other 2.8%
- 2008→2024 swing
- -16.8pp toward R · 2008: -3.1pp · 2024: -19.9pp
- All cycles
- 2024: R+19.9 2020: R+20.5 2016: R+24.3 2012: R+6.3 2008: R+3.1
Not yet ingested
- Civics
- —
Market trends
- HPI YoY
- —
- Current HPI
- —
- Rent YoY
- —
- Metro
- —
- State GDP YoY
- ▲ 2.05%
- F500 in state
- 2
Industry mix (Fortune 500 HQ in OR)
| Industry | F500 HQs | Revenue |
|---|---|---|
| Consumer Goods | 1 | $51B |
|
||
Price history
+9.1% since first listed4 events — show timeline
- 2026-06-10 Sold (Public Records) $36,000 Public Records
- 2026-06-10 Sold (MLS) $36,000 RMLS
- 2026-05-17 Pending — RMLS
- 2026-05-13 Listed $33,000 RMLS
Property tax history
+2.1%/yrLatest (2025): $400 · +5.3% YoY. Source: county tax records.
Cash-flow waterfall
monthlySold comps — $/sqft
last 12 mo · ≤1 miLoading sold comps…