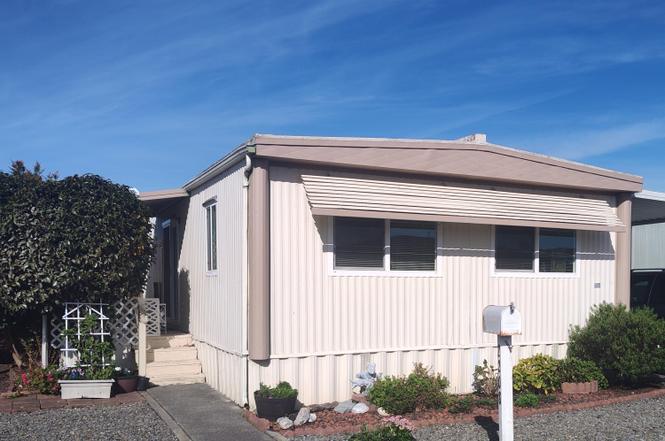
2208 Royal Dr #32 · Fortuna, CA
Flood risk 1/10 · Minimal
- FEMA flood zone
- X (unshaded)
- Chance of flooding over 30 yrs
- 0.0%
- Est. flood insurance / yr
- $507 – $1,088
Fire risk 1/10 · Minimal
- Est. fire insurance / yr
- $659 – $1,223
Heat risk 2/10 · Minimal
- Hot days now (above 84°F)
- 7 days/yr
- Hot days in 30 yrs
- 17 days/yr
Wind risk 1/10 · Minimal
- Chance of severe wind over 30 yrs
- —
Air-quality risk 6/10 · Moderate
- Unhealthy air days now
- 9 days/yr
- Unhealthy air days in 30 yrs
- 9 days/yr
Risk factors via First Street. Map © Google.
Why this score? — see what drove the B- grade
The composite is a weighted blend of 9 inputs, each scored 0–100. Each bar is that input's sub-score; the figure is the points it added to the 100-point composite (weight × sub-score).
- Cash flow +30.0/30.0
- 1% rule +10.0/10.0
- DSCR +10.0/10.0
- ARV discount +7.5/15.0
- Livability +3.5/5.0
- Schools +2.6/10.0
- Rent growth +2.5/5.0
- Condition / age +2.5/5.0
- Appreciation +0.0/10.0
$62,500
🖨 Deal sheet (PDF) 📄 Offer letter ✓ Due diligence
Listing remarks MLS
Very well maintained double wide home in turn key condition. Roof was installed in 2005 my Century Services and windows replaced with vinyl in 2014. New Kitchen flooring was installed in 2012. Large Master bedroom. Exterior has just been painted. Features a large built in china hutch in dining area and spacious front room. Home sits in a good location in park and is priced to sell.
Key facts
- Large windows
- Covered front porch
- Open floor plan
Tags
Property features AI
Finance
- HOA & community: Community sidewalks; Located in Royal Crest Mobile Home Park
Exterior
- Parking: 1 garage space
- Utilities: Public water; Public sewer; Electricity connected; Circuit breakers; 220-volt outlet in laundry
- Home design: Residential single-family residence; Located in a mobile home park (Royal Crest) — Guerdon Royal Embassy model
- Construction: Aluminum siding; Other roof material
- Exterior features: Deck; Porch; Partial fencing; Outbuilding
Interior
- Kitchen: Range; Range hood; Refrigerator
- Bedrooms: Total of 4 rooms (includes bedrooms and other rooms)
- Flooring: Carpet; Vinyl
- Heating & cooling: Forced-air heating; Natural gas heating
- Interior features: Double-pane windows; Insulation for energy efficiency
- Laundry & utility: Washer hookup; Electric dryer hookup; Washer and dryer included
Neighborhood map
What this means for you Summary
Snapshot
- This is a 2-bed/1.0-bath manufactured listed at $62k.
Deal economics
- At list price, monthly cash flow is $620 ($7k/yr) — positive.
- The deal already cash-flows at list — no discount required.
- Meets the 1% rule at list price ($1k rent vs $62k).
- Recommended offer: $55k (12.0% below list) — sets the bar for market timing.
- Cap rate 18.2% vs local median 2.4% in Fortuna — top-decile yield for the area; either an underpriced asset or a hidden risk that comps aren't pricing in. Stress-test before assuming the spread holds.
Location & tenants
- Location reads 69/100 on livability (#246 in CA) — a middle-class / working-renter tenant base. Strengths: health & safety A+, commute A-; Watch: employment D+, amenities F, cost of living F.
- Fortuna Union High (town): math 17% / reading 44% proficiency, ranked #350 of 517 in CA (top 68%) — families likely to look elsewhere, expect single-tenant / working-renter base with shorter leases.
- Zoned schools: Linell K. Walker Elementary (math 17% / reading 27%, grade F, #1,179 of 1,571 statewide, top 78%, 294 students, 82% FRL); Fortuna Middle (math 10% / reading 24%, grade F, #443 of 498 statewide, top 90%, 237 students, 80% FRL); Fortuna Union High (math 12% / reading 37%, grade F, #826 of 1,170 statewide, top 80%, 830 students, 47% FRL).
- Market conditions: 110 active listings in the ZIP; 188 units permitted in Humboldt County in 2024 (17 in 5+ unit buildings).
Forward outlook
- Local home prices are declining (-3.0%/yr); year-one equity from $432 of loan paydown is wiped out by about $2k of value loss. Plan a longer hold.
- Humboldt County population projected to shrink 4% by 2050 — rents likely to lag national; underwrite the cash flow, not the appreciation.
- At projected returns (-3.0% appreciation + 3.0% rent growth), your $18k cash investment doubles in ~3 years — after that, you're playing with house money.
Negotiation context
- It's been on market 221 days — a 12% lower offer ($55k) is reasonable based on typical stale-listing flexibility.
- 2 sale attempts since 11y ago with the ask held roughly flat each time — persistent listings suggest the price (not the market) is what's stuck; bring a comps-based counter.
- Current owner paid $30k; list at $62k implies a 108% gain — meaningful room to come down on a strong offer.
Questions for the listing agent
- It's been on market 221 days. Have you received any prior offers? Is the seller open to a 12% concession, seller financing, or rate buy-down credit?
- Built in 1972 — when were the roof, HVAC, electrical panel, plumbing, and water heater last replaced?
- Why hasn't it sold? Are there any deal-killer items the seller is aware of (foundation, flood, title, zoning, code violations)?
- Is there a deadline driving the sale (1031 exchange, divorce, estate, relocation)? That informs how much negotiation room exists.
- What's the average days-on-market for RENTAL listings here right now (not sales)? A rising rental-DOM trend means longer vacancies and softer asking-rent achievability than the comps imply.
- What's the recent tenant-quality profile in this submarket — average credit score on applications, eviction rate, late-payment / NSF rate, and stable-employment percentage? A property-management company in the area should have these aggregated.
- How much new for-sale + rental construction is in the pipeline within 1–3 miles? Heavy new supply typically softens prices + rents 12–24 months out; constrained supply supports both.
Investment metrics
- 1% rule
- 2.13% ✓
- Cap rate
- 18.21%
- Cash-on-cash
- 42.55%
- DSCR
- 2.89
- GRM
- 3.9
CMA / ARV
No comps found within radius.
Projected returns pro-forma
-3.0% appreciation · 3.0% rent growth · sell at horizon
- IRR
- 39.3%
- Equity multiple
- 2.68×
- Total profit
- $29,412
- Equity at exit
- $9,319
- IRR
- 45.7%
- Equity multiple
- 5.38×
- Total profit
- $76,580
- Equity at exit
- $5,404
Cash invested: $17,500 (down + closing). Projections, not guarantees.
Landlord ↔ Tenant lean methodology
- Overall (STATE)
- 18 Strongly Tenant-Friendly
- State California
- 18 Strongly Tenant-Friendly · D+13
- County
- — inherits STATE
- City
- — inherits STATE
ZIP-level market 95540
- Active inventory
- 110
- Price-to-rent
- 3.9×
Monthly cashflow live
- Estimated rent
- $1,332 medium interval (Pro) →
- Mortgage (P&I)
- −$328
- Tax est. 1.5%
- −$78 /mo · $938/yr
- Insurance
- −$26
- HOA
- −$0
- Vacancy / Maint / Mgmt
- −$280
- Net cashflow
- $620
Break-even live
Sensitivity live
| Price | -10% $664 | -5% $642 | +0% $620 | +5% $599 | +10% $577 |
|---|---|---|---|---|---|
| Rent | -10% $515 | -5% $568 | +0% $620 | +5% $673 | +10% $726 |
| Rate | -1.0pp $652 | -0.5pp $636 | base $620 | +0.5pp $604 | +1.0pp $588 |
UW: 25.0% down · 7.5% · 30yr · 1.5% tax · 5.0% vac · 8.0% maint · 8.0% mgmt
Financing live
Cash to close
- Down payment
- $15,625
- Closing costs
- $1,875
- Reserves months
- —
- Total cash needed
- —
Loan-product check · same deal, 3 products live
Conventional
25% down · 7.5% · 30yr
- Down + closing
- —
- Monthly P&I
- —
- Monthly cashflow
- —
- DSCR
- —
- Eligible?
- —
Personal DTI + credit; lowest rate.
DSCR
20% down · 8.5% · 30yr
- Down + closing
- —
- Monthly P&I
- —
- Monthly cashflow
- —
- DSCR
- —
- Eligible?
- —
No personal income docs; deal must DSCR.
Hard money
10% down · 12.0% · 12mo
- Down + closing
- —
- Monthly P&I
- —
- Monthly cashflow
- —
- DSCR
- —
- Eligible?
- —
Short-term bridge; refi at stabilization.
Listing history 20 events
-
2026-06-21days on market $62,500 Active 221 DOM
-
2026-06-19days on market $62,500 Active 219 DOM
-
2026-06-18days on market $62,500 Active 218 DOM
-
2026-06-17days on market $62,500 Active 217 DOM
-
2026-06-16days on market $62,500 Active 216 DOM
-
2026-06-15days on market $62,500 Active 215 DOM
-
2026-06-14days on market $62,500 Active 213 DOM
-
2026-06-12days on market $62,500 Active 212 DOM
-
2026-06-09days on market $62,500 Active 209 DOM
-
2026-06-08days on market $62,500 Active 208 DOM
-
2026-06-07days on market $62,500 Active 207 DOM
-
2026-06-07days on market $62,500 Active 206 DOM
-
2026-06-04days on market $62,500 Active 203 DOM
-
2026-06-02days on market $62,500 Active 202 DOM
-
2026-06-01days on market $62,500 Active 201 DOM
-
2026-05-31days on market $62,500 Active 200 DOM
-
2026-05-31days on market $62,500 Active 199 DOM
-
2025-11-13$62,500 Active
-
2016-02-24soldstatus $30,000 385-char remark
Show marketing remark (385 chars)
Very well maintained double wide home in turn key condition. Roof was installed in 2005 my Century Services and windows replaced with vinyl in 2014. New Kitchen flooring was installed in 2012. Large Master bedroom. Exterior has just been painted. Features a large built in china hutch in dining area and spacious front room. Home sits in a good location in park and is priced to sell.
-
2015-08-11$32,500 385-char remark
Show marketing remark (385 chars)
Very well maintained double wide home in turn key condition. Roof was installed in 2005 my Century Services and windows replaced with vinyl in 2014. New Kitchen flooring was installed in 2012. Large Master bedroom. Exterior has just been painted. Features a large built in china hutch in dining area and spacious front room. Home sits in a good location in park and is priced to sell.
ⓘ Source: listings_history table (triggers on properties + properties_extension) + one-shot
backfill from property_details.listing_events for pre-trigger history.
Climate risk First Street
- Flood 1/10 Low FEMA zone X (unshaded) · 0% chance over 30 yrs
- Wildfire 1/10 Low
- Heat 2/10 Low 7 d/yr ≥84°F today · 17 d/yr by 30 yrs out
- Wind 1/10 Low
- Air quality 6/10 Major 9 unhealthy d/yr today · 9 by 30 yrs out
Nearby sold comps map
Loading sold comps map…
Walkable amenities ~0.75 mi
Loading nearby amenities…
Taxation est. · year 1
- Rental income
- $15,986
- − Mortgage interest
- −$3,501
- − Property taxes
- −$938
- − Insurance
- −$312
- − Repairs & maintenance
- −$1,279
- − Management
- −$1,279
- − Depreciation
- −$1,818
- Taxable income
- $6,859
- Est. tax owed @ 24.0%
- −$1,646
- After-tax cash flow
- $5,800/yr
For passive investors: Depreciation is non-cash, so a rental often shows a tax loss while cash-flowing — sheltering income. Rental losses are passive: they offset passive income freely, and up to $25,000/yr can offset ordinary (W-2) income if you actively participate and your MAGI is under $100k (phasing out to $0 by $150k); unused losses carry forward. On sale, claimed depreciation is recaptured at up to 25%, and gains may owe capital-gains tax (a 1031 exchange can defer both). Figures are a year-1 estimate at your 24.0% rate — not tax advice; consult a CPA.
Schools (NCES district)
- District
- Fortuna Union High
- NCES district ID
- 0614190
- Math proficiency
- 17% ▼ -10.00%
- Reading proficiency
- 44% ▼ -8.00%
- Median HH income
- $41,411
- Composite
- 25.69/100
- National rank
- #7386
- State rank
- #350 of 517 in CA
Livability — Fortuna
- Score
- 69/100
- State rank
- #246
- US rank
- #8234
Category grades
Schools grade is shown separately in the Schools card above.
Census & demographics
- Census place
- Fortuna, CA
- City population
- 14,641
- Population (ZIP)
- 14,641
Population outlook (Humboldt County) Hauer SSP2
- Today (2025)
- 135,550 people
- By 2030
- 134,798 · -0.6%
- By 2040
- 132,222 · -2.5%
- By 2050
- 130,850 · -3.5%
- By 2075
- 128,656 · -5.1%
- By 2100
- 120,238 · -11.3%
Race, ethnicity, and origin ACS 2023
- Neighborhood character
- Predominantly White (68%)
- Race & ethnicity
- White 68% Hispanic / Latino 19% Two or more races 12% Asian 3% Native American 3%
- Hispanic origin (detail)
- Mexican 18%
- Common ancestry
- Lithuanian 4% Italian 4% Slovak 3%
- Foreign-born
- 12% · Canada, China
- Languages at home
- 85% English-only · Spanish 13% Other Indo-European 1% Chinese 1%
Political lean MEDSL · Humboldt
- 2024 margin
- Strong D (+28.4) · D 62.0% · R 33.6% · Other 4.5%
- 2008→2024 swing
- +0.2pp no change · 2008: 28.2pp · 2024: 28.4pp
- All cycles
- 2024: D+28.4 2020: D+33.4 2016: D+25.9 2012: D+26.2 2008: D+28.2
Not yet ingested
- Civics
- —
Market trends
- HPI YoY
- ▼ -232.72%
- Current HPI
- 236.0203
- Rent YoY
- —
- Metro
- —
- State GDP YoY
- ▲ 3.21%
- F500 in state
- 116
Industry mix (Fortune 500 HQ in CA)
| Industry | F500 HQs | Revenue |
|---|---|---|
| Technology | 27 | $1,492B |
|
||
| Financial Services | 3 | $174B |
|
||
| Retail | 3 | $44B |
|
||
| Insurance | 3 | $26B |
|
||
| Media / Entertainment | 2 | $115B |
|
||
| Pharmaceuticals / Biotech | 2 | $62B |
|
||
Price history
+92.3% since first listed3 events — show timeline
- 2025-11-13 Listed $62,500 HAR
- 2016-02-24 Sold (MLS) $30,000 HAR
- 2015-08-11 Listed $32,500 HAR
Cash-flow waterfall
monthlySold comps — $/sqft
last 12 mo · ≤1 miLoading sold comps…