 Triplex
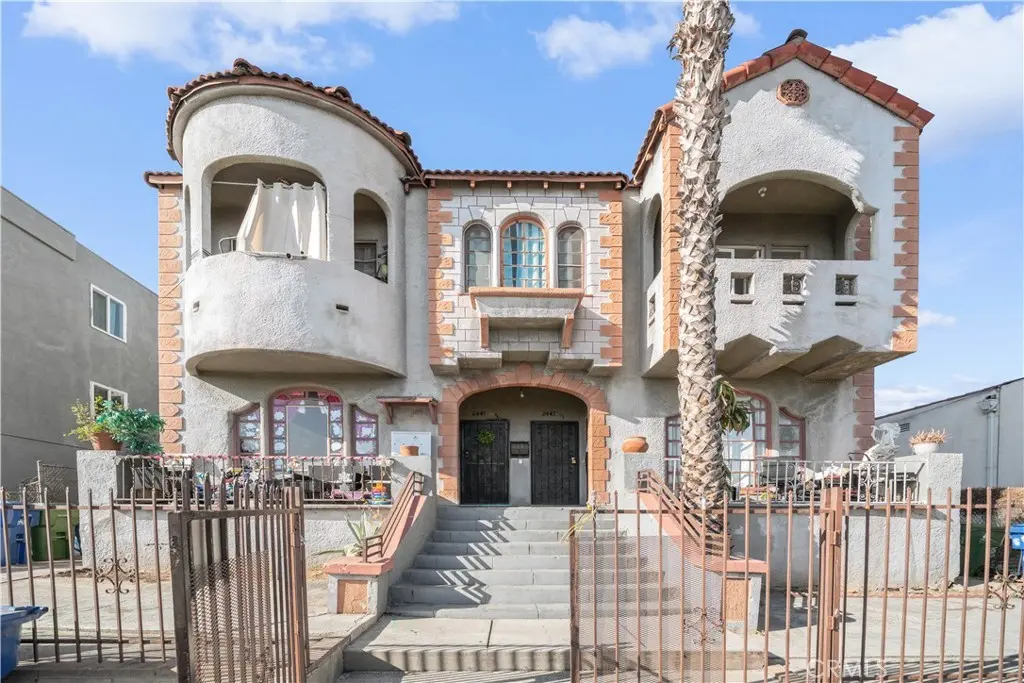
2441 Fairmount · Los Angeles, CA
Flood risk 1/10 · Minimal
- FEMA flood zone
- X (unshaded)
- Chance of flooding over 30 yrs
- 0.0%
- Est. flood insurance / yr
- $507 – $1,088
Fire risk 1/10 · Minimal
- Est. fire insurance / yr
- $659 – $1,223
Heat risk 6/10 · Moderate
- Hot days now (above 94°F)
- 7 days/yr
- Hot days in 30 yrs
- 21 days/yr
Wind risk 1/10 · Minimal
- Chance of severe wind over 30 yrs
- —
Air-quality risk 6/10 · Moderate
- Unhealthy air days now
- 11 days/yr
- Unhealthy air days in 30 yrs
- 12 days/yr
Risk factors via First Street. Map © Google.
Why this score? — see what drove the D- grade
The composite is a weighted blend of 9 inputs, each scored 0–100. Each bar is that input's sub-score; the figure is the points it added to the 100-point composite (weight × sub-score).
- Cash flow +16.4/30.0
- DSCR +5.1/10.0
- 1% rule +3.9/10.0
- Schools +3.6/10.0
- Livability +3.4/5.0
- Condition / age +2.5/5.0
- Rent growth +1.9/5.0
- ARV discount +0.8/15.0
- Appreciation +0.0/10.0
$1,150,000
🖨 Deal sheet (PDF) 📄 Offer letter ✓ Due diligence
Multi-family units
County records classify this as Multi-Family (2-4 Unit). Listing-text estimate: 3 units. confirmed
Listing remarks MLS
We are pleased to present for sale this excellent investment opportunity in one of LA's most up and coming locations Boyle Heights! This stunning 1930's investment opportunity is a 100% occupied (4) unit building situated on an expansive lot size of 7,003 SF, boasting a robust unit mix of One (3) Bedroom and (1) Bathroom Unit, Two (2) Bedroom and (1) Bath Unit, and One (2) Bedroom and (1) Bath unit. The investment has a strong day 1 return with an 11.17 GRM, 6.01% Cap Rate, and $225K per unit with immense upside potential and provides original charm with select units having original hardwood flooring, balconies, views of DTLA, and abundant parking at the rear of the lot. The subject property is zoned R3-1-CUGU, in a Tier 3 TOC location with alley access - allowing for up to (8) units by right and (15) units with TOC bonuses for future development (Buyer to Verify Feasibility). An astute investor can immediately add value by building additional units or ADU(s). Strategically located just blocks from the famous retail corridor of Cesar Chavez, and blocks to Keck Hospital of USC and USC Health Sciences Campuses, 2441 Fairmount Street is considered "Very Walkable" with a walk score of (89), where most errands can be accomplished on foot, and an "Excellent Transit" score of (73) where transit is convenient for most trips. Disclosure: Buyer to conduct any/all due diligence including but not limited to the building square footage, lot size, legal bedroom/bathroom count, unit mix, year built, zoning, market rents, and the ability to construct an ADU or additional units. DO NOT DISTURB TENANTS OR WALK ON PROPERTY - DRIVE BY ONLY.
Key facts
- Alley access
- Build additional adu
- Zoned r3-1-cugu
Tags
Property features AI
Finance
- Other: Lot features indicate 0-1 unit per acre (per assessor data); Year built source: Assessor
- Financial info: Total building area approximately 5,822; Total of 4 dwelling units; Gross scheduled income $86,784; Gross income $86,784; Net operating income $67,117.04; Operating expenses $7,666.96 (includes insurance $1,904; water/sewer $5,355; electric $207.96; fuel $200); Gross multiplier 13; Rent control applies; Reported rents by unit type: $1,097.98; $1,477.02; $2,250; $2,339.50
Exterior
- Parking: Five uncovered parking spaces (total of 5 parking spaces)
- Utilities: Public sewer; District/Public water; Four separate gas meters; Four separate electric meters; One separate water meter
- Home design: Attached property; Two-story building
- Construction: One building; One common wall
- Exterior features: No pool; Street lighting in the neighborhood
Interior
- Kitchen: Kitchens included in each unit (standard appliances implied)
- Bedrooms: Unit mix includes 2-bed and 3-bed units
- Bathrooms: Each unit has full bathrooms (units with 1 or 2 full baths)
- Interior features: Ground-level entry
- Laundry & utility: In-unit laundry available with washer hookup; Washer included in at least one unit
Neighborhood map
What this means for you Summary
Snapshot
- This is a 3 × 3-bed/?-bath units multifamily listed at $1.15M.
Deal economics
- At list price, monthly cash flow is $643 ($8k/yr) — positive. Per door: $214/mo.
- The deal already cash-flows at list — no discount required.
- To meet the 1% rule (rent ≥ 1% of price), the offer needs to be $1.03M (10.7% below list).
- Recommended offer: $1.03M (10.7% below list) — sets the bar for 1% rule.
- Cap rate 7.0% vs local median 2.1% in Los Angeles — top-decile yield for the area; either an underpriced asset or a hidden risk that comps aren't pricing in. Stress-test before assuming the spread holds.
Location & tenants
- Location reads 68/100 on livability (#273 in CA) — a middle-class / working-renter tenant base. Strengths: amenities A+, commute A+, employment B; Watch: health & safety C-, crime F, cost of living F.
- Los Angeles Unified (urban): math 29% / reading 54% proficiency, ranked #223 of 517 in CA (top 43%) — families likely to look elsewhere, expect single-tenant / working-renter base with shorter leases; 67% free/reduced lunch — lower-income household profile, screen leases tightly.
- Zoned schools: Evergreen Avenue Elementary (548 students, 94% FRL); Belvedere Middle (727 students, 97% FRL); Theodore Roosevelt Senior High (math 17% / reading 37%, grade F, #788 of 1,170 statewide, top 69%, 1,528 students, 97% FRL) — zoned schools average 96% FRL vs 67% district-wide (28 pts higher); higher-poverty schools than district average — tighter screening recommended.
- Zoned-school proficiency averages 27% at this address vs 42% district-wide (-14 pts) — the specific schools serving this property underperform the Los Angeles Unified average; the district grade overstates school quality for this exact location.
- Market conditions: Rents soft (-2.3%/yr); 108 active listings in the ZIP; 19,697 units permitted in Los Angeles County in 2024 (9,426 in 5+ unit buildings).
Forward outlook
- Local home prices are declining (-3.0%/yr); year-one equity from $8k of loan paydown is wiped out by about $34k of value loss. Plan a longer hold.
- Los Angeles County population projected at +9% by 2050 — modest demand growth; plan on rents tracking national, not racing it.
Negotiation context
- Only 6 days on market — expect competitive offers; lowballing is unlikely to land.
- 13 sale attempts since 25y ago with the ask held roughly flat each time — persistent listings suggest the price (not the market) is what's stuck; bring a comps-based counter.
- Current owner paid $885k; 30% above their basis — modest negotiation headroom, anchor on the comps not their cost.
Risks & watch-outs
- Watch-outs: built in 1930 — expect roof / HVAC / electrical / plumbing capex.
- Climate carrying-cost: extreme-heat days projected 7→21/yr by 2055 (HVAC capex compounding) — expect insurance premiums to compound above CPI over the hold.
Questions for the listing agent
- Can we see the unit-by-unit rent roll, current vacancy, and any below-market leases? What's the average tenancy length?
- What capital expenditures (roof, boiler, parking lot, exteriors) have been made in the last 5 years, and what's planned in the next 2?
- Built in 1930 — when were the roof, HVAC, electrical panel, plumbing, and water heater last replaced?
- Is there a deadline driving the sale (1031 exchange, divorce, estate, relocation)? That informs how much negotiation room exists.
- Schools are D-rated, which usually means shorter tenancies and higher turnover. Who's the typical renter profile here, and what's been the actual vacancy rate?
- Crime grade is F in this area — have there been break-ins, vandalism, or insurance claims at this property in the last 3 years? What carrier currently insures it and at what premium?
- The area grade is low — what's the realistic commute time and amenity access for the typical tenant pool here? Any planned neighborhood developments (good or bad) we should know about?
- What's the average days-on-market for RENTAL listings here right now (not sales)? A rising rental-DOM trend means longer vacancies and softer asking-rent achievability than the comps imply.
- What's the recent tenant-quality profile in this submarket — average credit score on applications, eviction rate, late-payment / NSF rate, and stable-employment percentage? A property-management company in the area should have these aggregated.
- How much new apartment / multifamily construction is in the pipeline within 1–3 miles? Heavy new supply (>2% of stock underway) typically softens rents 12–24 months out; light construction supports rent growth.
Investment metrics
- 1% rule
- 0.89% ✗
- Cap rate
- 6.96%
- Cash-on-cash
- 2.40%
- DSCR
- 1.11
- GRM
- 9.3
CMA / ARV
- ARV (on-the-fly)
- $1,001,384
- Comps found
- 2
Show comp detail 2 sales within ~0.75 mi
| Address | Dist | Beds/Ba | Sqft | Sold | Price | $/sf | Match |
|---|---|---|---|---|---|---|---|
| 574 N St Louis St | 0.42mi | 8/4.0 | 5,184 (-11%) | 4mo | $890,000 | $172 | 59 |
| 3160 Fairmount St | 0.63mi | 8/4.0 | 6,536 (+12%) | 13mo | $950,000 | $145 | 40 |
Match score weights: distance 35% · size 25% · config 20% · recency 20%. Top-matched comps best support the ARV.
Projected returns pro-forma
-3.0% appreciation · 0.0% rent growth · sell at horizon
- IRR
- -15.8%
- Equity multiple
- 0.45×
- Total profit
- $-175,628
- Equity at exit
- $171,469
- IRR
- -13.3%
- Equity multiple
- 0.33×
- Total profit
- $-217,072
- Equity at exit
- $99,431
Cash invested: $322,000 (down + closing). Projections, not guarantees.
Landlord ↔ Tenant lean methodology
- Overall (CITY)
- 0 Strongly Tenant-Friendly
- State California
- 18 Strongly Tenant-Friendly · D+13
- County
- — inherits STATE
- City Los Angeles
- 0 Strongly Tenant-Friendly · D+22
ZIP-level market 90033
- Home prices YoY
- -29.9%
- Rents YoY
- -2.3%
- Active inventory
- 108
- Price-to-rent
- 28.0×
Monthly cashflow live
- Estimated rent
- $10,270 high interval (Pro) →
- Mortgage (P&I)
- −$6,031
- Tax from tax record
- −$960 /mo · $11,524/yr
- Insurance
- −$479
- HOA
- −$0
- Vacancy / Maint / Mgmt
- −$2,157
- Net cashflow
- $643
Break-even live
Sensitivity live
| Price | -10% $1,294 | -5% $969 | +0% $643 | +5% $318 | +10% $-8 |
|---|---|---|---|---|---|
| Rent | -10% $-168 | -5% $237 | +0% $643 | +5% $1,049 | +10% $1,454 |
| Rate | -1.0pp $1,222 | -0.5pp $936 | base $643 | +0.5pp $345 | +1.0pp $42 |
3-unit breakdown (identical units grouped — click to expand)
| Units | Beds | Baths | Est. rent |
|---|---|---|---|
| 3× units | 3 | — | $10,269 |
| #1 | 3 | — | $3,423 |
| #2 | 3 | — | $3,423 |
| #3 | 3 | — | $3,423 |
| Total (3 units) | $10,270 | ||
UW: 25.0% down · 7.5% · 30yr · 1.5% tax · 5.0% vac · 8.0% maint · 8.0% mgmt
Financing live
Cash to close
- Down payment
- $287,500
- Closing costs
- $34,500
- Reserves months
- —
- Total cash needed
- —
Loan-product check · same deal, 3 products live
Conventional
25% down · 7.5% · 30yr
- Down + closing
- —
- Monthly P&I
- —
- Monthly cashflow
- —
- DSCR
- —
- Eligible?
- —
Personal DTI + credit; lowest rate.
DSCR
20% down · 8.5% · 30yr
- Down + closing
- —
- Monthly P&I
- —
- Monthly cashflow
- —
- DSCR
- —
- Eligible?
- —
No personal income docs; deal must DSCR.
Hard money
10% down · 12.0% · 12mo
- Down + closing
- —
- Monthly P&I
- —
- Monthly cashflow
- —
- DSCR
- —
- Eligible?
- —
Short-term bridge; refi at stabilization.
Listing history 5 events
-
2026-06-21days on market $1,150,000 Active 6 DOM
-
2026-06-18days on market $1,150,000 Active 3 DOM
-
2026-06-17days on market $1,150,000 Active 2 DOM
-
2026-06-16remarks 699-char remark
-
2026-06-16$1,150,000 Active 1 DOM
ⓘ Source: listings_history table (triggers on properties + properties_extension) + one-shot
backfill from property_details.listing_events for pre-trigger history.
Tax reassessment forecast CA · Resets to sale price
- Current annual tax
- $11,524 · $960/mo
- Projected year-2 tax
- $11,524 · $960/mo
- Expected delta
- $0/yr ($0/mo · 0.0%)
ⓘ Screening estimate from a state-policy table — verify with the county assessor before closing.
Climate risk First Street
- Flood 1/10 Low FEMA zone X (unshaded) · 0% chance over 30 yrs
- Wildfire 1/10 Low
- Heat 6/10 Major 7 d/yr ≥94°F today · 21 d/yr by 30 yrs out
- Wind 1/10 Low
- Air quality 6/10 Major 11 unhealthy d/yr today · 12 by 30 yrs out
Nearby sold comps map
Loading sold comps map…
Walkable amenities ~0.75 mi
Loading nearby amenities…
Taxation est. · year 1
- Rental income
- $123,240
- − Mortgage interest
- −$64,418
- − Property taxes
- −$11,524
- − Insurance
- −$5,750
- − Repairs & maintenance
- −$9,859
- − Management
- −$9,859
- − Depreciation
- −$33,455
- Taxable loss
- −$11,625
- Est. tax savings @ 24.0%
- +$2,790
- After-tax cash flow
- $10,507/yr
For passive investors: Depreciation is non-cash, so a rental often shows a tax loss while cash-flowing — sheltering income. Rental losses are passive: they offset passive income freely, and up to $25,000/yr can offset ordinary (W-2) income if you actively participate and your MAGI is under $100k (phasing out to $0 by $150k); unused losses carry forward. On sale, claimed depreciation is recaptured at up to 25%, and gains may owe capital-gains tax (a 1031 exchange can defer both). Figures are a year-1 estimate at your 24.0% rate — not tax advice; consult a CPA.
Schools (NCES district)
- District
- Los Angeles Unified
- NCES district ID
- 0622710
- Math proficiency
- 29% ▼ -4.00%
- Reading proficiency
- 54% ▲ 10.00%
- Median HH income
- $50,403
- Composite
- 35.67/100
- National rank
- #4875
- State rank
- #223 of 517 in CA
Livability — Los Angeles
- Score
- 68/100
- State rank
- #273
- US rank
- #9237
Category grades
Schools grade is shown separately in the Schools card above.
Census & demographics
- Census place
- Los Angeles, CA
- County
- Los Angeles County · 9,444,647 people
- City population
- 3,838,149
- Metro
- Los Angeles-Long Beach-Anaheim, CA
- Population (ZIP)
- 45,647
- Household income
- $59,652
- Rent vs Own
- Severe rent burden
- 3159.0
Population outlook (Los Angeles County) Hauer SSP2
- Today (2025)
- 10,940,515 people
- By 2030
- 11,256,481 · +2.9%
- By 2040
- 11,729,929 · +7.2%
- By 2050
- 11,948,407 · +9.2%
- By 2075
- 11,818,114 · +8.0%
- By 2100
- 10,842,928 · -0.9%
Race, ethnicity, and origin ACS 2023
- Neighborhood character
- Predominantly Hispanic (90%)
- Race & ethnicity
- Hispanic / Latino 90% Two or more races 13% Asian 4% White 3% Native American 3% Black 1%
- Hispanic origin (detail)
- Mexican 75%
- Foreign-born
- 43% · Canada, South Korea, China
- Languages at home
- 16% English-only · Spanish 80% Other Asian/Pacific 1% Korean 1%
Political lean MEDSL · Los Angeles
- 2024 margin
- Solid D (+32.9) · D 64.8% · R 31.9% · Other 3.3%
- 2008→2024 swing
- -7.4pp toward R · 2008: 40.4pp · 2024: 32.9pp
- All cycles
- 2024: D+32.9 2020: D+44.2 2016: D+48.0 2012: D+40.0 2008: D+40.4
Not yet ingested
- Civics
- —
Market trends
- HPI YoY
- ▼ -201.59%
- Current HPI
- 472.4588
- Rent YoY
- ▼ -2.34%
- Metro
- Los Angeles-Long Beach-Anaheim, CA
- State GDP YoY
- ▲ 3.21%
- F500 in state
- 116
Industry mix (Fortune 500 HQ in CA)
| Industry | F500 HQs | Revenue |
|---|---|---|
| Technology | 27 | $1,492B |
|
||
| Financial Services | 3 | $174B |
|
||
| Retail | 3 | $44B |
|
||
| Insurance | 3 | $26B |
|
||
| Media / Entertainment | 2 | $115B |
|
||
| Pharmaceuticals / Biotech | 2 | $62B |
|
||
Price history
+1669.2% since first listed35 events — show timeline
- 2026-06-15 Listed $1,150,000 CRMLS
- 2023-12-08 Sold (Public Records) $885,000 Public Records
- 2023-12-08 Sold (MLS) $885,000 TheMLS
- 2023-12-08 Sold (MLS) $885,000 SDMLS
- 2023-09-27 Pending — TheMLS
- 2023-09-11 Listed $900,000 TheMLS
- 2023-09-11 Listed $900,000 SDMLS
- 2015-08-19 Sold (MLS) $520,000 SDMLS
- 2015-08-19 Sold (MLS) $520,000 CRMLS
- 2015-05-12 Pending — CRMLS
- 2015-04-30 Relisted — CRMLS
- 2015-04-27 Pending — CRMLS
- 2015-03-31 Listed $590,600 CRMLS
- 2015-03-31 Listed $590,600 SDMLS
- 2015-03-01 Listing Removed — CRMLS
- 2015-03-01 Listing Removed — SDMLS
- 2015-01-21 Listed $625,000 CRMLS
- 2015-01-21 Listed $625,000 SDMLS
- 2012-04-27 Listing Removed — CRMLS
- 2011-09-07 Pending — CRMLS
- 2011-08-31 Listed $400,000 CRMLS
- 2007-03-02 Sold (Public Records) $925,000 Public Records
- 2007-03-02 Sold (MLS) $925,000 CRMLS
- 2006-12-06 Listing Removed — CRMLS
- 2006-09-05 Listed $950,000 CRMLS
- 2004-11-10 Listed $540,000 CRMLS
- 2004-11-10 Sold (MLS) $540,000 CRMLS
- 2004-11-05 Sold (Public Records) $540,000 Public Records
- 2002-05-17 Sold (Public Records) $325,000 Public Records
- 2002-05-17 Sold (MLS) $330,000 TheMLS
- 2002-04-30 Sold (MLS) $330,000 CRMLS
- 2001-12-11 Listed $325,000 CRMLS
- 2001-12-11 Listed $325,000 TheMLS
- 2001-12-11 Delisted — TheMLS
- 1978-09-29 Sold (Public Records) $65,000 Public Records
Property tax history
-0.1%/yrLatest (2025): $11,524 · +1.4% YoY. Source: county tax records.
Cash-flow waterfall
monthlySold comps — $/sqft
last 12 mo · ≤1 miLoading sold comps…