1610 Marshall St · Baltimore, MD
Flood risk 1/10 · Minimal
- FEMA flood zone
- X (unshaded)
- Chance of flooding over 30 yrs
- 0.0%
- Est. flood insurance / yr
- $473 – $860
Fire risk 1/10 · Minimal
- Est. fire insurance / yr
- $755 – $1,403
Heat risk 8/10 · Major
- Hot days now (above 102°F)
- 7 days/yr
- Hot days in 30 yrs
- 15 days/yr
Wind risk 6/10 · Moderate
- Chance of severe wind over 30 yrs
- 27.0%
Air-quality risk 4/10 · Minor
- Unhealthy air days now
- 6 days/yr
- Unhealthy air days in 30 yrs
- 7 days/yr
Risk factors via First Street. Map © Google.
Why this score? — see what drove the D- grade
The composite is a weighted blend of 9 inputs, each scored 0–100. Each bar is that input's sub-score; the figure is the points it added to the 100-point composite (weight × sub-score).
- Cash flow +15.2/30.0
- 1% rule +5.1/10.0
- DSCR +4.6/10.0
- Livability +3.8/5.0
- Condition / age +2.5/5.0
- Rent growth +2.2/5.0
- ARV discount +2.1/15.0
- Schools +1.0/10.0
- Appreciation +0.0/10.0
$219,500
🖨 Deal sheet 📄 Offer letter ✓ Due diligence
Listing remarks
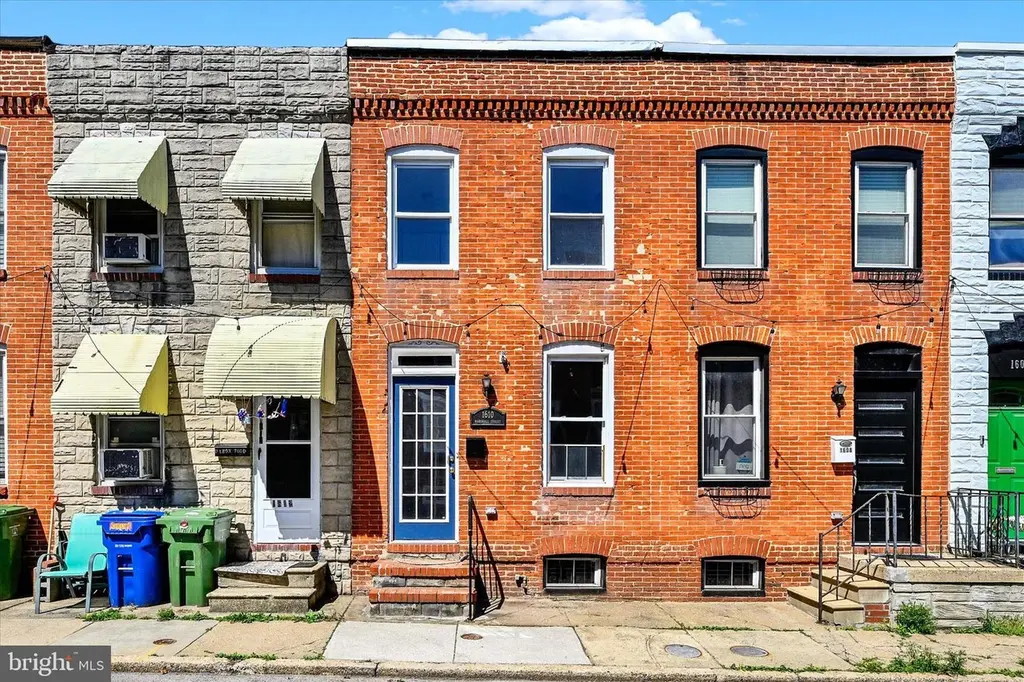
OFFER DEADLINE SET FOR AFTER THE HOLIDAY SO EVERYONE CAN SEE THE HOME AND ENJOY THE HOLIDAY WEEKEND - DEADLINE SET FOR 6PM ON TUESDAY MAY 26th! Welcome to 1610 Marshall Street, a charming Baltimore row home full of character and warmth. This inviting home features original hardwood floors, exposed ceiling beams, formal living and dining spaces, and great natural light throughout. Just off the kitchen, a sun room provides flexible bonus space perfect for a home office, reading nook, or morning coffee. Upstairs, you’ll find two well-sized bedrooms and a shared full bath featuring a classic claw foot soaking tub and separate walk-in shower. Outdoor spaces are a true bonus, with both a re
Key facts
- Clawfoot soaking tub
- Sunroom
- Walk-in shower
Tags
Property features AI
Finance
- Other: Total below-grade area: 312; Above-grade finished area estimated at 864; Unfinished below-grade area: 312; Year built source: Assessor
- Financial info: Ownership interest: Ground rent
- HOA & community: Ground rent payable annually
Exterior
- Parking: On-street parking
- Utilities: Public water; Public sewer; Natural gas hot water; Natural gas heating
- Home design: Interior townhouse / rowhouse; In city limits (Baltimore City)
- Construction: Brick construction; Slab foundation
- Exterior features: Roof deck; Deck(s); Fully fenced
Interior
- Kitchen: Stainless steel appliances; Gas oven/range; Refrigerator; Dishwasher
- Bedrooms: Two bedrooms on the first upper level; Bedroom 1; Bedroom 2
- Flooring: Hardwood; Carpet; Ceramic tile
- Bathrooms: One full bathroom (all upper levels); Full bath with walk-in/shower
- Heating & cooling: Forced air heating; Electric cooling (other type)
- Interior features: Soaking tub; Stall shower / walk-in shower; Dining area; Traditional floor plan; Kitchen eat-in; Brick walls/ceilings; Wood floors
- Laundry & utility: Washer and dryer; Laundry located on lower floor
Neighborhood map
What this means for you Summary
Snapshot
- This is a 2-bed/2.5-bath townhouse listed at $220k.
Deal economics
- At list price, monthly cash flow is $75 ($898/yr) — positive.
- The deal already cash-flows at list — no discount required.
- Meets the 1% rule at list price ($2k rent vs $220k).
Location & tenants
- Location reads 76/100 on livability (#90 in MD, #3,396 nationally) — a middle-class / working-renter tenant base. Strengths: amenities A+, commute A+, housing A+; Watch: schools D, crime F.
- Baltimore City Public Schools (urban): math 7% / reading 16% proficiency, ranked #24 of 24 in MD (top 100%) — low school quality limits family demand, transient renter base, plan for 1-2y turnover; 79% free/reduced lunch — lower-income household profile, screen leases tightly.
- Market conditions: Rents soft (-1.0%/yr); 362 active listings in the ZIP; 40 comparable units currently listed for rent nearby; rentals at typical pace (median 18d on market — plan ~3-4 weeks tenant-placement turnaround); solid renter incomes; 1,273 units permitted in Baltimore city in 2024 (1,104 in 5+ unit buildings).
Forward outlook
- Local home prices are declining (-3.0%/yr); year-one equity from $2k of loan paydown is wiped out by about $7k of value loss. Plan a longer hold.
- Baltimore County population projected to shrink 4% by 2050 — rents likely to lag national; underwrite the cash flow, not the appreciation.
Negotiation context
- Only 9 days on market — expect competitive offers; lowballing is unlikely to land.
- 3 sale attempts since 23y ago with the ask held roughly flat each time — persistent listings suggest the price (not the market) is what's stuck; bring a comps-based counter.
- Current owner paid $158k; 39% above their basis — modest negotiation headroom, anchor on the comps not their cost.
Risks & watch-outs
- Watch-outs: built in 1875 — expect roof / HVAC / electrical / plumbing capex.
- Climate carrying-cost: major wind risk, 27% chance of damaging wind over 30y; extreme-heat days projected 7→15/yr by 2055 (HVAC capex compounding) — expect insurance premiums to compound above CPI over the hold.
Questions for the listing agent
- Built in 1875 — when were the roof, HVAC, electrical panel, plumbing, and water heater last replaced?
- Is there a deadline driving the sale (1031 exchange, divorce, estate, relocation)? That informs how much negotiation room exists.
- Schools are D-rated, which usually means shorter tenancies and higher turnover. Who's the typical renter profile here, and what's been the actual vacancy rate?
- Crime grade is F in this area — have there been break-ins, vandalism, or insurance claims at this property in the last 3 years? What carrier currently insures it and at what premium?
- The area grade is low — what's the realistic commute time and amenity access for the typical tenant pool here? Any planned neighborhood developments (good or bad) we should know about?
- What's the average days-on-market for RENTAL listings here right now (not sales)? A rising rental-DOM trend means longer vacancies and softer asking-rent achievability than the comps imply.
- What's the recent tenant-quality profile in this submarket — average credit score on applications, eviction rate, late-payment / NSF rate, and stable-employment percentage? A property-management company in the area should have these aggregated.
- How much new for-sale + rental construction is in the pipeline within 1–3 miles? Heavy new supply typically softens prices + rents 12–24 months out; constrained supply supports both.
Investment metrics
- 1% rule
- 1.01% ✓
- Cap rate
- 6.70%
- Cash-on-cash
- 1.46%
- DSCR
- 1.06
- GRM
- 8.2
CMA / ARV
- ARV (on-the-fly)
- $196,128
- Comps found
- 12
Show comp detail 12 sales within ~0.75 mi
| Address | Dist | Beds/Ba | Sqft | Sold | Price | $/sf | Match |
|---|---|---|---|---|---|---|---|
| 1617 Race St | 0.21mi | 2/1.5 | 860 (-0%) | 2mo | $265,000 | $308 | 83 |
| 1601 Marshall St | 0.02mi | 2/2.0 | 936 (+8%) | 2mo | $256,000 | $274 | 82 |
| 1622 Patapsco St | 0.04mi | 2/1.0 | 912 (+6%) | 3mo | $164,300 | $180 | 81 |
| 1720 Byrd St | 0.11mi | 2/1.5 | 960 (+11%) | 2mo | $275,000 | $286 | 71 |
| 1526 S Hanover St | 0.17mi | 2/1.5 | 960 (+11%) | 2mo | $185,000 | $193 | 68 |
| 911 S Charles St #403 | 0.53mi | 2/2.0 | 905 (+5%) | 1mo | $200,000 | $221 | 64 |
| 122 Burnett St | 0.31mi | 2/2.5 | 984 (+14%) | 1mo | $310,000 | $315 | 61 |
| 608 E Fort Ave | 0.43mi | 2/2.0 | 786 (-9%) | 2mo | $255,000 | $324 | 61 |
| 30 E Hamburg St | 0.49mi | 2/1.0 | 924 (+7%) | 1mo | $210,000 | $227 | 59 |
| 100 Harborview Dr #1208 | 0.63mi | 1/1.0 (-1) | 856 (-1%) | 0mo | $165,000 | $193 | 58 |
| 731 S Hanover St Unit R2 | 0.64mi | 2/1.0 | 800 (-7%) | 0mo | $180,000 | $225 | 52 |
| 23 Pierside Dr #311 | 0.58mi | 1/1.0 (-1) | 775 (-10%) | 3mo | $125,000 | $161 | 42 |
Match score weights: distance 35% · size 25% · config 20% · recency 20%. Top-matched comps best support the ARV.
Projected returns pro-forma
-3.0% appreciation · 0.0% rent growth · sell at horizon
- IRR
- -17.7%
- Equity multiple
- 0.40×
- Total profit
- $-37,171
- Equity at exit
- $32,728
- IRR
- -17.8%
- Equity multiple
- 0.17×
- Total profit
- $-50,815
- Equity at exit
- $18,978
Cash invested: $61,460 (down + closing). Projections, not guarantees.
Landlord ↔ Tenant lean methodology
- Overall (CITY)
- 12 Strongly Tenant-Friendly
- State Maryland
- 27 Tenant-Leaning · D+14
- County
- — inherits STATE
- City Baltimore
- 12 Strongly Tenant-Friendly · D+58
ZIP-level market 21230
- Rents YoY
- -1.0%
- Active inventory
- 362
- Price-to-rent
- 8.2×
Monthly cashflow live
- Estimated rent
- $2,218 high interval (Pro) →
- Mortgage (P&I)
- −$1,151
- Tax from tax record
- −$435 /mo · $5,217/yr
- Insurance
- −$91
- HOA
- −$0
- Vacancy / Maint / Mgmt
- −$466
- Net cashflow
- $75
Break-even live
UW: 25.0% down · 7.5% · 30yr · 1.5% tax · 5.0% vac · 8.0% maint · 8.0% mgmt
Financing live
Cash to close
- Down payment
- $54,875
- Closing costs
- $6,585
- Reserves months
- —
- Total cash needed
- —
Loan-product check · same deal, 3 products live
Conventional
25% down · 7.5% · 30yr
- Down + closing
- —
- Monthly P&I
- —
- Monthly cashflow
- —
- DSCR
- —
- Eligible?
- —
Personal DTI + credit; lowest rate.
DSCR
20% down · 8.5% · 30yr
- Down + closing
- —
- Monthly P&I
- —
- Monthly cashflow
- —
- DSCR
- —
- Eligible?
- —
No personal income docs; deal must DSCR.
Hard money
10% down · 12.0% · 12mo
- Down + closing
- —
- Monthly P&I
- —
- Monthly cashflow
- —
- DSCR
- —
- Eligible?
- —
Short-term bridge; refi at stabilization.
Rent comps 40 comps
| Address | Beds | Baths | Sqft | Rent | $/sqft | DOM | Units | Dist |
|---|---|---|---|---|---|---|---|---|
| 49 E Heath St Baltimore, MD | 2.0 | 1.5 | 858 | $1,800 | $2.10 | 11d | 1 | 0.05mi |
| 1710 Marshall St Baltimore, MD | 2.0 | 1.0 | 1110 | $2,500 | $2.25 | 43d | 1 | 0.07mi |
| 1700 S Charles St Baltimore, MD | 1.0 | 1.0 | 600 | $1,300 | $2.17 | 43d | 1 | 0.08mi |
| 1702 Light St Unit 302 Baltimore, MD | 2.0 | 2.0 | 735 | $2,300 | $3.13 | 17d | 1 | 0.08mi |
| 1625 Olive St Baltimore, MD | 2.0 | 2.0 | 672 | $2,500 | $3.72 | 43d | 1 | 0.08mi |
| 1705 Olive St Baltimore, MD | 2.0 | 2.0 | 648 | $2,500 | $3.86 | 20d | 1 | 0.10mi |
| 1601 S Hanover St Apt 1R Baltimore, MD | 2.0 | 1.0 | 900 | $1,600 | $1.78 | 2d | 1 | 0.11mi |
| 1503 S Charles St Unit 2 Baltimore, MD | 2.0 | 2.0 | 1100 | $2,375 | $2.16 | 43d | 1 | 0.11mi |
| 1516 Clarkson St Baltimore, MD | 2.0 | 1.5 | 1050 | $1,795 | $1.71 | 24d | 1 | 0.19mi |
| 111 W Heath St Baltimore, MD | 2.0 | 1.0–2.5 | 1263 | $2,850 | $2.26 | 3d | 7 | 0.19mi |
| 1412 Light St Unit 2 Baltimore, MD | 1.0 | 1.0 | 800 | $1,700 | $2.12 | 2d | 1 | 0.20mi |
| 1900 S Hanover St Baltimore, MD | 3.0 | 1.0–2.0 | 875 | $3,119 | $3.56 | 1d | 66 | 0.22mi |
| 1403 Race St Baltimore, MD | 3.0 | 3.0 | 1008 | $2,200 | $2.18 | 43d | 1 | 0.25mi |
| 103 E Wells St Baltimore, MD | 1.0–2.0 | 1.0 | 1008 | $2,415 | $2.39 | 2d | 11 | 0.26mi |
| 1312 S Hanover St Apt 3 Baltimore, MD | 2.0 | 1.0 | 750 | $2,200 | $2.93 | 43d | 1 | 0.27mi |
| 1290 Battery Ave Baltimore, MD | 2.0 | 2.5 | 968 | $2,900 | $3.00 | 24d | 1 | 0.30mi |
| 126 Burnett St Baltimore, MD | 2.0 | 2.5 | 984 | $2,200 | $2.24 | 24d | 1 | 0.30mi |
| 1201 S Charles St Baltimore, MD | 2.0–3.0 | 2.0 | 1341 | $2,200 | $1.64 | 4d | 4 | 0.32mi |
| 1211 Light St Baltimore, MD | 2.0 | 2.0 | 921 | $2,172 | $2.36 | 24d | 1 | 0.32mi |
| 1265 Riverside Ave Unit 1st Floor Baltimore, MD | 1.0 | 1.0 | 700 | $1,350 | $1.93 | 24d | 1 | 0.35mi |
| 1125 Light St Baltimore, MD | 1.0 | 1.0 | 800 | $1,300 | $1.62 | 24d | 1 | 0.37mi |
| 101 W Cross St Baltimore, MD | 2.0 | 1.0–2.0 | 937 | $3,332 | $3.55 | 1d | 23 | 0.41mi |
| 1111 Light St Baltimore, MD | 2.0 | 1.0–2.0 | 982 | $2,449 | $2.49 | 4d | 13 | 0.43mi |
| 1026 Patapsco St Baltimore, MD | 2.0 | 2.0 | 1008 | $2,100 | $2.08 | 24d | 1 | 0.45mi |
| 1001 Light St Fl -2 Baltimore, MD | 1.0 | 1.0 | 861 | $1,350 | $1.57 | 24d | 1 | 0.50mi |
| 1001 Light St Fl -3 Baltimore, MD | 2.0 | 1.0 | 861 | $1,350 | $1.57 | 24d | 1 | 0.50mi |
| 400 E Cross St Baltimore, MD | 1.0 | 1.0 | 900 | $1,400 | $1.56 | 24d | 1 | 0.50mi |
| 250 Mission Blvd Baltimore, MD | 2.0 | 1.0–2.0 | 790 | $3,406 | $4.31 | 1d | 21 | 0.50mi |
| 1110 Key Hwy Baltimore, MD | 1.0–2.0 | 1.0–2.5 | 1197 | $3,696 | $3.09 | 1d | 33 | 0.52mi |
| 910 S Charles St Unit B Baltimore, MD | 2.0 | 1.0 | 700 | $1,700 | $2.43 | 17d | 1 | 0.54mi |
| 803 E Fort Ave Unit 1 Baltimore, MD | 2.0 | 1.0 | 1100 | $2,300 | $2.09 | 4d | 1 | 0.56mi |
| 2450 Rye St Baltimore, MD | 2.0 | 1.0–2.0 | 926 | $3,789 | $4.09 | 1d | 31 | 0.56mi |
| 301 Warren Ave Baltimore, MD | 1.0–3.0 | 1.0–2.5 | 1533 | $2,896 | $1.89 | 1d | 9 | 0.57mi |
| 23 Pierside Dr Baltimore, MD | 1.0–2.0 | 1.0–2.0 | 975 | $3,050 | $3.13 | 44d | 1 | 0.57mi |
| 23 Pierside Dr Baltimore, MD | 1.0–2.0 | 1.0–2.0 | 985 | $3,050 | $3.10 | 16d | 3 | 0.57mi |
| 1 E Montgomery St Unit 7 Baltimore, MD | 1.0 | 1.0 | 535 | $1,950 | $3.64 | 43d | 1 | 0.61mi |
| 2500 Insulator Dr Baltimore, MD | 3.0 | 1.0–2.0 | 988 | $3,816 | $3.86 | 2d | 152 | 0.62mi |
| 900 E Fort Ave Baltimore, MD | 2.0 | 1.0–2.0 | 836 | $3,684 | $4.40 | 2d | 18 | 0.68mi |
| 611 S Charles St Baltimore, MD | 2.0 | 1.0–2.0 | 823 | $2,905 | $3.53 | 1d | 8 | 0.71mi |
| 3 Andrew Pl Unit R98 Baltimore, MD | 2.0 | 2.0 | 975 | $2,100 | $2.15 | 12d | 1 | 0.84mi |
Listing history 9 events
-
2026-05-18$219,500 Active
-
2003-10-03soldstatus $157,500
-
2003-10-03soldstatus $157,500
-
2003-07-09soldstatus $157,500
-
2003-06-03historical
-
2003-05-09$157,500
-
2003-05-09historical
-
2003-02-04
-
2002-03-12soldstatus $130,000
ⓘ Source: listings_history table (triggers on properties + properties_extension) + one-shot
backfill from property_details.listing_events for pre-trigger history.
Tax reassessment forecast MD · Partial reset (capped growth)
- Current annual tax
- $5,217 · $435/mo
- Projected year-2 tax
- $5,217 · $435/mo
- Expected delta
- $0/yr ($0/mo · 0.0%)
ⓘ Screening estimate from a state-policy table — verify with the county assessor before closing.
Climate risk First Street
- Flood 1/10 Low FEMA zone X (unshaded) · 0% chance over 30 yrs
- Wildfire 1/10 Low
- Heat 8/10 Severe 7 d/yr ≥102°F today · 15 d/yr by 30 yrs out
- Wind 6/10 Major 27% chance of damaging wind over 30 yrs
- Air quality 4/10 Moderate 6 unhealthy d/yr today · 7 by 30 yrs out
Nearby sold comps map
Loading sold comps map…
Walkable amenities ~0.75 mi
Loading nearby amenities…
Taxation est. · year 1
- Rental income
- $26,615
- − Mortgage interest
- −$12,295
- − Property taxes
- −$5,217
- − Insurance
- −$1,098
- − Repairs & maintenance
- −$2,129
- − Management
- −$2,129
- − Depreciation
- −$6,385
- Taxable loss
- −$2,639
- Est. tax savings @ 24.0%
- +$633
- After-tax cash flow
- $1,531/yr
For passive investors: Depreciation is non-cash, so a rental often shows a tax loss while cash-flowing — sheltering income. Rental losses are passive: they offset passive income freely, and up to $25,000/yr can offset ordinary (W-2) income if you actively participate and your MAGI is under $100k (phasing out to $0 by $150k); unused losses carry forward. On sale, claimed depreciation is recaptured at up to 25%, and gains may owe capital-gains tax (a 1031 exchange can defer both). Figures are a year-1 estimate at your 24.0% rate — not tax advice; consult a CPA.
Schools (NCES district)
- District
- Baltimore City Public Schools
- NCES district ID
- 2400090
- Math proficiency
- 7% ▼ -9.00%
- Reading proficiency
- 16% ▼ -5.00%
- Median HH income
- $42,108
- Composite
- 10.08/100
- National rank
- #9805
- State rank
- #24 of 24 in MD
Livability — Baltimore
- Score
- 76/100
- State rank
- #90
- US rank
- #3396
Category grades
Schools grade is shown separately in the Schools card above.
Census & demographics
- Census place
- Baltimore, MD
- County
- Baltimore City · 558,601 people
- City population
- 588,727
- Metro
- Baltimore-Columbia-Towson, MD
- Population (ZIP)
- 32,977
- Household income
- $91,842
- Rent vs Own
- Severe rent burden
- 1463.0
Population outlook (Baltimore County) Hauer SSP2
- Today (2025)
- 624,249 people
- By 2030
- 621,541 · -0.4%
- By 2040
- 609,756 · -2.3%
- By 2050
- 597,249 · -4.3%
- By 2075
- 552,236 · -11.5%
- By 2100
- 513,934 · -17.7%
Race, ethnicity, and origin ACS 2023
- Neighborhood character
- Diverse neighborhood (Simpson 0.63)
- Race & ethnicity
- White 55% Black 23% Hispanic / Latino 13% Two or more races 6% Asian 4%
- Hispanic origin (detail)
- Mexican 1% Puerto Rican 1%
- Common ancestry
- Romanian 5% Lithuanian 2% Italian 2%
- Foreign-born
- 10% · Canada, China
- Languages at home
- 85% English-only · Spanish 9% Other Indo-European 1% Other Asian/Pacific 1%
Political lean MEDSL · Baltimore
- 2024 margin
- Solid D (+73.0) · D 85.2% · R 12.2% · Other 2.6%
- 2008→2024 swing
- -2.5pp toward R · 2008: 75.5pp · 2024: 73.0pp
- All cycles
- 2024: D+73.0 2020: D+76.6 2016: D+74.6 2012: D+76.4 2008: D+75.5
Not yet ingested
- Civics
- —
Market trends
- HPI YoY
- ▼ -311.43%
- Current HPI
- 284.338
- Rent YoY
- ▼ -1.00%
- Metro
- Baltimore-Columbia-Towson, MD
- State GDP YoY
- ▲ 2.97%
- F500 in state
- 12
Industry mix (Fortune 500 HQ in MD)
| Industry | F500 HQs | Revenue |
|---|---|---|
| Aerospace / Defense | 1 | $71B |
|
||
| Utilities | 1 | $25B |
|
||
| Hotels | 1 | $24B |
|
||
| Consumer Goods | 1 | $7B |
|
||
| Real Estate | 1 | $6B |
|
||
| Chemicals | 1 | $2B |
|
||
Price history
+68.8% since first listed9 events — show timeline
- 2026-05-18 Listed $219,500 BRIGHT MLS
- 2003-10-03 Sold (Public Records) $157,500 Public Records
- 2003-10-03 Sold (Public Records) $157,500 Public Records
- 2003-07-09 Sold (MLS) $157,500 MRIS
- 2003-06-03 Delisted — MRIS
- 2003-05-09 Delisted — MRIS
- 2003-05-09 Listed $157,500 MRIS
- 2003-02-04 Listed — MRIS
- 2002-03-12 Sold (Public Records) $130,000 Public Records
Property tax history
+0.2%/yrLatest (2025): $5,217 · +3.0% YoY. Source: county tax records.
Cash-flow waterfall
monthlySold comps — $/sqft
last 12 mo · ≤1 miLoading sold comps…