 Fourplex
2805 E Garfield Ave · Alton, TX
Flood risk 1/10 · Minimal
- FEMA flood zone
- X
- Chance of flooding over 30 yrs
- 0.0%
- Est. flood insurance / yr
- $507 – $1,088
Fire risk 5/10 · Moderate
- Est. fire insurance / yr
- $1,222 – $2,270
Heat risk 9/10 · Severe
- Hot days now (above 111°F)
- 7 days/yr
- Hot days in 30 yrs
- 22 days/yr
Wind risk 8/10 · Major
- Chance of severe wind over 30 yrs
- 99.0%
Air-quality risk 2/10 · Minimal
- Unhealthy air days now
- 0 days/yr
- Unhealthy air days in 30 yrs
- 1 days/yr
Risk factors via First Street. Map © Google.
Why this score? — see what drove the C+ grade
The composite is a weighted blend of 9 inputs, each scored 0–100. Each bar is that input's sub-score; the figure is the points it added to the 100-point composite (weight × sub-score).
- Cash flow +19.3/30.0
- Appreciation +10.0/10.0
- ARV discount +8.5/15.0
- DSCR +6.1/10.0
- 1% rule +5.3/10.0
- Condition / age +4.0/5.0
- Schools +3.4/10.0
- Rent growth +3.1/5.0
- Livability +2.9/5.0
$448,000
🖨 Deal sheet 📄 Offer letter ✓ Due diligence
Multi-family units
County records classify this as Multi-Family (2-4 Unit). Listing-text estimate: 4 units. confirmed
Listing remarks MLS
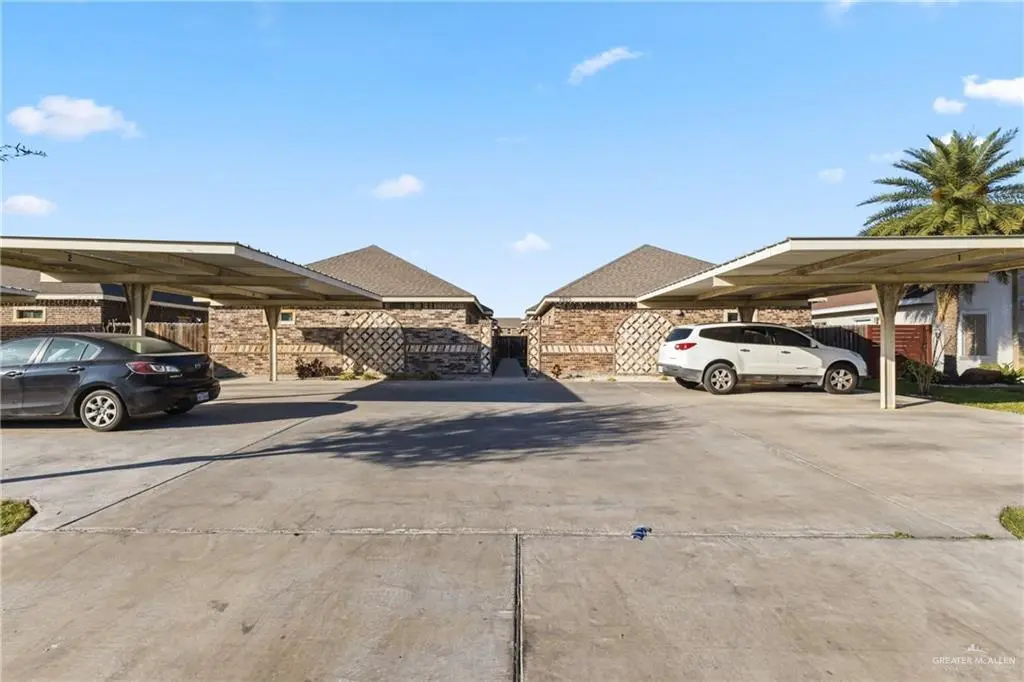
Exceptional investment opportunity featuring a fourplex built in 2018 and ideally located off Stewart Road in a high-demand rental area. Each unit offers three bedrooms, two bathrooms, open living spaces, tile flooring throughout, granite countertops, and a full appliance package including washer and dryer. Three units are currently occupied, providing immediate rental income, while one vacant unit offers flexibility for owner-occupancy or lease at market rate. Covered parking and a low-maintenance exterior enhance long-term efficiency. Located within Sharyland ISD and minutes from major roads, shopping, and dining, this property presents a strong opportunity for investors or buyers seeking to offset housing costs with rental income.
Key facts
- Open living spaces
- Fourplex
- Tile flooring
Tags
Neighborhood map
What this means for you Summary
Snapshot
- This is a 4 × 3-bed/2-bath units multifamily listed at $448k. Condition is rated good.
Deal economics
- At list price, monthly cash flow is $490 ($6k/yr) — positive. Per door: $122/mo.
- The deal already cash-flows at list — no discount required.
- Meets the 1% rule at list price ($5k rent vs $448k).
- Recommended offer: $408k (9.0% below list) — sets the bar for market timing.
- Cap rate 7.6% vs local median 2.6% in Alton — top-decile yield for the area; either an underpriced asset or a hidden risk that comps aren't pricing in. Stress-test before assuming the spread holds.
Location & tenants
- Location reads 58/100 on livability (#1,230 in TX) — a working-class tenant base; expect higher turnover. Strengths: cost of living A+, housing A; Watch: schools F, crime F, amenities F.
- Sharyland ISD (urban): math 34% / reading 44% proficiency, ranked #406 of 826 in TX (top 49%) — families likely to look elsewhere, expect single-tenant / working-renter base with shorter leases.
- Market conditions: Rents rising (+2.5%/yr); 623 active listings in the ZIP; 6 comparable units currently listed for rent nearby; rentals lingering (median 44d on market — plan ~5-8 weeks vacancy on turnover, expect pricing pressure); 83% of comp listings sitting > 30 days — soft ceiling on asking rent; 7,378 units permitted in Hidalgo County in 2024 (641 in 5+ unit buildings).
- At $4,592/mo this rent would consume 100% of the median local household income ($55k/yr) (locally 855% of renters already pay >50% of income on rent) — very limited rent-growth headroom before tenants either downsize or default.
Forward outlook
- In year one you build about $48k of equity ($3k loan paydown + $45k appreciation (10.0% local appreciation)).
- Hidalgo County population projected at +28% by 2050 — long-run rental-demand tailwind backs the buy-and-hold thesis.
- At projected returns (10.0% appreciation + 2.5% rent growth), your $125k cash investment doubles in ~3 years — after that, you're playing with house money.
- By year 2, paydown + projected appreciation supports a ~$77k cash-out refi (75% LTV) — recoverable capital for the next deal without selling this one.
Negotiation context
- It's been on market 111 days — a 9% lower offer ($408k) is reasonable based on typical stale-listing flexibility.
- 4 sale attempts with the ask held roughly flat each time — persistent listings suggest the price (not the market) is what's stuck; bring a comps-based counter.
Risks & watch-outs
- Climate carrying-cost: severe wind risk, 99% chance of damaging wind over 30y; moderate wildfire risk; extreme-heat days projected 7→22/yr by 2055 (HVAC capex compounding) — expect insurance premiums to compound above CPI over the hold.
Questions for the listing agent
- It's been on market 111 days. Have you received any prior offers? Is the seller open to a 9% concession, seller financing, or rate buy-down credit?
- Can we see the unit-by-unit rent roll, current vacancy, and any below-market leases? What's the average tenancy length?
- What capital expenditures (roof, boiler, parking lot, exteriors) have been made in the last 5 years, and what's planned in the next 2?
- What does the HOA fee cover, when was the last increase, and are there any pending special assessments or reserve-fund shortfalls?
- Why hasn't it sold? Are there any deal-killer items the seller is aware of (foundation, flood, title, zoning, code violations)?
- Is there a deadline driving the sale (1031 exchange, divorce, estate, relocation)? That informs how much negotiation room exists.
- Schools are F-rated, which usually means shorter tenancies and higher turnover. Who's the typical renter profile here, and what's been the actual vacancy rate?
- Crime grade is F in this area — have there been break-ins, vandalism, or insurance claims at this property in the last 3 years? What carrier currently insures it and at what premium?
- What's the average days-on-market for RENTAL listings here right now (not sales)? A rising rental-DOM trend means longer vacancies and softer asking-rent achievability than the comps imply.
- What's the recent tenant-quality profile in this submarket — average credit score on applications, eviction rate, late-payment / NSF rate, and stable-employment percentage? A property-management company in the area should have these aggregated.
- How much new apartment / multifamily construction is in the pipeline within 1–3 miles? Heavy new supply (>2% of stock underway) typically softens rents 12–24 months out; light construction supports rent growth.
Investment metrics
- 1% rule
- 1.03% ✓
- Cap rate
- 7.60%
- Cash-on-cash
- 4.68%
- DSCR
- 1.21
- GRM
- 8.1
CMA / ARV
- ARV (median comp)
- $458,182
- List price
- $448,000
- Delta
- -2.22%
- Verdict
- FAIR
- Comps
- 20 within 1.0 mi
Show comp detail 12 sales within ~0.75 mi
| Address | Dist | Beds/Ba | Sqft | Sold | Price | $/sf | Match |
|---|---|---|---|---|---|---|---|
| 2904 E Israel Ave | 0.22mi | —/— | 4,168 (-6%) | 4mo | $515,000 | $124 | 76 |
| 2612 E Israel Ave | 0.24mi | —/— | 4,168 (-6%) | 4mo | $515,000 | $124 | 75 |
| 2604 Israel Ave | 0.26mi | —/— | 4,032 (-9%) | 2mo | $499,000 | $124 | 71 |
| 2912 E Israel Ave | 0.21mi | —/— | 4,632 (+4%) | 16mo | $549,900 | $119 | 69 |
| 2709 E Israel Ave | 0.20mi | —/— | 4,032 (-9%) | 8mo | $515,000 | $128 | 68 |
| 2908 E Israel Ave | 0.28mi | —/— | 4,632 (+4%) | 17mo | $549,900 | $119 | 66 |
| 1417 S Xanthia St | 0.61mi | —/— | 4,216 (-5%) | 6mo | $489,000 | $116 | 58 |
| 1220 S Xanthia St | 0.52mi | —/— | 4,029 (-9%) | 8mo | $479,000 | $119 | 54 |
| 1300 S Yankton St | 0.57mi | —/— | 4,054 (-9%) | 7mo | $478,000 | $118 | 54 |
| 1221 S Yankton | 0.55mi | —/— | 4,029 (-9%) | 8mo | $479,000 | $119 | 53 |
| 206 N Linares St | 0.63mi | —/— | 4,080 (-8%) | 15mo | $400,000 | $98 | 44 |
| 1412 S Yankton St | 0.65mi | —/— | 4,054 (-9%) | 18mo | $498,000 | $123 | 40 |
Match score weights: distance 35% · size 25% · config 20% · recency 20%. Top-matched comps best support the ARV.
Projected returns pro-forma
10.0% appreciation · 2.45% rent growth · sell at horizon
- IRR
- 27.5%
- Equity multiple
- 3.17×
- Total profit
- $272,747
- Equity at exit
- $403,594
- IRR
- 23.8%
- Equity multiple
- 7.17×
- Total profit
- $773,843
- Equity at exit
- $870,365
Cash invested: $125,440 (down + closing). Projections, not guarantees.
Landlord ↔ Tenant lean methodology
- Overall (STATE)
- 87 Strongly Landlord-Friendly
- State Texas
- 87 Strongly Landlord-Friendly · R+5
- County
- — inherits STATE
- City
- — inherits STATE
ZIP-level market 78573
- Home prices YoY
- 8.0%
- Rents YoY
- 2.5%
- Active inventory
- 623
- Price-to-rent
- 32.5×
Monthly cashflow live
- Estimated rent
- $4,592 high interval (Pro) →
- Mortgage (P&I)
- −$2,349
- Tax est. 1.5%
- −$560 /mo · $6,720/yr
- Insurance
- −$187
- HOA
- −$42
- Vacancy / Maint / Mgmt
- −$964
- Net cashflow
- $490
Break-even live
4-unit breakdown (identical units grouped — click to expand)
| Units | Beds | Baths | Est. rent |
|---|---|---|---|
| 4× units | 3 | 2 | $4,592 |
| #1 | 3 | 2 | $1,148 |
| #2 | 3 | 2 | $1,148 |
| #3 | 3 | 2 | $1,148 |
| #4 | 3 | 2 | $1,148 |
| Total (4 units) | $4,592 | ||
UW: 25.0% down · 7.5% · 30yr · 1.5% tax · 5.0% vac · 8.0% maint · 8.0% mgmt
Financing live
Cash to close
- Down payment
- $112,000
- Closing costs
- $13,440
- Reserves months
- —
- Total cash needed
- —
Loan-product check · same deal, 3 products live
Conventional
25% down · 7.5% · 30yr
- Down + closing
- —
- Monthly P&I
- —
- Monthly cashflow
- —
- DSCR
- —
- Eligible?
- —
Personal DTI + credit; lowest rate.
DSCR
20% down · 8.5% · 30yr
- Down + closing
- —
- Monthly P&I
- —
- Monthly cashflow
- —
- DSCR
- —
- Eligible?
- —
No personal income docs; deal must DSCR.
Hard money
10% down · 12.0% · 12mo
- Down + closing
- —
- Monthly P&I
- —
- Monthly cashflow
- —
- DSCR
- —
- Eligible?
- —
Short-term bridge; refi at stabilization.
Rent comps 6 comps
| Address | Beds | Baths | Sqft | Rent | $/sqft | DOM | Units | Dist |
|---|---|---|---|---|---|---|---|---|
| 2703 E Garfield Ave Unit A Alton, TX | 3.0 | 2.0 | 4088 | $950 | $0.23 | 23d | 1 | 0.04mi |
| 2601 E Garfield Ave Unit 2 Alton, TX | 2.0 | 2.0 | 4292 | $975 | $0.23 | 43d | 1 | 0.08mi |
| 2904 E Israel Ave Unit A Alton, TX | 2.0 | 2.0 | 4172 | $1,200 | $0.29 | 43d | 1 | 0.23mi |
| 2612 E Israel Ave Unit A Alton, TX | 2.0 | 2.0 | 4172 | $1,200 | $0.29 | 43d | 1 | 0.24mi |
| 1100 S Stewart Blvd Alton, TX | 2.0 | 1.0 | 3991 | $959 | $0.24 | 43d | 1 | 0.27mi |
| 5704 Puffin Ave Unit 4 Palmhurst, TX | 2.0 | 2.0 | 4372 | $1,050 | $0.24 | 43d | 1 | 1.00mi |
HOA detail
- Monthly dues
- $42 · $504/yr
Listing history 24 events
-
2026-06-18days on market $448,000 Active 111 DOM
-
2026-06-17days on market $448,000 Active 110 DOM
-
2026-06-16days on market $448,000 Active 109 DOM
-
2026-06-15days on market $448,000 Active 108 DOM
-
2026-06-14days on market $448,000 Active 106 DOM
-
2026-06-10days on market $448,000 Active 103 DOM
-
2026-06-09days on market $448,000 Active 102 DOM
-
2026-06-08days on market $448,000 Active 101 DOM
-
2026-06-07days on market $448,000 Active 100 DOM
-
2026-06-03days on market $448,000 Active 96 DOM
-
2026-06-02days on market $448,000 Active 95 DOM
-
2026-06-01days on market $448,000 Active 94 DOM
-
2026-05-31days on market $448,000 Active 93 DOM
-
2026-05-31days on market $448,000 Active 92 DOM
-
2026-02-27$448,000 Active 743-char remark
Show marketing remark (743 chars)
Exceptional investment opportunity featuring a fourplex built in 2018 and ideally located off Stewart Road in a high-demand rental area. Each unit offers three bedrooms, two bathrooms, open living spaces, tile flooring throughout, granite countertops, and a full appliance package including washer and dryer. Three units are currently occupied, providing immediate rental income, while one vacant unit offers flexibility for owner-occupancy or lease at market rate. Covered parking and a low-maintenance exterior enhance long-term efficiency. Located within Sharyland ISD and minutes from major roads, shopping, and dining, this property presents a strong opportunity for investors or buyers seeking to offset housing costs with rental income.
-
2025-11-11$450,000 Active
-
2025-10-02price $450,000
-
2025-08-28status Active
-
2025-08-28price $455,000
-
2025-08-08status Pending
-
2025-07-29historical Option
-
2025-07-24price $470,000
-
2025-06-03price $495,000
-
2025-05-07$515,000 Active
ⓘ Source: listings_history table (triggers on properties + properties_extension) + one-shot
backfill from property_details.listing_events for pre-trigger history.
Climate risk First Street
- Flood 1/10 Low FEMA zone X · 0% chance over 30 yrs
- Wildfire 5/10 Major
- Heat 9/10 Extreme 7 d/yr ≥111°F today · 22 d/yr by 30 yrs out
- Wind 8/10 Severe 99% chance of damaging wind over 30 yrs
- Air quality 2/10 Low 0 unhealthy d/yr today · 1 by 30 yrs out
Nearby sold comps map
Loading sold comps map…
Walkable amenities ~0.75 mi
Loading nearby amenities…
Taxation est. · year 1
- Rental income
- $55,104
- − Mortgage interest
- −$25,095
- − Property taxes
- −$6,720
- − Insurance
- −$2,240
- − Repairs & maintenance
- −$4,408
- − Management
- −$4,408
- − HOA
- −$504
- − Depreciation
- −$13,033
- Taxable loss
- −$1,304
- Est. tax savings @ 24.0%
- +$313
- After-tax cash flow
- $6,189/yr
For passive investors: Depreciation is non-cash, so a rental often shows a tax loss while cash-flowing — sheltering income. Rental losses are passive: they offset passive income freely, and up to $25,000/yr can offset ordinary (W-2) income if you actively participate and your MAGI is under $100k (phasing out to $0 by $150k); unused losses carry forward. On sale, claimed depreciation is recaptured at up to 25%, and gains may owe capital-gains tax (a 1031 exchange can defer both). Figures are a year-1 estimate at your 24.0% rate — not tax advice; consult a CPA.
Condition & rehab AI · 12 photos
This fourplex is in good condition with recent renovations, offering a strong investment opportunity in a high-demand rental area.
Value-add opportunities
- Both Paint exterior and interior walls — Fresh paint enhances curb appeal and interior aesthetics
- Both Replace blinds with energy-efficient windows — Improved energy efficiency and better light control
- Both Install smart home devices — Enhances convenience and marketability
Renovation cost estimate screening
Value-add ROI direction
- Both Paint exterior and interior walls — Fresh paint enhances curb appeal and interior aesthetics ↑
- Both Replace blinds with energy-efficient windows — Improved energy efficiency and better light control ↑
- Both Install smart home devices — Enhances convenience and marketability ↑
ⓘ Cost ranges are severity-bucket heuristics (US national rule-of-thumb). Get contractor quotes + a written scope before underwriting a rehab budget.
Schools (NCES district)
- District
- Sharyland ISD
- NCES district ID
- 4839930
- Math proficiency
- 34% ▼ -35.00%
- Reading proficiency
- 44% ▼ -15.00%
- Median HH income
- $57,792
- Composite
- 34.38/100
- National rank
- #5214
- State rank
- #406 of 826 in TX
Livability — Alton
- Score
- 58/100
- State rank
- #1230
- US rank
- #21479
Category grades
Schools grade is shown separately in the Schools card above.
Census & demographics
- Census place
- Alton, TX
- County
- Hidalgo County · 623,128 people
- City population
- 44,809
- Metro
- McAllen-Edinburg-Mission, TX
- Population (ZIP)
- 44,809
- Household income
- $55,000
- Rent vs Own
- Severe rent burden
- 855.0
Population outlook (Hidalgo County) Hauer SSP2
- Today (2025)
- 955,232 people
- By 2030
- 1,009,774 · +5.7%
- By 2040
- 1,120,332 · +17.3%
- By 2050
- 1,225,036 · +28.2%
- By 2075
- 1,439,189 · +50.7%
- By 2100
- 1,533,429 · +60.5%
Race, ethnicity, and origin ACS 2023
- Neighborhood character
- Predominantly Hispanic (96%)
- Race & ethnicity
- Hispanic / Latino 96% Two or more races 63% White 3%
- Hispanic origin (detail)
- Mexican 94%
- Foreign-born
- 28% · Canada
- Languages at home
- 12% English-only · Spanish 88%
Political lean MEDSL · Hidalgo
- 2024 margin
- Toss-up / Even · D 48.1% · R 51.0%
- 2008→2024 swing
- -41.6pp toward R · 2008: 38.7pp · 2024: -2.9pp
- All cycles
- 2024: R+2.9 2020: D+17.1 2016: D+40.5 2012: D+41.8 2008: D+38.7
Not yet ingested
- Civics
- —
Market trends
- HPI YoY
- ▲ 17.95%
- Current HPI
- 242.0711
- Rent YoY
- ▲ 2.45%
- Metro
- McAllen-Edinburg-Mission, TX
- State GDP YoY
- ▲ 3.95%
- F500 in state
- 110
Industry mix (Fortune 500 HQ in TX)
| Industry | F500 HQs | Revenue |
|---|---|---|
| Energy | 16 | $1,198B |
|
||
| Technology | 5 | $198B |
|
||
| Engineering / Construction | 4 | $72B |
|
||
| Energy Services | 3 | $60B |
|
||
| Utilities | 3 | $41B |
|
||
| Healthcare | 2 | $330B |
|
||
Price history
-13.0% since first listed10 events — show timeline
- 2026-02-27 Listed $448,000 MCALLENMLS
- 2025-11-11 Listed $450,000 MCALLENMLS
- 2025-10-02 Price Changed $450,000 MCALLENMLS
- 2025-08-28 Relisted — MCALLENMLS
- 2025-08-28 Price Changed $455,000 MCALLENMLS
- 2025-08-08 Pending — MCALLENMLS
- 2025-07-29 Contingent — MCALLENMLS
- 2025-07-24 Price Changed $470,000 MCALLENMLS
- 2025-06-03 Price Changed $495,000 MCALLENMLS
- 2025-05-07 Listed $515,000 MCALLENMLS
Cash-flow waterfall
monthlySold comps — $/sqft
last 12 mo · ≤1 miLoading sold comps…