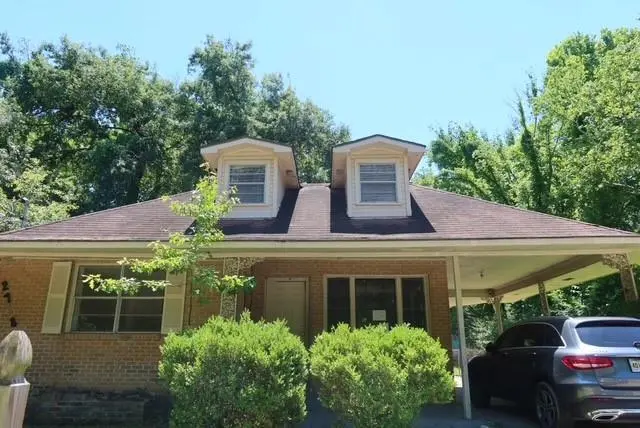
2758 Badley Rd · Baton Rouge, LA
Flood risk 1/10 · Minimal
- FEMA flood zone
- X (unshaded)
- Chance of flooding over 30 yrs
- 0.0%
- Est. flood insurance / yr
- $507 – $1,088
Fire risk 1/10 · Minimal
- Est. fire insurance / yr
- $1,269 – $2,357
Heat risk 8/10 · Major
- Hot days now (above 108°F)
- 7 days/yr
- Hot days in 30 yrs
- 20 days/yr
Wind risk 9/10 · Severe
- Chance of severe wind over 30 yrs
- 99.0%
Air-quality risk 2/10 · Minimal
- Unhealthy air days now
- 1 days/yr
- Unhealthy air days in 30 yrs
- 1 days/yr
Risk factors via First Street. Map © Google.
Why this score? — see what drove the B grade
The composite is a weighted blend of 9 inputs, each scored 0–100. Each bar is that input's sub-score; the figure is the points it added to the 100-point composite (weight × sub-score).
- Cash flow +30.0/30.0
- 1% rule +10.0/10.0
- DSCR +10.0/10.0
- ARV discount +7.5/15.0
- Appreciation +4.6/10.0
- Livability +3.7/5.0
- Rent growth +2.5/5.0
- Condition / age +2.5/5.0
- Schools +2.4/10.0
$64,900
🖨 Deal sheet (PDF) 📄 Offer letter ✓ Due diligence
Listing remarks MLS
Great Investment Opportunity! Located just minutes from Southern University, and convenient access to I-110 and I-10 and public transportation. This three-bedroom, one-and-a-half-bath home is great for first time homeowners looking for a light fixer-upper or investors looking for a flip with only minimal updates needed. Don't miss your chance and schedule today!
Key facts
- Parking
- Built 1953
- Listed 24 days
Tags
Property features AI
Exterior
- Parking: One parking space
- Utilities: Public water; Public sewer
- Home design: Raised foundation
- Construction: Brick construction; Asphalt roof
- Exterior features: Outside city limits; Rectangular lot
Interior
- Bathrooms: 1 full bathroom; 1 half bathroom
- Interior features: Total of 4 rooms; Property in poor condition
Neighborhood map
What this means for you Summary
Snapshot
- This is a 3-bed/1.5-bath single-family listed at $65k.
Deal economics
- At list price, monthly cash flow is $698 ($8k/yr) — positive.
- The deal already cash-flows at list — no discount required.
- Meets the 1% rule at list price ($1k rent vs $65k).
- Recommended offer: $64k (1.5% below list) — sets the bar for market timing.
- Cap rate 19.2% vs local median 4.2% in Baton Rouge — top-decile yield for the area; either an underpriced asset or a hidden risk that comps aren't pricing in. Stress-test before assuming the spread holds.
Location & tenants
- Location reads 74/100 on livability (#24 in LA, #4,535 nationally) — a middle-class / working-renter tenant base. Strengths: commute A+, cost of living A+, health & safety A+; Watch: amenities D, crime F, employment D-.
- East Baton Rouge Parish (urban): math 22% / reading 34% proficiency, ranked #47 of 98 in LA (top 48%) — low school quality limits family demand, transient renter base, plan for 1-2y turnover; 77% free/reduced lunch — lower-income household profile, screen leases tightly.
- Zoned schools: Belfair Montessori School (math 27% / reading 47%, grade F, #251 of 646 statewide, top 41%, 264 students, 69% FRL); Park Forest Middle School (math 3% / reading 12%, grade F, #207 of 218 statewide, top 95%, 582 students, 78% FRL); Liberty High School (math 50% / reading 74%, grade B-, #15 of 265 statewide, top 6%, 1,208 students, 60% FRL).
- Market conditions: 102 active listings in the ZIP; 7 comparable units currently listed for rent nearby; rentals at typical pace (median 25d on market — plan ~3-4 weeks tenant-placement turnaround); lower-income renter base — watch delinquency; 2,252 units permitted in East Baton Rouge Parish in 2024 (440 in 5+ unit buildings).
- At $1,442/mo this rent would consume 63% of the median local household income ($28k/yr) (locally 1092% of renters already pay >50% of income on rent) — very limited rent-growth headroom before tenants either downsize or default.
Forward outlook
- Local home prices are declining (-0.9%/yr); year-one equity from $449 of loan paydown is wiped out by about $565 of value loss. Plan a longer hold.
- East Baton Rouge County population projected at +4% by 2050 — modest demand growth; plan on rents tracking national, not racing it.
- At projected returns (-0.9% appreciation + 3.0% rent growth), your $18k cash investment doubles in ~3 years — after that, you're playing with house money.
Negotiation context
- It's been on market 24 days — a 2% lower offer ($64k) is reasonable based on typical stale-listing flexibility.
- 15 sale attempts since 14y ago with the ask held roughly flat each time — persistent listings suggest the price (not the market) is what's stuck; bring a comps-based counter.
Risks & watch-outs
- Watch-outs: built in 1953 — expect roof / HVAC / electrical / plumbing capex.
- Climate carrying-cost: severe wind risk, 99% chance of damaging wind over 30y; extreme-heat days projected 7→20/yr by 2055 (HVAC capex compounding) — expect insurance premiums to compound above CPI over the hold.
Questions for the listing agent
- Built in 1953 — when were the roof, HVAC, electrical panel, plumbing, and water heater last replaced?
- Is there a deadline driving the sale (1031 exchange, divorce, estate, relocation)? That informs how much negotiation room exists.
- Crime grade is F in this area — have there been break-ins, vandalism, or insurance claims at this property in the last 3 years? What carrier currently insures it and at what premium?
- What's the average days-on-market for RENTAL listings here right now (not sales)? A rising rental-DOM trend means longer vacancies and softer asking-rent achievability than the comps imply.
- What's the recent tenant-quality profile in this submarket — average credit score on applications, eviction rate, late-payment / NSF rate, and stable-employment percentage? A property-management company in the area should have these aggregated.
- How much new for-sale + rental construction is in the pipeline within 1–3 miles? Heavy new supply typically softens prices + rents 12–24 months out; constrained supply supports both.
Investment metrics
- 1% rule
- 2.22% ✓
- Cap rate
- 19.21%
- Cash-on-cash
- 46.13%
- DSCR
- 3.05
- GRM
- 3.7
CMA / ARV
- ARV (on-the-fly)
- $139,600
- Comps found
- 10
Show comp detail 10 sales within ~0.75 mi
| Address | Dist | Beds/Ba | Sqft | Sold | Price | $/sf | Match |
|---|---|---|---|---|---|---|---|
| 2635 79th Ave | 0.26mi | 3/1.0 | 1,412 (+1%) | 7mo | $143,000 | $101 | 78 |
| 2461 Lark St | 0.18mi | 3/2.0 | 1,300 (-7%) | 2mo | $164,000 | $126 | 77 |
| 2624 78th Ave | 0.36mi | 3/2.0 | 1,424 (+2%) | 18mo | $138,000 | $97 | 63 |
| 2435 Lark St | 0.21mi | 3/1.0 | 1,284 (-8%) | 16mo | $39,900 | $31 | 62 |
| 2423 Lark St | 0.22mi | 3/1.5 | 1,247 (-11%) | 20mo | $49,900 | $40 | 56 |
| 2785 75th Ave | 0.45mi | 3/2.0 | 1,446 (+4%) | 21mo | $144,000 | $100 | 54 |
| 1881 Snipe St | 0.53mi | 4/2.0 (+1) | 1,300 (-7%) | 10mo | $40,000 | $31 | 49 |
| 2756 74th Ave | 0.53mi | 4/2.0 (+1) | 1,220 (-13%) | 9mo | $155,000 | $127 | 40 |
| 1970 78th Ave | 0.58mi | 3/2.0 | 1,527 (+9%) | 19mo | $175,000 | $115 | 39 |
| 2430 Mcban Cir | 0.46mi | 3/1.5 | 1,225 (-12%) | 23mo | $70,000 | $57 | 39 |
Match score weights: distance 35% · size 25% · config 20% · recency 20%. Top-matched comps best support the ARV.
Projected returns pro-forma
-0.87% appreciation · 3.0% rent growth · sell at horizon
- IRR
- 46.3%
- Equity multiple
- 3.20×
- Total profit
- $39,995
- Equity at exit
- $16,068
- IRR
- 49.9%
- Equity multiple
- 6.39×
- Total profit
- $97,859
- Equity at exit
- $17,217
Cash invested: $18,172 (down + closing). Projections, not guarantees.
Landlord ↔ Tenant lean methodology
- Overall (STATE)
- 90 Strongly Landlord-Friendly
- State Louisiana
- 90 Strongly Landlord-Friendly · R+12
- County
- — inherits STATE
- City
- — inherits STATE
ZIP-level market 70807
- Home prices YoY
- -1.1%
- Active inventory
- 102
- Price-to-rent
- 3.7×
Monthly cashflow live
- Estimated rent
- $1,442 high interval (Pro) →
- Mortgage (P&I)
- −$340
- Tax from tax record
- −$74 /mo · $884/yr
- Insurance
- −$27
- HOA
- −$0
- Vacancy / Maint / Mgmt
- −$303
- Net cashflow
- $698
Break-even live
Sensitivity live
| Price | -10% $735 | -5% $717 | +0% $698 | +5% $680 | +10% $662 |
|---|---|---|---|---|---|
| Rent | -10% $585 | -5% $642 | +0% $698 | +5% $755 | +10% $812 |
| Rate | -1.0pp $731 | -0.5pp $715 | base $698 | +0.5pp $682 | +1.0pp $665 |
UW: 25.0% down · 7.5% · 30yr · 1.5% tax · 5.0% vac · 8.0% maint · 8.0% mgmt
Financing live
Cash to close
- Down payment
- $16,225
- Closing costs
- $1,947
- Reserves months
- —
- Total cash needed
- —
Loan-product check · same deal, 3 products live
Conventional
25% down · 7.5% · 30yr
- Down + closing
- —
- Monthly P&I
- —
- Monthly cashflow
- —
- DSCR
- —
- Eligible?
- —
Personal DTI + credit; lowest rate.
DSCR
20% down · 8.5% · 30yr
- Down + closing
- —
- Monthly P&I
- —
- Monthly cashflow
- —
- DSCR
- —
- Eligible?
- —
No personal income docs; deal must DSCR.
Hard money
10% down · 12.0% · 12mo
- Down + closing
- —
- Monthly P&I
- —
- Monthly cashflow
- —
- DSCR
- —
- Eligible?
- —
Short-term bridge; refi at stabilization.
Rent comps 7 comps
| Address | Beds | Baths | Sqft | Rent | $/sqft | DOM | Units | Dist |
|---|---|---|---|---|---|---|---|---|
| 1945 77th Ave Baton Rouge, LA | 3.0 | 2.0 | 1416 | $1,650 | $1.17 | 25d | 1 | 0.65mi |
| 2127 71st Ave Baton Rouge, LA | 4.0 | 2.0 | 1734 | $1,600 | $0.92 | 25d | 1 | 0.80mi |
| 1848 73rd Ave Baton Rouge, LA | 4.0 | 2.0 | 1139 | $1,600 | $1.40 | 16d | 1 | 0.86mi |
| 1648 Kildeer St Baton Rouge, LA | 3.0 | 2.0 | 1450 | $1,025 | $0.71 | 23d | 1 | 1.24mi |
| 4540 Crown Ave Unit 94 Baton Rouge, LA | 2.0 | 1.0 | 1000 | $1,098 | $1.10 | 45d | 1 | 1.27mi |
| 4540 Crown Ave Unit 94 Baton Rouge, LA | 2.0 | 1.0 | 1000 | $900 | $0.90 | 25d | 1 | 1.27mi |
| 4540 Crown Ave Unit 91 Baton Rouge, LA | 2.0 | 1.0 | 1000 | $950 | $0.95 | 21d | 1 | 1.27mi |
Listing history 49 events
-
2026-06-22days on market $64,900 Active 24 DOM
-
2026-06-18days on market $64,900 Active 21 DOM
-
2026-06-17days on market $64,900 Active 20 DOM
-
2026-06-16days on market $64,900 Active 19 DOM
-
2026-06-15days on market $64,900 Active 18 DOM
-
2026-06-14days on market $64,900 Active 16 DOM
-
2026-06-10days on market $64,900 Active 13 DOM
-
2026-06-09days on market $64,900 Active 12 DOM
-
2026-06-08days on market $64,900 Active 11 DOM
-
2026-06-07days on market $64,900 Active 10 DOM
-
2026-06-05days on market $64,900 Active 7 DOM
-
2026-06-03days on market $64,900 Active 6 DOM
-
2026-06-02days on market $64,900 Active 5 DOM
-
2026-06-01days on market $64,900 Active 4 DOM
-
2026-05-31days on market $64,900 Active 3 DOM
-
2026-05-31days on market $64,900 Active 2 DOM
-
2026-01-07price $64,900
-
2026-01-07price $64,900
-
2026-01-05price $64,000
-
2026-01-05price $64,000
-
2025-12-29status Active
-
2025-11-29price $69,900
-
2025-11-12price $69,900
-
2025-10-28price $74,900
-
2025-10-28price $74,900
-
2025-08-30price $79,900
-
2025-08-30price $79,900
-
2025-07-31$84,900 Active
-
2025-07-30$84,900 Active
-
2024-08-11historical $1,000
-
2024-07-23$1,000
-
2024-01-26historical
-
2023-12-30price $89,900
-
2023-12-07status Active
-
2023-11-30status Pending
-
2023-06-08historical
-
2023-05-08$99,900 Active
-
2023-05-08$89,900
-
2018-11-20historical
-
2018-11-14price $69,900
-
2018-10-03price $74,900
-
2018-07-31price $79,900
-
2018-07-17price $85,900
-
2018-07-02$89,900 Active
-
2018-07-02$69,900
-
2013-08-28$58,000
-
2013-08-28$58,000
-
2012-08-22$58,000
-
2012-08-22$58,000
ⓘ Source: listings_history table (triggers on properties + properties_extension) + one-shot
backfill from property_details.listing_events for pre-trigger history.
Tax reassessment forecast LA · Resets to sale price
- Current annual tax
- $884 · $74/mo
- Projected year-2 tax
- $884 · $74/mo
- Expected delta
- $0/yr ($0/mo · 0.0%)
ⓘ Screening estimate from a state-policy table — verify with the county assessor before closing.
Climate risk First Street
- Flood 1/10 Low FEMA zone X (unshaded) · 0% chance over 30 yrs
- Wildfire 1/10 Low
- Heat 8/10 Severe 7 d/yr ≥108°F today · 20 d/yr by 30 yrs out
- Wind 9/10 Extreme 99% chance of damaging wind over 30 yrs
- Air quality 2/10 Low 1 unhealthy d/yr today · 1 by 30 yrs out
Nearby sold comps map
Loading sold comps map…
Walkable amenities ~0.75 mi
Loading nearby amenities…
Taxation est. · year 1
- Rental income
- $17,310
- − Mortgage interest
- −$3,635
- − Property taxes
- −$884
- − Insurance
- −$324
- − Repairs & maintenance
- −$1,385
- − Management
- −$1,385
- − Depreciation
- −$1,888
- Taxable income
- $7,808
- Est. tax owed @ 24.0%
- −$1,874
- After-tax cash flow
- $6,508/yr
For passive investors: Depreciation is non-cash, so a rental often shows a tax loss while cash-flowing — sheltering income. Rental losses are passive: they offset passive income freely, and up to $25,000/yr can offset ordinary (W-2) income if you actively participate and your MAGI is under $100k (phasing out to $0 by $150k); unused losses carry forward. On sale, claimed depreciation is recaptured at up to 25%, and gains may owe capital-gains tax (a 1031 exchange can defer both). Figures are a year-1 estimate at your 24.0% rate — not tax advice; consult a CPA.
Schools (NCES district)
- District
- East Baton Rouge Parish
- NCES district ID
- 2200540
- Math proficiency
- 22% ▼ -36.00%
- Reading proficiency
- 34% ▼ -31.00%
- Median HH income
- $46,263
- Composite
- 24.14/100
- National rank
- #7745
- State rank
- #47 of 98 in LA
Livability — Baton Rouge
- Score
- 74/100
- State rank
- #24
- US rank
- #4535
Category grades
Schools grade is shown separately in the Schools card above.
Census & demographics
- Census place
- Baton Rouge, LA
- County
- East Baton Rouge Parish · 399,686 people
- City population
- 351,868
- Metro
- Baton Rouge, LA
- Population (ZIP)
- 15,300
- Household income
- $27,534
- Rent vs Own
- Severe rent burden
- 1092.0
Population outlook (East Baton Rouge County) Hauer SSP2
- Today (2025)
- 464,810 people
- By 2030
- 472,137 · +1.6%
- By 2040
- 480,243 · +3.3%
- By 2050
- 484,422 · +4.2%
- By 2075
- 492,069 · +5.9%
- By 2100
- 476,347 · +2.5%
Race, ethnicity, and origin ACS 2023
- Neighborhood character
- Predominantly Black (91%)
- Race & ethnicity
- Black 91% Two or more races 6% White 3%
- Common ancestry
- Lithuanian 1%
- Foreign-born
- 1% · Canada
Political lean MEDSL · East Baton Rouge
- 2024 margin
- D (+11.1) · D 54.5% · R 43.4% · Other 2.1%
- 2008→2024 swing
- +8.9pp toward D · 2008: 2.2pp · 2024: 11.1pp
- All cycles
- 2024: D+11.1 2020: D+13.1 2016: D+9.2 2012: D+5.2 2008: D+2.2
Not yet ingested
- Civics
- —
Market trends
- HPI YoY
- ▼ -0.87%
- Current HPI
- 78.3629
- Rent YoY
- —
- Metro
- Baton Rouge, LA
- State GDP YoY
- ▲ 3.29%
- F500 in state
- 10
Industry mix (Fortune 500 HQ in LA)
| Industry | F500 HQs | Revenue |
|---|---|---|
| Telecommunications | 2 | $23B |
|
||
| Utilities | 1 | $12B |
|
||
| Wholesale / Distribution | 1 | $5B |
|
||
| Advertising | 1 | $2B |
|
||
Price history
+11.9% since first listed35 events — show timeline
- 2026-05-27 Listed $64,900 GSREIN
- 2026-05-27 Listed $64,900 AcadianaMLS
- 2026-01-07 Price Changed $64,900 AcadianaMLS
- 2026-01-07 Price Changed $64,900 GBRMLS
- 2026-01-05 Price Changed $64,000 AcadianaMLS
- 2026-01-05 Price Changed $64,000 GBRMLS
- 2025-12-29 Relisted — GBRMLS
- 2025-11-29 Price Changed $69,900 AcadianaMLS
- 2025-11-12 Price Changed $69,900 GBRMLS
- 2025-10-28 Price Changed $74,900 AcadianaMLS
- 2025-10-28 Price Changed $74,900 GBRMLS
- 2025-08-30 Price Changed $79,900 AcadianaMLS
- 2025-08-30 Price Changed $79,900 GBRMLS
- 2025-07-31 Listed $84,900 GBRMLS
- 2025-07-30 Listed $84,900 AcadianaMLS
- 2024-08-11 Rental Removed $1,000 BUILDIUM
- 2024-07-23 Listed for Rent $1,000 BUILDIUM
- 2024-01-26 Delisted — GBRMLS
- 2023-12-30 Price Changed $89,900 GBRMLS
- 2023-12-07 Relisted — GBRMLS
- 2023-11-30 Pending — GBRMLS
- 2023-06-08 Rental Removed — BUILDIUM
- 2023-05-08 Listed $89,900 AcadianaMLS
- 2023-05-08 Listed $99,900 GBRMLS
- 2018-11-20 Delisted — GBRMLS
- 2018-11-14 Price Changed $69,900 GBRMLS
- 2018-10-03 Price Changed $74,900 GBRMLS
- 2018-07-31 Price Changed $79,900 GBRMLS
- 2018-07-17 Price Changed $85,900 GBRMLS
- 2018-07-02 Listed $69,900 AcadianaMLS
- 2018-07-02 Listed $89,900 GBRMLS
- 2013-08-28 Listed $58,000 AcadianaMLS
- 2013-08-28 Listed $58,000 GBRMLS
- 2012-08-22 Listed $58,000 AcadianaMLS
- 2012-08-22 Listed $58,000 GBRMLS
Property tax history
+2.4%/yrLatest (2025): $884 · +4.7% YoY. Source: county tax records.
Cash-flow waterfall
monthlySold comps — $/sqft
last 12 mo · ≤1 miLoading sold comps…