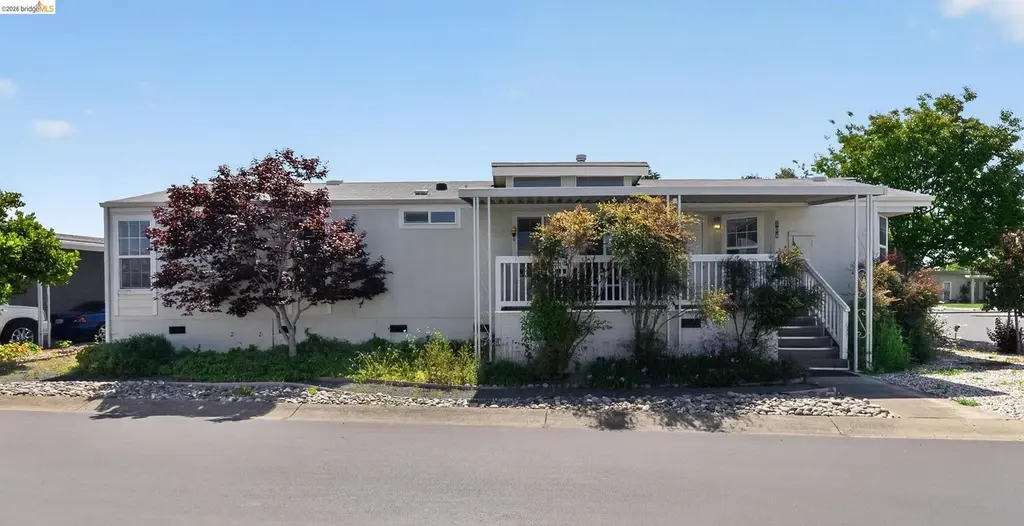
108 Palm Dr · Union City, CA
Flood risk 3/10 · Minor
- FEMA flood zone
- X (unshaded)
- Chance of flooding over 30 yrs
- 0.18%
- Est. flood insurance / yr
- $507 – $1,088
Fire risk 1/10 · Minimal
- Est. fire insurance / yr
- $659 – $1,223
Heat risk 4/10 · Minor
- Hot days now (above 90°F)
- 7 days/yr
- Hot days in 30 yrs
- 14 days/yr
Wind risk 1/10 · Minimal
- Chance of severe wind over 30 yrs
- —
Air-quality risk 7/10 · Major
- Unhealthy air days now
- 12 days/yr
- Unhealthy air days in 30 yrs
- 12 days/yr
Risk factors via First Street. Map © Google.
Why this score? — see what drove the C+ grade
The composite is a weighted blend of 9 inputs, each scored 0–100. Each bar is that input's sub-score; the figure is the points it added to the 100-point composite (weight × sub-score).
- Cash flow +29.9/30.0
- DSCR +10.0/10.0
- 1% rule +7.1/10.0
- Schools +5.1/10.0
- Livability +3.7/5.0
- Rent growth +3.4/5.0
- Condition / age +2.5/5.0
- ARV discount +0.0/15.0
- Appreciation +0.0/10.0
$305,000
🖨 Deal sheet 📄 Offer letter ✓ Due diligence
Listing remarks
Welcome to 108 Palm Drive in the highly desirable The Tropics Mobile Home Park — a vibrant 55+ community with resort-style amenities and tropical-inspired charm. Situated on a desirable corner lot near ample guest parking, this home is conveniently located close to the clubhouse, pool, spa, shopping, dining, and easy access to Hwy 880. This spacious and well-maintained home offers a bright, inviting floor plan with generous living spaces and abundant natural light. Features include a functional kitchen with ample cabinetry, a spacious primary suite, indoor laundry, covered parking, outdoor storage, and a relaxing patio area perfect for enjoying the Bay Area weather. Enjoy comfortable
Key facts
- Guest parking
- Functional kitchen
- Clubhouse
Tags
Property features AI
Finance
- Other: Located in THE TROPICS park
- HOA & community: Pets allowed with size limits; Community amenities: clubhouse, pool, greenbelt, putting green, guest parking, organized activities
Exterior
- Parking: Covered parking
- Utilities: Public water; Public sewer
- Home design: Manufactured in-park home; Mobile home (double wide); 1,404 square feet living area; Senior community
- Construction: Stucco, wood shingles and wood siding exterior; Double wide body type
- Exterior features: Covered patio/porch; Corner lot; Community pool; Clubhouse; Greenbelt; Putting green; Guest parking; Activities available
Interior
- Kitchen: Dishwasher; Gas range / cooktop; Microwave; Refrigerator
- Bedrooms: 2 bedrooms; Primary bedroom suite on main entry level
- Flooring: Linoleum; Carpet
- Bathrooms: 2 full bathrooms
- Heating & cooling: Floor furnace heating; Central air; Ceiling fans
- Interior features: Dining area; Storage; Double pane windows; Window coverings; Gas fireplace in the living room
- Laundry & utility: Laundry room; Washer and dryer included
Neighborhood map
What this means for you Summary
Snapshot
- This is a 3-bed/2.0-bath manufactured listed at $305k.
Deal economics
- At list price, monthly cash flow is $1k ($14k/yr) — positive.
- The deal already cash-flows at list — no discount required.
- Meets the 1% rule at list price ($4k rent vs $305k).
- Cap rate 10.7% vs local median 1.8% in Union City — top-decile yield for the area; either an underpriced asset or a hidden risk that comps aren't pricing in. Stress-test before assuming the spread holds.
Location & tenants
- Location reads 73/100 on livability (#150 in CA) — a middle-class / working-renter tenant base. Strengths: commute A+, employment A+, health & safety A+; Watch: crime D, amenities D, cost of living F.
- New Haven Unified (suburban): math 43% / reading 69% proficiency, ranked #85 of 517 in CA (top 16%) — acceptable for families but not a draw, mixed tenant base, ~2y average lease.
- Market conditions: Rents rising (+3.5%/yr); 145 active listings in the ZIP; 19 comparable units currently listed for rent nearby; rentals leasing fast (median 6d on market — plan ~1-2 weeks tenant-placement turnaround); high-income renter base; 1,742 units permitted in Alameda County in 2024 (856 in 5+ unit buildings).
- This rent runs 33% of the median local income ($134k/yr) — at the standard rent-burdened threshold; future hikes will face affordability resistance.
Forward outlook
- Local home prices are declining (-3.0%/yr); year-one equity from $2k of loan paydown is wiped out by about $9k of value loss. Plan a longer hold.
- Alameda County population projected at +34% by 2050 — long-run rental-demand tailwind backs the buy-and-hold thesis.
- At projected returns (-3.0% appreciation + 3.5% rent growth), your $85k cash investment doubles in ~8 years — after that, you're playing with house money.
Negotiation context
- Only 10 days on market — expect competitive offers; lowballing is unlikely to land.
- 3 sale attempts since 28y ago with the ask held roughly flat each time — persistent listings suggest the price (not the market) is what's stuck; bring a comps-based counter.
- Current owner paid $18k; list at $305k implies a 1549% gain — meaningful room to come down on a strong offer.
Questions for the listing agent
- Is there a deadline driving the sale (1031 exchange, divorce, estate, relocation)? That informs how much negotiation room exists.
- Schools are B-rated — typically a magnet for longer-tenancy family renters. What's the average tenant stay here, and is there a school-zone premium baked into asking?
- Crime grade is D in this area — have there been break-ins, vandalism, or insurance claims at this property in the last 3 years? What carrier currently insures it and at what premium?
- What's the average days-on-market for RENTAL listings here right now (not sales)? A rising rental-DOM trend means longer vacancies and softer asking-rent achievability than the comps imply.
- What's the recent tenant-quality profile in this submarket — average credit score on applications, eviction rate, late-payment / NSF rate, and stable-employment percentage? A property-management company in the area should have these aggregated.
- How much new for-sale + rental construction is in the pipeline within 1–3 miles? Heavy new supply typically softens prices + rents 12–24 months out; constrained supply supports both.
Investment metrics
- 1% rule
- 1.21% ✓
- Cap rate
- 10.74%
- Cash-on-cash
- 15.89%
- DSCR
- 1.71
- GRM
- 6.9
CMA / ARV
- ARV (on-the-fly)
- $219,024
- Comps found
- 12
Show comp detail 12 sales within ~0.75 mi
| Address | Dist | Beds/Ba | Sqft | Sold | Price | $/sf | Match |
|---|---|---|---|---|---|---|---|
| 324 Waikiki Cir | 0.06mi | 2/2.0 (-1) | 1,440 (+3%) | 3mo | $165,000 | $115 | 85 |
| 269 Oahu | 0.16mi | 2/2.0 (-1) | 1,440 (+3%) | 1mo | $285,000 | $198 | 83 |
| 418 Fiji Cir #418 | 0.10mi | 2/2.0 (-1) | 1,344 (-4%) | 2mo | $313,333 | $233 | 82 |
| 328 Waikiki Cir | 0.09mi | 2/2.0 (-1) | 1,344 (-4%) | 3mo | $215,000 | $160 | 81 |
| 259 Molokai Cir #259 | 0.15mi | 2/2.0 (-1) | 1,344 (-4%) | 0mo | $180,000 | $134 | 81 |
| 17 Palm Dr | 0.27mi | 3/2.0 | 1,368 (-3%) | 3mo | $200,000 | $146 | 81 |
| 179 Kona Cir | 0.19mi | 2/2.0 (-1) | 1,344 (-4%) | 1mo | $260,000 | $193 | 78 |
| 167 Kona Cir | 0.16mi | 2/2.0 (-1) | 1,440 (+3%) | 7mo | $247,000 | $172 | 78 |
| 51 Palm Dr | 0.21mi | 2/2.0 (-1) | 1,440 (+3%) | 9mo | $225,000 | $156 | 74 |
| 198 Hawaii Cir | 0.19mi | 2/2.0 (-1) | 1,464 (+4%) | 10mo | $185,000 | $126 | 71 |
| 226 Hula Cir | 0.24mi | 2/2.0 (-1) | 1,344 (-4%) | 10mo | $205,000 | $153 | 68 |
| 4141 Deepcreek #106 | 0.57mi | 2/2.0 (-1) | 1,440 (+3%) | 9mo | $130,000 | $90 | 56 |
Match score weights: distance 35% · size 25% · config 20% · recency 20%. Top-matched comps best support the ARV.
Projected returns pro-forma
-3.0% appreciation · 3.49% rent growth · sell at horizon
- IRR
- 7.2%
- Equity multiple
- 1.28×
- Total profit
- $24,303
- Equity at exit
- $45,476
- IRR
- 16.9%
- Equity multiple
- 2.42×
- Total profit
- $120,939
- Equity at exit
- $26,371
Cash invested: $85,400 (down + closing). Projections, not guarantees.
Landlord ↔ Tenant lean methodology
- Overall (STATE)
- 18 Strongly Tenant-Friendly
- State California
- 18 Strongly Tenant-Friendly · D+13
- County
- — inherits STATE
- City
- — inherits STATE
ZIP-level market 94587
- Rents YoY
- 3.5%
- Active inventory
- 145
- Price-to-rent
- 6.9×
Monthly cashflow live
- Estimated rent
- $3,696 high interval (Pro) →
- Mortgage (P&I)
- −$1,599
- Tax from tax record
- −$62 /mo · $748/yr
- Insurance
- −$127
- HOA
- −$0
- Vacancy / Maint / Mgmt
- −$776
- Net cashflow
- $1,131
Break-even live
UW: 25.0% down · 7.5% · 30yr · 1.5% tax · 5.0% vac · 8.0% maint · 8.0% mgmt
Financing live
Cash to close
- Down payment
- $76,250
- Closing costs
- $9,150
- Reserves months
- —
- Total cash needed
- —
Loan-product check · same deal, 3 products live
Conventional
25% down · 7.5% · 30yr
- Down + closing
- —
- Monthly P&I
- —
- Monthly cashflow
- —
- DSCR
- —
- Eligible?
- —
Personal DTI + credit; lowest rate.
DSCR
20% down · 8.5% · 30yr
- Down + closing
- —
- Monthly P&I
- —
- Monthly cashflow
- —
- DSCR
- —
- Eligible?
- —
No personal income docs; deal must DSCR.
Hard money
10% down · 12.0% · 12mo
- Down + closing
- —
- Monthly P&I
- —
- Monthly cashflow
- —
- DSCR
- —
- Eligible?
- —
Short-term bridge; refi at stabilization.
Rent comps 19 comps
| Address | Beds | Baths | Sqft | Rent | $/sqft | DOM | Units | Dist |
|---|---|---|---|---|---|---|---|---|
| 3842 Cardinal Ter Fremont, CA | 3.0 | 2.5 | 1607 | $4,100 | $2.55 | 18d | 1 | 0.56mi |
| 2262 Eric Ct #4 Union City, CA | 3.0 | 1.5 | 1003 | $3,400 | $3.39 | 3d | 1 | 0.56mi |
| 33877 Raven Ter Fremont, CA | 2.0 | 1.5 | 1315 | $3,700 | $2.81 | 15d | 1 | 0.62mi |
| 3716 Harlequin Ter Fremont, CA | 4.0 | 2.5 | 1855 | $4,500 | $2.43 | 44d | 1 | 0.64mi |
| 4123 Asimuth Cir Union City, CA | 3.0 | 1.5 | 1280 | $3,350 | $2.62 | 44d | 1 | 0.75mi |
| 4292 Comet Cir Union City, CA | 3.0 | 1.5 | 1250 | $2,950 | $2.36 | 24d | 1 | 0.86mi |
| 33411 Madelyn Ter Union City, CA | 2.0 | 2.5 | 1441 | $3,798 | $2.64 | 18d | 1 | 0.87mi |
| 2449 Almaden Blvd Union City, CA | 3.0 | 2.0 | 1565 | $4,495 | $2.87 | 2d | 1 | 0.87mi |
| 34077 Paseo Padre Pkwy Fremont, CA | 1.0–2.0 | 1.0 | 788 | $2,887 | $3.66 | 2d | 13 | 1.04mi |
| 34426 Bentley Pl Fremont, CA | 3.0 | 2.0 | 1290 | $3,500 | $2.71 | 20d | 1 | 1.09mi |
| 3307 San Marco Ct Union City, CA | 3.0 | 2.0 | 1349 | $3,900 | $2.89 | 3d | 1 | 1.11mi |
| 3221 San Carlos Way Union City, CA | 3.0 | 2.0 | 1396 | $3,795 | $2.72 | 3d | 1 | 1.17mi |
| 4163 Rainbow Ter Fremont, CA | 4.0 | 3.0 | 1474 | $3,695 | $2.51 | 5d | 1 | 1.27mi |
| 2500 Medallion Dr Union City, CA | 1.0–3.0 | 1.0 | 781 | $3,195 | $4.09 | 2d | 9 | 1.27mi |
| 32468 Deborah Dr Union City, CA | 3.0 | 2.0 | 1340 | $3,949 | $2.95 | 24d | 1 | 1.28mi |
| 4402 Queen Anne Dr Union City, CA | 3.0 | 2.0 | 1357 | $4,200 | $3.10 | 2d | 1 | 1.38mi |
| 3168 Courthouse Dr Union City, CA | 3.0 | 2.0 | 1207 | $4,200 | $3.48 | 15d | 1 | 1.39mi |
| 3154 Sugar Beet Way Union City, CA | 4.0 | 2.0 | 1412 | $4,150 | $2.94 | 2d | 1 | 1.45mi |
| 5016 Paseo Padre Pkwy Fremont, CA | 2.0 | 1.0–2.0 | 719 | $3,150 | $4.38 | 2d | 10 | 1.46mi |
Listing history 10 events
-
2026-06-02status $305,000 Pending 10 DOM
-
2026-06-01days on market $305,000 Active 10 DOM
-
2026-05-31days on market $305,000 Active 9 DOM
-
2026-05-22$305,000 Active
-
2015-10-29historical
-
2015-02-17historical
-
1998-07-30soldstatus $18,500
-
1998-07-30soldstatus $18,500
-
1998-04-28$18,500
-
1998-04-28$18,500
ⓘ Source: listings_history table (triggers on properties + properties_extension) + one-shot
backfill from property_details.listing_events for pre-trigger history.
Tax reassessment forecast CA · Resets to sale price
- Current annual tax
- $748 · $62/mo
- Projected year-2 tax
- $2,318 · $193/mo
- Expected delta
- +$1,570/yr (+$131/mo · 209.9%)
ⓘ Screening estimate from a state-policy table — verify with the county assessor before closing.
Climate risk First Street
- Flood 3/10 Moderate FEMA zone X (unshaded) · 18% chance over 30 yrs
- Wildfire 1/10 Low
- Heat 4/10 Moderate 7 d/yr ≥90°F today · 14 d/yr by 30 yrs out
- Wind 1/10 Low
- Air quality 7/10 Severe 12 unhealthy d/yr today · 12 by 30 yrs out
Nearby sold comps map
Loading sold comps map…
Walkable amenities ~0.75 mi
Loading nearby amenities…
Taxation est. · year 1
- Rental income
- $44,353
- − Mortgage interest
- −$17,085
- − Property taxes
- −$748
- − Insurance
- −$1,525
- − Repairs & maintenance
- −$3,548
- − Management
- −$3,548
- − Depreciation
- −$8,873
- Taxable income
- $9,026
- Est. tax owed @ 24.0%
- −$2,166
- After-tax cash flow
- $11,406/yr
For passive investors: Depreciation is non-cash, so a rental often shows a tax loss while cash-flowing — sheltering income. Rental losses are passive: they offset passive income freely, and up to $25,000/yr can offset ordinary (W-2) income if you actively participate and your MAGI is under $100k (phasing out to $0 by $150k); unused losses carry forward. On sale, claimed depreciation is recaptured at up to 25%, and gains may owe capital-gains tax (a 1031 exchange can defer both). Figures are a year-1 estimate at your 24.0% rate — not tax advice; consult a CPA.
Schools (NCES district)
- District
- New Haven Unified
- NCES district ID
- 0626910
- Math proficiency
- 43% ▲ 1.00%
- Reading proficiency
- 69% ▲ 18.00%
- Median HH income
- $87,202
- Composite
- 51.21/100
- National rank
- #1754
- State rank
- #85 of 517 in CA
Livability — Union City
- Score
- 73/100
- State rank
- #150
- US rank
- #5027
Category grades
Schools grade is shown separately in the Schools card above.
Census & demographics
- Census place
- Union City, CA
- County
- Alameda County · 1,614,355 people
- City population
- 67,464
- Metro
- San Francisco-Oakland-Berkeley, CA
- Population (ZIP)
- 67,464
- Household income
- $133,715
- Rent vs Own
- Severe rent burden
- 1565.0
Population outlook (Alameda County) Hauer SSP2
- Today (2025)
- 1,928,884 people
- By 2030
- 2,069,146 · +7.3%
- By 2040
- 2,338,405 · +21.2%
- By 2050
- 2,586,608 · +34.1%
- By 2075
- 3,061,911 · +58.7%
- By 2100
- 3,234,133 · +67.7%
Race, ethnicity, and origin ACS 2023
- Neighborhood character
- Diverse neighborhood (Simpson 0.63)
- Race & ethnicity
- Asian 55% Hispanic / Latino 19% White 15% Two or more races 10% Black 5%
- Hispanic origin (detail)
- Mexican 16%
- Common ancestry
- Russian 1% Slovak 1%
- Foreign-born
- 47% · China, Canada, Vietnam
- Languages at home
- 39% English-only · Spanish 13% Other Indo-European 13% Tagalog/Filipino 12%
Political lean MEDSL · Alameda
- 2024 margin
- Solid D (+53.6) · D 74.6% · R 21.0% · Other 4.4%
- 2008→2024 swing
- -5.9pp toward R · 2008: 59.5pp · 2024: 53.6pp
- All cycles
- 2024: D+53.6 2020: D+62.5 2016: D+64.4 2012: D+59.8 2008: D+59.5
Not yet ingested
- Civics
- —
Market trends
- HPI YoY
- ▼ -1280.49%
- Current HPI
- 343.0333
- Rent YoY
- ▲ 3.49%
- Metro
- San Francisco-Oakland-Berkeley, CA
- State GDP YoY
- ▲ 3.21%
- F500 in state
- 116
Industry mix (Fortune 500 HQ in CA)
| Industry | F500 HQs | Revenue |
|---|---|---|
| Technology | 27 | $1,492B |
|
||
| Financial Services | 3 | $174B |
|
||
| Retail | 3 | $44B |
|
||
| Insurance | 3 | $26B |
|
||
| Media / Entertainment | 2 | $115B |
|
||
| Pharmaceuticals / Biotech | 2 | $62B |
|
||
Price history
+1548.6% since first listed7 events — show timeline
- 2026-05-22 Listed $305,000 bridgeMLS, Bay East AOR, or Contra Costa AOR
- 2015-10-29 Listing Removed — bridgeMLS, Bay East AOR, or Contra Costa AOR
- 2015-02-17 Listing Removed — bridgeMLS, Bay East AOR, or Contra Costa AOR
- 1998-07-30 Sold (MLS) $18,500 bridgeMLS, Bay East AOR, or Contra Costa AOR
- 1998-07-30 Sold (MLS) $18,500 bridgeMLS, Bay East AOR, or Contra Costa AOR
- 1998-04-28 Listed $18,500 bridgeMLS, Bay East AOR, or Contra Costa AOR
- 1998-04-28 Listed $18,500 bridgeMLS, Bay East AOR, or Contra Costa AOR
Property tax history
-0.3%/yrLatest (2025): $748 · +1.6% YoY. Source: county tax records.
Cash-flow waterfall
monthlySold comps — $/sqft
last 12 mo · ≤1 miLoading sold comps…