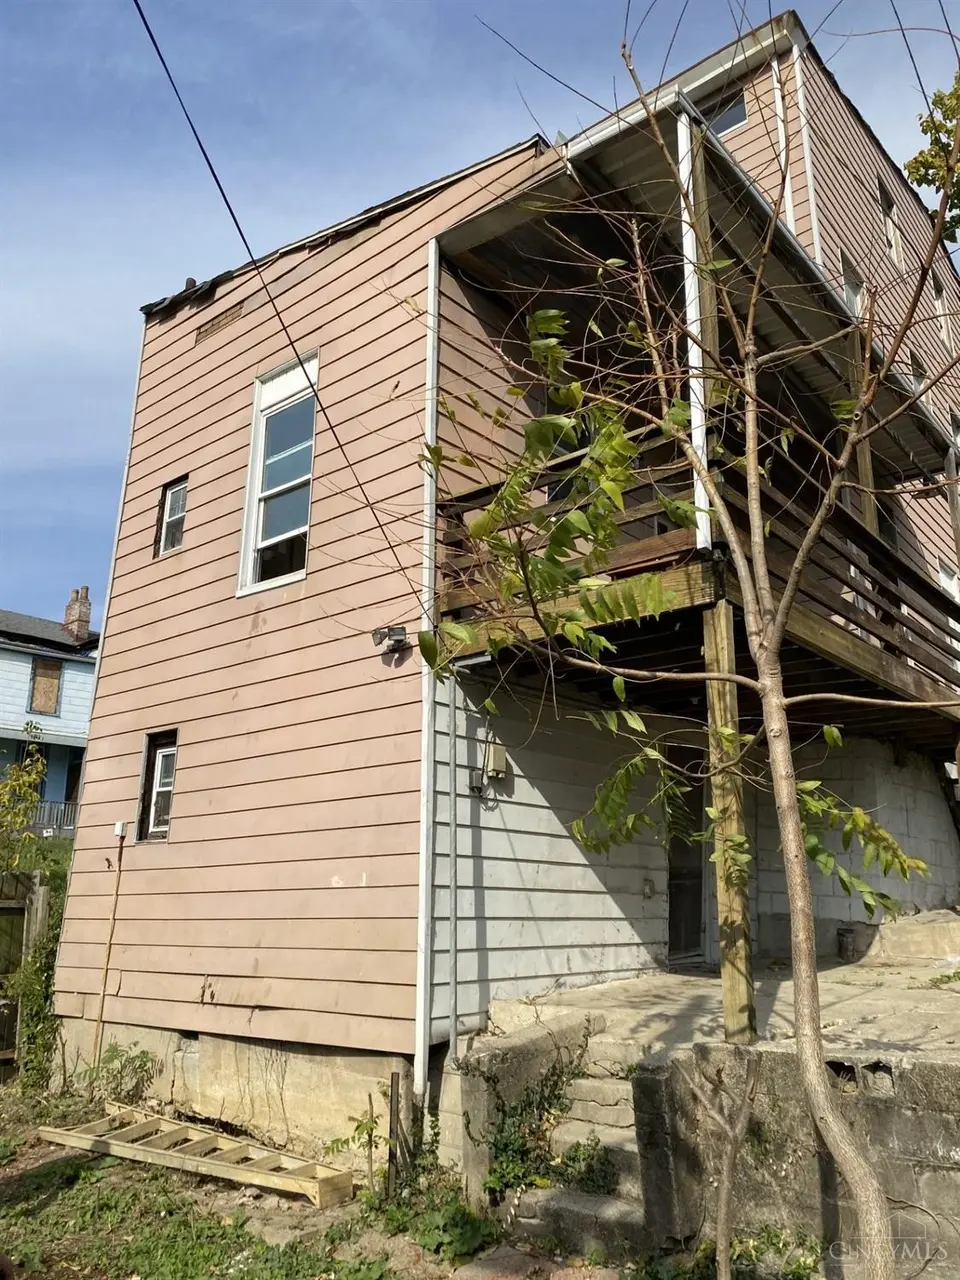
1723 Montrose St · Cincinnati, OH
Flood risk 1/10 · Minimal
- FEMA flood zone
- X (unshaded)
- Chance of flooding over 30 yrs
- 0.0%
- Est. flood insurance / yr
- $473 – $860
Fire risk 1/10 · Minimal
- Est. fire insurance / yr
- $713 – $1,323
Heat risk 5/10 · Moderate
- Hot days now (above 103°F)
- 7 days/yr
- Hot days in 30 yrs
- 20 days/yr
Wind risk 2/10 · Minimal
- Chance of severe wind over 30 yrs
- 1.0%
Air-quality risk 3/10 · Minor
- Unhealthy air days now
- 3 days/yr
- Unhealthy air days in 30 yrs
- 5 days/yr
Risk factors via First Street. Map © Google.
Why this score? — see what drove the A- grade
The composite is a weighted blend of 9 inputs, each scored 0–100. Each bar is that input's sub-score; the figure is the points it added to the 100-point composite (weight × sub-score).
- Cash flow +30.0/30.0
- 1% rule +10.0/10.0
- DSCR +10.0/10.0
- Appreciation +10.0/10.0
- ARV discount +7.5/15.0
- Rent growth +4.5/5.0
- Livability +4.0/5.0
- Schools +2.5/10.0
- Condition / age +2.5/5.0
$48,000
🖨 Deal sheet 📄 Offer letter ✓ Due diligence
Listing remarks MLS
Add this spacious home to your investment portfolio! This home is full of character and potential! A total of 3 parcels are being sold (203-0029-0125-00; 203-0029-0185-00; 203-0029-0186-00) providing a large outdoor area. Additional parking/storage is available in old style garage cut into the hill.
Key facts
- Large outdoor area
- 3,180 sq ft lot
- 2 garage spots
Tags
Property features AI
Finance
- Other: Lot approximately 0.073 acres (32 x 100); Located in Fairmount; directions: 75S to Harrison Ave, right on Harrison Ave, left on Montrose
- Financial info: Lease not considered
- HOA & community: No HOA
Exterior
- Parking: Detached carport; 2 garage spaces; On-street parking available
- Utilities: Water at street; Gas at street; Public sewer; Gas water heating
- Home design: Traditional single-family home; Three or more levels; Residential zoning
- Construction: Aluminum siding; Block foundation
- Exterior features: Shingle roof; Vinyl windows
Interior
- Kitchen: Kitchen (dimensions listed but not specified)
- Bedrooms: 3 bedrooms (primary and bedroom 2 on level 2; bedroom 3 on level 3); Primary bedroom with unspecified additional features
- Bathrooms: 1 full bathroom on level 1
- Interior features: 7 total rooms; Full basement
Neighborhood map
What this means for you Summary
Snapshot
- This is a 3-bed/1.0-bath single-family listed at $48k.
Deal economics
- At list price, monthly cash flow is $1k ($13k/yr) — positive.
- The deal already cash-flows at list — no discount required.
- Meets the 1% rule at list price ($2k rent vs $48k).
- Recommended offer: $47k (1.5% below list) — sets the bar for market timing.
- Cap rate 32.5% vs local median 3.9% in Cincinnati — top-decile yield for the area; either an underpriced asset or a hidden risk that comps aren't pricing in. Stress-test before assuming the spread holds.
Location & tenants
- Location reads 80/100 on livability (#130 in OH, #1,856 nationally) — a professional / high-income tenant draw. Strengths: amenities A+, commute A+, cost of living A+; Watch: employment D, crime F.
- Cincinnati Public Schools (urban): math 25% / reading 36% proficiency, ranked #581 of 656 in OH (top 89%) — families likely to look elsewhere, expect single-tenant / working-renter base with shorter leases; 70% free/reduced lunch — lower-income household profile, screen leases tightly.
- Market conditions: Rents rising fast (+8.1%/yr); 67 active listings in the ZIP; 4 comparable units currently listed for rent nearby; rentals at typical pace (median 24d on market — plan ~3-4 weeks tenant-placement turnaround); lower-income renter base — watch delinquency; 801 units permitted in Hamilton County in 2024 (190 in 5+ unit buildings).
- At $1,744/mo this rent would consume 75% of the median local household income ($28k/yr) (locally 857% of renters already pay >50% of income on rent) — very limited rent-growth headroom before tenants either downsize or default.
Forward outlook
- In year one you build about $5k of equity ($332 loan paydown + $5k appreciation (10.0% local appreciation)).
- At projected returns (10.0% appreciation + 8.0% rent growth), your $13k cash investment doubles in ~1 year — after that, you're playing with house money.
- By year 6, paydown + projected appreciation supports a ~$30k cash-out refi (75% LTV) — recoverable capital for the next deal without selling this one.
Negotiation context
- It's been on market 23 days — a 2% lower offer ($47k) is reasonable based on typical stale-listing flexibility.
- 7 sale attempts since 6y ago with the ask held roughly flat each time — persistent listings suggest the price (not the market) is what's stuck; bring a comps-based counter.
- Current owner paid $22k; list at $48k implies a 118% gain — meaningful room to come down on a strong offer.
Risks & watch-outs
- Watch-outs: built in 1890 — expect roof / HVAC / electrical / plumbing capex.
- Climate carrying-cost: extreme-heat days projected 7→20/yr by 2055 (HVAC capex compounding) — expect insurance premiums to compound above CPI over the hold.
Questions for the listing agent
- Built in 1890 — when were the roof, HVAC, electrical panel, plumbing, and water heater last replaced?
- Is there a deadline driving the sale (1031 exchange, divorce, estate, relocation)? That informs how much negotiation room exists.
- Schools are B-rated — typically a magnet for longer-tenancy family renters. What's the average tenant stay here, and is there a school-zone premium baked into asking?
- Crime grade is F in this area — have there been break-ins, vandalism, or insurance claims at this property in the last 3 years? What carrier currently insures it and at what premium?
- What's the average days-on-market for RENTAL listings here right now (not sales)? A rising rental-DOM trend means longer vacancies and softer asking-rent achievability than the comps imply.
- What's the recent tenant-quality profile in this submarket — average credit score on applications, eviction rate, late-payment / NSF rate, and stable-employment percentage? A property-management company in the area should have these aggregated.
- How much new for-sale + rental construction is in the pipeline within 1–3 miles? Heavy new supply typically softens prices + rents 12–24 months out; constrained supply supports both.
Investment metrics
- 1% rule
- 3.63% ✓
- Cap rate
- 32.45%
- Cash-on-cash
- 93.43%
- DSCR
- 5.16
- GRM
- 2.3
CMA / ARV
- ARV (on-the-fly)
- $164,304
- Comps found
- 2
Show comp detail 2 sales within ~0.75 mi
| Address | Dist | Beds/Ba | Sqft | Sold | Price | $/sf | Match |
|---|---|---|---|---|---|---|---|
| 1699 Westwood Ave | 0.15mi | 4/2.0 (+1) | 2,390 (-8%) | 18mo | $71,000 | $30 | 55 |
| 1859 Baltimore Ave | 0.59mi | 4/2.0 (+1) | 2,350 (-10%) | 4mo | $148,000 | $63 | 44 |
Match score weights: distance 35% · size 25% · config 20% · recency 20%. Top-matched comps best support the ARV.
Projected returns pro-forma
10.0% appreciation · 8.0% rent growth · sell at horizon
- IRR
- —
- Equity multiple
- 8.59×
- Total profit
- $102,031
- Equity at exit
- $43,242
- IRR
- —
- Equity multiple
- 21.16×
- Total profit
- $270,948
- Equity at exit
- $93,253
Cash invested: $13,440 (down + closing). Projections, not guarantees.
Landlord ↔ Tenant lean methodology
- Overall (STATE)
- 73 Landlord-Friendly
- State Ohio
- 73 Landlord-Friendly · R+6
- County
- — inherits STATE
- City
- — inherits STATE
ZIP-level market 45214
- Home prices YoY
- 3.6%
- Rents YoY
- 8.1%
- Active inventory
- 67
- Price-to-rent
- 2.3×
Monthly cashflow live
- Estimated rent
- $1,744 medium interval (Pro) →
- Mortgage (P&I)
- −$252
- Tax est. 1.5%
- −$60 /mo · $720/yr
- Insurance
- −$20
- HOA
- −$0
- Vacancy / Maint / Mgmt
- −$366
- Net cashflow
- $1,046
Break-even live
UW: 25.0% down · 7.5% · 30yr · 1.5% tax · 5.0% vac · 8.0% maint · 8.0% mgmt
Financing live
Cash to close
- Down payment
- $12,000
- Closing costs
- $1,440
- Reserves months
- —
- Total cash needed
- —
Loan-product check · same deal, 3 products live
Conventional
25% down · 7.5% · 30yr
- Down + closing
- —
- Monthly P&I
- —
- Monthly cashflow
- —
- DSCR
- —
- Eligible?
- —
Personal DTI + credit; lowest rate.
DSCR
20% down · 8.5% · 30yr
- Down + closing
- —
- Monthly P&I
- —
- Monthly cashflow
- —
- DSCR
- —
- Eligible?
- —
No personal income docs; deal must DSCR.
Hard money
10% down · 12.0% · 12mo
- Down + closing
- —
- Monthly P&I
- —
- Monthly cashflow
- —
- DSCR
- —
- Eligible?
- —
Short-term bridge; refi at stabilization.
Rent comps 4 comps
| Address | Beds | Baths | Sqft | Rent | $/sqft | DOM | Units | Dist |
|---|---|---|---|---|---|---|---|---|
| 1014 Considine Ave Cincinnati, OH | 4.0 | 2.0 | 2200 | $2,000 | $0.91 | 2d | 1 | 1.21mi |
| 1620 Minion Ave Cincinnati, OH | 4.0 | 2.0 | 1845 | $1,550 | $0.84 | 20d | 1 | 1.30mi |
| 2704 W McMicken Ave Unit 2 Cincinnati, OH | 3.0 | 1.0 | 1760 | $1,500 | $0.85 | 24d | 1 | 1.35mi |
| 1241 Bates Ave Cincinnati, OH | 3.0 | 2.5 | 2100 | $1,875 | $0.89 | 24d | 1 | 1.35mi |
Listing history 30 events
-
2026-06-18days on market $48,000 Active 23 DOM
-
2026-06-17days on market $48,000 Active 22 DOM
-
2026-06-16days on market $48,000 Active 21 DOM
-
2026-06-15days on market $48,000 Active 20 DOM
-
2026-06-13days on market $48,000 Active 18 DOM
-
2026-06-13days on market $48,000 Active 17 DOM
-
2026-06-09days on market $48,000 Active 14 DOM
-
2026-06-08days on market $48,000 Active 13 DOM
-
2026-06-07days on market $48,000 Active 12 DOM
-
2026-06-03days on market $48,000 Active 8 DOM
-
2026-06-02days on market $48,000 Active 7 DOM
-
2026-06-01days on market $48,000 Active 6 DOM
-
2026-05-31days on market $48,000 Active 5 DOM
-
2026-05-22$48,000 Active
-
2026-02-13historical 300-char remark
Show marketing remark (300 chars)
Add this spacious home to your investment portfolio! This home is full of character and potential! A total of 3 parcels are being sold (203-0029-0125-00; 203-0029-0185-00; 203-0029-0186-00) providing a large outdoor area. Additional parking/storage is available in old style garage cut into the hill.
-
2025-10-27price $54,900 300-char remark
Show marketing remark (300 chars)
Add this spacious home to your investment portfolio! This home is full of character and potential! A total of 3 parcels are being sold (203-0029-0125-00; 203-0029-0185-00; 203-0029-0186-00) providing a large outdoor area. Additional parking/storage is available in old style garage cut into the hill.
-
2025-08-13$59,900 Active 300-char remark
Show marketing remark (300 chars)
Add this spacious home to your investment portfolio! This home is full of character and potential! A total of 3 parcels are being sold (203-0029-0125-00; 203-0029-0185-00; 203-0029-0186-00) providing a large outdoor area. Additional parking/storage is available in old style garage cut into the hill.
-
2025-08-02historical 300-char remark
Show marketing remark (300 chars)
Add this spacious home to your investment portfolio! This home is full of character and potential! A total of 3 parcels are being sold (203-0029-0125-00; 203-0029-0185-00; 203-0029-0186-00) providing a large outdoor area. Additional parking/storage is available in old style garage cut into the hill.
-
2025-05-02$72,000 Active 300-char remark
Show marketing remark (300 chars)
Add this spacious home to your investment portfolio! This home is full of character and potential! A total of 3 parcels are being sold (203-0029-0125-00; 203-0029-0185-00; 203-0029-0186-00) providing a large outdoor area. Additional parking/storage is available in old style garage cut into the hill.
-
2025-04-01historical
-
2025-03-01historical
-
2024-11-06$82,000 Active
-
2024-11-01$82,000 Active
-
2022-03-22soldstatus $22,000
-
2021-03-31historical
-
2021-01-28price $35,900
-
2020-12-30status Active
-
2020-11-13historical Contingency Pending
-
2020-08-19$24,900 Active
-
1994-07-12soldstatus $29,900
ⓘ Source: listings_history table (triggers on properties + properties_extension) + one-shot
backfill from property_details.listing_events for pre-trigger history.
Climate risk First Street
- Flood 1/10 Low FEMA zone X (unshaded) · 0% chance over 30 yrs
- Wildfire 1/10 Low
- Heat 5/10 Major 7 d/yr ≥103°F today · 20 d/yr by 30 yrs out
- Wind 2/10 Low 100% chance of damaging wind over 30 yrs
- Air quality 3/10 Moderate 3 unhealthy d/yr today · 5 by 30 yrs out
Nearby sold comps map
Loading sold comps map…
Walkable amenities ~0.75 mi
Loading nearby amenities…
Taxation est. · year 1
- Rental income
- $20,933
- − Mortgage interest
- −$2,689
- − Property taxes
- −$720
- − Insurance
- −$240
- − Repairs & maintenance
- −$1,675
- − Management
- −$1,675
- − Depreciation
- −$1,396
- Taxable income
- $12,539
- Est. tax owed @ 24.0%
- −$3,009
- After-tax cash flow
- $9,547/yr
For passive investors: Depreciation is non-cash, so a rental often shows a tax loss while cash-flowing — sheltering income. Rental losses are passive: they offset passive income freely, and up to $25,000/yr can offset ordinary (W-2) income if you actively participate and your MAGI is under $100k (phasing out to $0 by $150k); unused losses carry forward. On sale, claimed depreciation is recaptured at up to 25%, and gains may owe capital-gains tax (a 1031 exchange can defer both). Figures are a year-1 estimate at your 24.0% rate — not tax advice; consult a CPA.
Schools (NCES district)
- District
- Cincinnati Public Schools
- NCES district ID
- 3904375
- Math proficiency
- 25% ▼ -19.00%
- Reading proficiency
- 36% ▼ -14.00%
- Median HH income
- $35,743
- Composite
- 25.21/100
- National rank
- #7508
- State rank
- #581 of 656 in OH
Livability — Cincinnati
- Score
- 80/100
- State rank
- #130
- US rank
- #1856
Category grades
Schools grade is shown separately in the Schools card above.
Census & demographics
- Census place
- Cincinnati, OH
- County
- Hamilton County · 701,295 people
- City population
- 505,555
- Metro
- Cincinnati, OH-KY-IN
- Population (ZIP)
- 8,630
- Household income
- $27,852
- Rent vs Own
- Severe rent burden
- 857.0
Population outlook (Hamilton County) Hauer SSP2
- Today (2025)
- 826,054 people
- By 2030
- 830,947 · +0.6%
- By 2040
- 832,319 · +0.8%
- By 2050
- 822,428 · -0.4%
- By 2075
- 788,688 · -4.5%
- By 2100
- 710,674 · -14.0%
Race, ethnicity, and origin ACS 2023
- Neighborhood character
- Majority Black (63%)
- Race & ethnicity
- Black 63% White 27% Two or more races 7% Hispanic / Latino 3%
- Common ancestry
- Romanian 1%
- Foreign-born
- 2% · Canada
- Languages at home
- 97% English-only · Spanish 1% Other Indo-European 1%
Political lean MEDSL · Hamilton
- 2024 margin
- D (+14.9) · D 57.0% · R 42.1%
- 2008→2024 swing
- +7.9pp toward D · 2008: 7.0pp · 2024: 14.9pp
- All cycles
- 2024: D+14.9 2020: D+15.9 2016: D+9.5 2012: D+4.9 2008: D+7.0
Not yet ingested
- Civics
- —
Market trends
- HPI YoY
- ▲ 15.01%
- Current HPI
- 433.2346
- Rent YoY
- ▲ 8.09%
- Metro
- Cincinnati, OH-KY-IN
- State GDP YoY
- ▲ 1.98%
- F500 in state
- 48
Industry mix (Fortune 500 HQ in OH)
| Industry | F500 HQs | Revenue |
|---|---|---|
| Insurance | 3 | $145B |
|
||
| Industrial Machinery | 3 | $49B |
|
||
| Financial Services | 3 | $24B |
|
||
| Consumer Goods | 2 | $93B |
|
||
| Aerospace / Defense | 2 | $47B |
|
||
| Utilities | 2 | $33B |
|
||
Price history
+60.5% since first listed17 events — show timeline
- 2026-05-22 Listed $48,000 Cincy MLS
- 2026-02-13 Listing Removed — Cincy MLS
- 2025-10-27 Price Changed $54,900 Cincy MLS
- 2025-08-13 Listed $59,900 Cincy MLS
- 2025-08-02 Listing Removed — Cincy MLS
- 2025-05-02 Listed $72,000 Cincy MLS
- 2025-04-01 Listing Removed — Cincy MLS
- 2025-03-01 Listing Removed — Dayton MLS
- 2024-11-06 Listed $82,000 Dayton MLS
- 2024-11-01 Listed $82,000 Cincy MLS
- 2022-03-22 Sold (Public Records) $22,000 Public Records
- 2021-03-31 Listing Removed — Cincy MLS
- 2021-01-28 Price Changed $35,900 Cincy MLS
- 2020-12-30 Relisted — Cincy MLS
- 2020-11-13 Contingent — Cincy MLS
- 2020-08-19 Listed $24,900 Cincy MLS
- 1994-07-12 Sold (Public Records) $29,900 Public Records
Property tax history
+16.7%/yrLatest (2025): $3,503 · +760.6% YoY. Source: county tax records.
Cash-flow waterfall
monthlySold comps — $/sqft
last 12 mo · ≤1 miLoading sold comps…