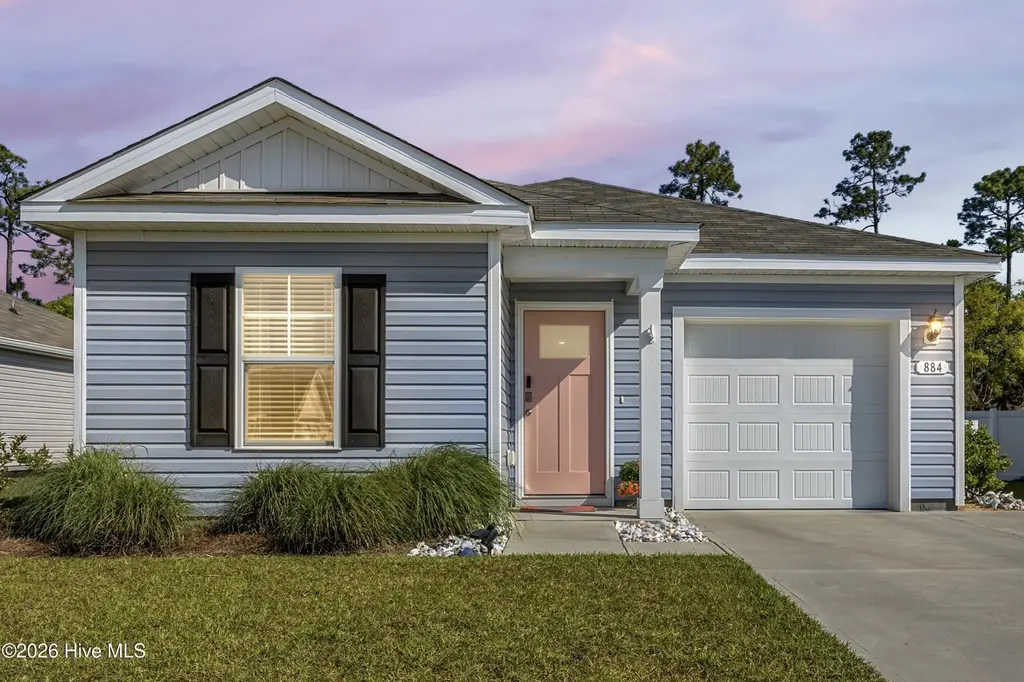
884 Shipley Way SW · Varnamtown, NC
Flood risk 1/10 · Minimal
- FEMA flood zone
- X (unshaded)
- Chance of flooding over 30 yrs
- 0.0%
- Est. flood insurance / yr
- $507 – $1,088
Fire risk 6/10 · Moderate
- Est. fire insurance / yr
- $906 – $1,684
Heat risk 9/10 · Severe
- Hot days now (above 103°F)
- 7 days/yr
- Hot days in 30 yrs
- 20 days/yr
Wind risk 9/10 · Severe
- Chance of severe wind over 30 yrs
- 99.0%
Air-quality risk 2/10 · Minimal
- Unhealthy air days now
- 1 days/yr
- Unhealthy air days in 30 yrs
- 1 days/yr
Risk factors via First Street. Map © Google.
Why this score? — see what drove the D- grade
The composite is a weighted blend of 9 inputs, each scored 0–100. Each bar is that input's sub-score; the figure is the points it added to the 100-point composite (weight × sub-score).
- Cash flow +12.0/30.0
- ARV discount +5.8/15.0
- Condition / age +4.8/5.0
- Schools +3.9/10.0
- DSCR +3.6/10.0
- Livability +3.0/5.0
- 1% rule +2.9/10.0
- Rent growth +2.5/5.0
- Appreciation +0.0/10.0
$255,000
🖨 Deal sheet (PDF) 📄 Offer letter ✓ Due diligence
Listing remarks
Move in ready and priced to sell! This charming one level home offers the upgrades you want. From the fully finished garage with epoxy floors to the granite countertops, handle pulls on all cabinetry, custom window treatments, and thoughtfully designed landscaping, every detail has already been done for you. Set on a premium . 20, private lot with peaceful wooded views, this home offers the perfect balance of comfort and tranquility. A completed survey makes adding a fence simple, and a transferable termite bond adds extra peace of mind. Just 7 minutes from Holden Beach, you'll love having easy access to coastal living--morning walks collecting shells, afternoons in the sun, and evenings fi
Key facts
- 8,712 sq ft lot
- Garage
- Community pool
Property features AI
Finance
- Other: Zoning: Co-R-7500; Directions available
- HOA & community: Homeowners association with annual fee ($1,620 / year; about $135/month); Association provides grounds and structure maintenance, management, and cable TV; Community pool; Sidewalks; Subdivision: Stanbury Creek
Exterior
- Parking: Attached garage with 1 garage space; Total 1 parking space; Concrete driveway; Garage door opener
- Utilities: Public water; Sewer connected; Water connected
- Home design: Single family residence; One-story; Entry level: 1
- Construction: Vinyl siding and frame construction; Shingle roof; Slab foundation; Built as a residential single family home
- Exterior features: Covered patio; Patio; Front porch; Has a view; No fencing
Interior
- Kitchen: Refrigerator; Disposal; Electric range; Microwave
- Bedrooms: Master on main level
- Flooring: Carpet
- Bathrooms: 2 full bathrooms; Accessible full bath
- Heating & cooling: Heat pump heating; Electric heating; Central air conditioning; Heat pump cooling
- Interior features: Master bedroom on main level; Walk-in closet(s); Entrance foyer; Kitchen island; Ceiling fan(s); Pantry; Window coverings
- Laundry & utility: Laundry room; Electric water heater
Neighborhood map
What this means for you Summary
Snapshot
- This is a 3-bed/2.0-bath single-family listed at $255k. Condition is rated excellent.
Deal economics
- At list price, monthly cash flow is $-60 ($-720/yr) — negative.
- To cash-flow at today's rent, offer at most $244k (4.2% below list).
- To meet the 1% rule (rent ≥ 1% of price), the offer needs to be $203k (20.5% below list).
- Recommended offer: $203k (20.5% below list) — sets the bar for 1% rule.
- Cap rate 6.0% vs local median 3.8% in Varnamtown — top-decile yield for the area; either an underpriced asset or a hidden risk that comps aren't pricing in. Stress-test before assuming the spread holds.
Location & tenants
- Location reads 60/100 on livability (#521 in NC) — a middle-class / working-renter tenant base. Strengths: cost of living A+, housing A, employment B; Watch: crime D, health & safety D, amenities F.
- Brunswick County Schools (rural): math 45% / reading 47% proficiency, ranked #82 of 178 in NC (top 46%) — families likely to look elsewhere, expect single-tenant / working-renter base with shorter leases.
- Zoned schools: Virginia Williamson Elem (math 50% / reading 49%, grade D, #417 of 1,410 statewide, top 32%, 502 students, 99% FRL); Cedar Grove Middle (math 30% / reading 36%, grade F, #305 of 475 statewide, top 65%, 434 students, 99% FRL); West Brunswick High (math 50% / reading 56%, grade C-, #281 of 535 statewide, top 53%, 1,526 students, 100% FRL) — zoned schools average 100% FRL vs 53% district-wide (46 pts higher); higher-poverty schools than district average — tighter screening recommended.
- Market conditions: 506 active listings in the ZIP; 6,112 units permitted in Brunswick County in 2024 (990 in 5+ unit buildings).
- This rent runs 40% of the median local income ($60k/yr) — at the standard rent-burdened threshold; future hikes will face affordability resistance.
Forward outlook
- Local home prices are declining (-3.0%/yr); year-one equity from $2k of loan paydown is wiped out by about $8k of value loss. Plan a longer hold.
- Brunswick County population projected at +36% by 2050 — long-run rental-demand tailwind backs the buy-and-hold thesis.
Negotiation context
- It's been on market 61 days — a 6% lower offer ($240k) is reasonable based on typical stale-listing flexibility.
- 2 sale attempts with the ask held roughly flat each time — persistent listings suggest the price (not the market) is what's stuck; bring a comps-based counter.
Risks & watch-outs
- Climate carrying-cost: severe wind risk, 99% chance of damaging wind over 30y; major wildfire risk; extreme-heat days projected 7→20/yr by 2055 (HVAC capex compounding) — expect insurance premiums to compound above CPI over the hold.
Questions for the listing agent
- What do current leases actually rent for vs. the listed asking? Can we see a recent rent roll and the last 12 months of T-12 income?
- It's been on market 61 days. Have you received any prior offers? Is the seller open to a 21% concession, seller financing, or rate buy-down credit?
- What does the HOA fee cover, when was the last increase, and are there any pending special assessments or reserve-fund shortfalls?
- Why hasn't it sold? Are there any deal-killer items the seller is aware of (foundation, flood, title, zoning, code violations)?
- Is there a deadline driving the sale (1031 exchange, divorce, estate, relocation)? That informs how much negotiation room exists.
- Schools are F-rated, which usually means shorter tenancies and higher turnover. Who's the typical renter profile here, and what's been the actual vacancy rate?
- Crime grade is D in this area — have there been break-ins, vandalism, or insurance claims at this property in the last 3 years? What carrier currently insures it and at what premium?
- The area grade is low — what's the realistic commute time and amenity access for the typical tenant pool here? Any planned neighborhood developments (good or bad) we should know about?
- What's the average days-on-market for RENTAL listings here right now (not sales)? A rising rental-DOM trend means longer vacancies and softer asking-rent achievability than the comps imply.
- What's the recent tenant-quality profile in this submarket — average credit score on applications, eviction rate, late-payment / NSF rate, and stable-employment percentage? A property-management company in the area should have these aggregated.
- How much new for-sale + rental construction is in the pipeline within 1–3 miles? Heavy new supply typically softens prices + rents 12–24 months out; constrained supply supports both.
Investment metrics
- 1% rule
- 0.79% ✗
- Cap rate
- 6.01%
- Cash-on-cash
- -1.01%
- DSCR
- 0.96
- GRM
- 10.5
CMA / ARV
- ARV (on-the-fly)
- $245,480
- Comps found
- 12
Show comp detail 12 sales within ~0.75 mi
| Address | Dist | Beds/Ba | Sqft | Sold | Price | $/sf | Match |
|---|---|---|---|---|---|---|---|
| 827 Shipley Way SW | 0.11mi | 3/2.0 | 1,256 (-3%) | 13mo | $222,000 | $177 | 80 |
| 1072 Woods Crossing Rd SW | 0.15mi | 3/2.0 | 1,281 (-1%) | 15mo | $243,000 | $190 | 79 |
| 815 Shipley Way SW | 0.14mi | 3/2.0 | 1,256 (-3%) | 13mo | $227,770 | $181 | 78 |
| 762 New Haven Ln SW | 0.03mi | 3/2.0 | 1,460 (+13%) | 0mo | $227,500 | $156 | 76 |
| 848 Shipley Way SW | 0.10mi | 3/2.0 | 1,204 (-7%) | 12mo | $260,000 | $216 | 74 |
| 835 Shipley Way SW | 0.09mi | 3/2.0 | 1,162 (-10%) | 16mo | $229,000 | $197 | 66 |
| 823 Shipley Way SW | 0.11mi | 3/2.0 | 1,162 (-10%) | 15mo | $229,000 | $197 | 65 |
| 933 Shipley Way SW | 0.10mi | 3/2.0 | 1,475 (+14%) | 12mo | $275,690 | $187 | 62 |
| 1211 Rippling Cove Loop SW | 0.21mi | 3/2.0 | 1,475 (+14%) | 9mo | $278,000 | $188 | 59 |
| 1283 Rippling Cove Loop SW | 0.17mi | 3/2.0 | 1,475 (+14%) | 14mo | $275,000 | $186 | 57 |
| 1231 Rippling Cove Loop SW | 0.23mi | 3/2.0 | 1,475 (+14%) | 12mo | $280,000 | $190 | 56 |
| 307 Maple Creek Rd SW | 0.63mi | 3/2.0 | 1,411 (+9%) | 10mo | $269,000 | $191 | 47 |
Match score weights: distance 35% · size 25% · config 20% · recency 20%. Top-matched comps best support the ARV.
Projected returns pro-forma
-3.0% appreciation · 3.0% rent growth · sell at horizon
- IRR
- -18.0%
- Equity multiple
- 0.37×
- Total profit
- $-45,174
- Equity at exit
- $38,021
- IRR
- -10.2%
- Equity multiple
- 0.38×
- Total profit
- $-44,386
- Equity at exit
- $22,048
Cash invested: $71,400 (down + closing). Projections, not guarantees.
Landlord ↔ Tenant lean methodology
- Overall (STATE)
- 85 Strongly Landlord-Friendly
- State North Carolina
- 85 Strongly Landlord-Friendly · R+3
- County
- — inherits STATE
- City
- — inherits STATE
ZIP-level market 28462
- Active inventory
- 506
- Price-to-rent
- 10.5×
Monthly cashflow live
- Estimated rent
- $2,027 medium interval (Pro) →
- Mortgage (P&I)
- −$1,337
- Tax from tax record
- −$83 /mo · $993/yr
- Insurance
- −$106
- HOA
- −$135
- Vacancy / Maint / Mgmt
- −$426
- Net cashflow
- $-60
Break-even live
Sensitivity live
| Price | -10% $84 | -5% $12 | +0% $-60 | +5% $-132 | +10% $-204 |
|---|---|---|---|---|---|
| Rent | -10% $-220 | -5% $-140 | +0% $-60 | +5% $20 | +10% $100 |
| Rate | -1.0pp $68 | -0.5pp $5 | base $-60 | +0.5pp $-126 | +1.0pp $-193 |
UW: 25.0% down · 7.5% · 30yr · 1.5% tax · 5.0% vac · 8.0% maint · 8.0% mgmt
Financing live
Cash to close
- Down payment
- $63,750
- Closing costs
- $7,650
- Reserves months
- —
- Total cash needed
- —
Loan-product check · same deal, 3 products live
Conventional
25% down · 7.5% · 30yr
- Down + closing
- —
- Monthly P&I
- —
- Monthly cashflow
- —
- DSCR
- —
- Eligible?
- —
Personal DTI + credit; lowest rate.
DSCR
20% down · 8.5% · 30yr
- Down + closing
- —
- Monthly P&I
- —
- Monthly cashflow
- —
- DSCR
- —
- Eligible?
- —
No personal income docs; deal must DSCR.
Hard money
10% down · 12.0% · 12mo
- Down + closing
- —
- Monthly P&I
- —
- Monthly cashflow
- —
- DSCR
- —
- Eligible?
- —
Short-term bridge; refi at stabilization.
HOA detail
- Monthly dues
- $135 · $1,620/yr
- Likely covers
- landscaping
Listing history 23 events
-
2026-06-18days on market $255,000 Active 61 DOM
-
2026-06-17days on market $255,000 Active 60 DOM
-
2026-06-16days on market $255,000 Active 59 DOM
-
2026-06-15days on market $255,000 Active 58 DOM
-
2026-06-14days on market $255,000 Active 56 DOM
-
2026-06-13days on market $255,000 Active 55 DOM
-
2026-06-10days on market $255,000 Active 53 DOM
-
2026-06-09days on market $255,000 Active 52 DOM
-
2026-06-08days on market $255,000 Active 51 DOM
-
2026-06-07days on market $255,000 Active 50 DOM
-
2026-06-05pricedays on market $255,000 Active 47 DOM
-
2026-06-03days on market $256,000 Active 46 DOM
-
2026-06-02days on market $256,000 Active 45 DOM
-
2026-06-01days on market $256,000 Active 44 DOM
-
2026-05-31days on market $256,000 Active 43 DOM
-
2026-05-30days on market $256,000 Active 42 DOM
-
2026-05-21price $256,000
-
2026-05-15price $257,000
-
2026-05-07price $258,000
-
2026-04-18$260,000 Active
-
2026-04-14historical
-
2026-03-26price $262,500
-
2026-01-18$267,500 Active
ⓘ Source: listings_history table (triggers on properties + properties_extension) + one-shot
backfill from property_details.listing_events for pre-trigger history.
Tax reassessment forecast NC · Resets to sale price
- Current annual tax
- $993 · $83/mo
- Projected year-2 tax
- $2,091 · $174/mo
- Expected delta
- +$1,098/yr (+$92/mo · 110.6%)
ⓘ Screening estimate from a state-policy table — verify with the county assessor before closing.
Climate risk First Street
- Flood 1/10 Low FEMA zone X (unshaded) · 0% chance over 30 yrs
- Wildfire 6/10 Major
- Heat 9/10 Extreme 7 d/yr ≥103°F today · 20 d/yr by 30 yrs out
- Wind 9/10 Extreme 99% chance of damaging wind over 30 yrs
- Air quality 2/10 Low 1 unhealthy d/yr today · 1 by 30 yrs out
Nearby sold comps map
Loading sold comps map…
Walkable amenities ~0.75 mi
Loading nearby amenities…
Taxation est. · year 1
- Rental income
- $24,322
- − Mortgage interest
- −$14,284
- − Property taxes
- −$993
- − Insurance
- −$1,275
- − Repairs & maintenance
- −$1,946
- − Management
- −$1,946
- − HOA
- −$1,620
- − Depreciation
- −$7,418
- Taxable loss
- −$5,159
- Est. tax savings @ 24.0%
- +$1,238
- After-tax cash flow
- $518/yr
For passive investors: Depreciation is non-cash, so a rental often shows a tax loss while cash-flowing — sheltering income. Rental losses are passive: they offset passive income freely, and up to $25,000/yr can offset ordinary (W-2) income if you actively participate and your MAGI is under $100k (phasing out to $0 by $150k); unused losses carry forward. On sale, claimed depreciation is recaptured at up to 25%, and gains may owe capital-gains tax (a 1031 exchange can defer both). Figures are a year-1 estimate at your 24.0% rate — not tax advice; consult a CPA.
Condition & rehab AI · 1 photo
This move-in ready single-family home offers upgrades and a premium private lot with wooded views, making it an excellent investment.
Value-add opportunities
- Both Landscaping improvements — Enhances curb appeal and adds value
- Both Addition of a fence — Simplifies adding a fence and enhances privacy
Renovation cost estimate screening
Value-add ROI direction
- Both Landscaping improvements — Enhances curb appeal and adds value ↑
- Both Addition of a fence — Simplifies adding a fence and enhances privacy ↑
ⓘ Cost ranges are severity-bucket heuristics (US national rule-of-thumb). Get contractor quotes + a written scope before underwriting a rehab budget.
Schools (NCES district)
- District
- Brunswick County Schools
- NCES district ID
- 3700420
- Math proficiency
- 45% ▲ 4.00%
- Reading proficiency
- 47% ▲ 4.00%
- Median HH income
- $47,494
- Composite
- 39.23/100
- National rank
- #4011
- State rank
- #82 of 178 in NC
Livability — Varnamtown
- Score
- 60/100
- State rank
- #521
- US rank
- #19194
Category grades
Schools grade is shown separately in the Schools card above.
Census & demographics
- County
- Brunswick County · 131,536 people
- Metro
- Myrtle Beach-Conway-North Myrtle Beach, SC-NC
- Population (ZIP)
- 12,340
- Household income
- $60,349
- Rent vs Own
- Severe rent burden
- 269.0
Population outlook (Brunswick County) Hauer SSP2
- Today (2025)
- 152,111 people
- By 2030
- 165,705 · +8.9%
- By 2040
- 188,494 · +23.9%
- By 2050
- 206,228 · +35.6%
- By 2075
- 237,876 · +56.4%
- By 2100
- 251,451 · +65.3%
Race, ethnicity, and origin ACS 2023
- Neighborhood character
- Predominantly White (87%)
- Race & ethnicity
- White 87% Black 7% Two or more races 5% Hispanic / Latino 2%
- Common ancestry
- Slovak 4% Lithuanian 4% Serbian 2%
- Foreign-born
- 1% · Canada
- Languages at home
- 99% English-only · Spanish 1%
Political lean MEDSL · Brunswick
- 2024 margin
- Strong R (+24.9) · D 37.2% · R 62.0%
- 2008→2024 swing
- -6.9pp toward R · 2008: -17.9pp · 2024: -24.9pp
- All cycles
- 2024: R+24.9 2020: R+25.0 2016: R+28.7 2012: R+22.2 2008: R+17.9
Not yet ingested
- Civics
- —
Market trends
- HPI YoY
- ▼ -259.44%
- Current HPI
- 144.2462
- Rent YoY
- —
- Metro
- Myrtle Beach-Conway-North Myrtle Beach, SC-NC
- State GDP YoY
- ▲ 3.28%
- F500 in state
- 26
Industry mix (Fortune 500 HQ in NC)
| Industry | F500 HQs | Revenue |
|---|---|---|
| Financial Services | 2 | $213B |
|
||
| Retail | 2 | $95B |
|
||
| Industrial Conglomerate | 1 | $38B |
|
||
| Metals / Steel | 1 | $35B |
|
||
| Utilities | 1 | $30B |
|
||
| Industrial Machinery | 1 | $19B |
|
||
Price history
-4.3% since first listed7 events — show timeline
- 2026-05-21 Price Changed $256,000 Hive MLS
- 2026-05-15 Price Changed $257,000 Hive MLS
- 2026-05-07 Price Changed $258,000 Hive MLS
- 2026-04-18 Listed $260,000 Hive MLS
- 2026-04-14 Listing Removed — Hive MLS
- 2026-03-26 Price Changed $262,500 Hive MLS
- 2026-01-18 Listed $267,500 Hive MLS
Property tax history
+619.9%/yrLatest (2025): $993 · +619.9% YoY. Source: county tax records.
Cash-flow waterfall
monthlySold comps — $/sqft
last 12 mo · ≤1 miLoading sold comps…