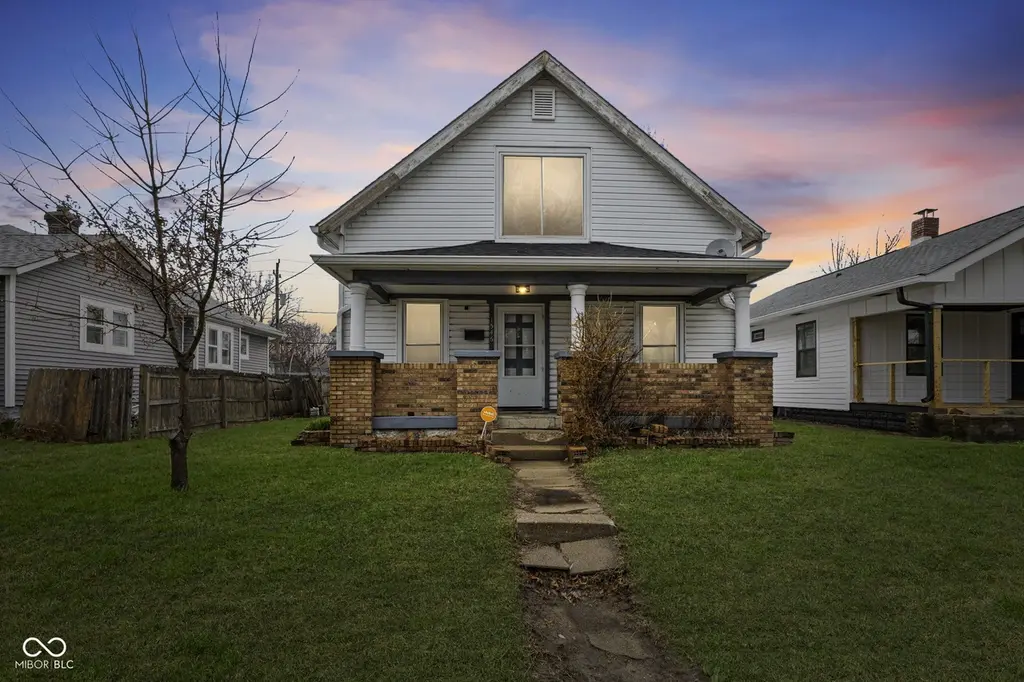
1546 Hoefgen St · Indianapolis city (balance), IN
Flood risk 1/10 · Minimal
- FEMA flood zone
- X (unshaded)
- Chance of flooding over 30 yrs
- 0.0%
- Est. flood insurance / yr
- $473 – $860
Fire risk 1/10 · Minimal
- Est. fire insurance / yr
- $717 – $1,331
Heat risk 4/10 · Minor
- Hot days now (above 101°F)
- 7 days/yr
- Hot days in 30 yrs
- 19 days/yr
Wind risk 2/10 · Minimal
- Chance of severe wind over 30 yrs
- 0.0%
Air-quality risk 3/10 · Minor
- Unhealthy air days now
- 2 days/yr
- Unhealthy air days in 30 yrs
- 3 days/yr
Risk factors via First Street. Map © Google.
Why this score? — see what drove the B- grade
The composite is a weighted blend of 9 inputs, each scored 0–100. Each bar is that input's sub-score; the figure is the points it added to the 100-point composite (weight × sub-score).
- Cash flow +27.1/30.0
- ARV discount +15.0/15.0
- DSCR +9.4/10.0
- 1% rule +6.6/10.0
- Rent growth +3.2/5.0
- Livability +2.5/5.0
- Condition / age +2.5/5.0
- Schools +1.4/10.0
- Appreciation +0.0/10.0
$120,000
🖨 Deal sheet (PDF) 📄 Offer letter ✓ Due diligence
Listing remarks MLS
Whether you're looking for your next flip or a first home where you can build massive sweat equity, this is the one. This 3-bedroom, 1-bath traditional home offers over 1,700 sq. ft. of raw potential in one of Indy's most resilient investment pockets. Rare 3-bedroom footprint at this price point. The main floor features spacious living areas and a kitchen with character-rich cabinetry and a dishwasher already in place. A full, unfinished basement provides easy access to mechanicals and significant potential for a workshop or storage. Includes a detached garage, a long private driveway for off-street parking, and a fully fenced backyard, ideal for pets or future entertaining. Commuters will love the instant access to I-65, putting Downtown Indy and the surrounding suburbs just minutes away. You're also a short bike ride from the breweries, art galleries, and nightlife of Fountain Square and the sprawling green space of Garfield Park. This property is the perfect canvas for a savvy investor or a motivated starter-home buyer ready to trade some elbow grease for a high-value asset. At this price, the equity is just waiting to be unlocked. Bring your vision and your contractor. *Roof is 8 years old, water heater 1 year old, hvac 10 years old.
Key facts
- Private driveway
- Unfinished basement
- Detached garage
Tags
Neighborhood map
What this means for you Summary
Snapshot
- This is a 2-bed/1.0-bath single-family listed at $120k.
Deal economics
- At list price, monthly cash flow is $341 ($4k/yr) — positive.
- The deal already cash-flows at list — no discount required.
- Meets the 1% rule at list price ($1k rent vs $120k).
- Recommended offer: $113k (6.0% below list) — sets the bar for market timing.
- Cap rate 9.7% vs local median 4.4% in Indianapolis city (balance) — top-decile yield for the area; either an underpriced asset or a hidden risk that comps aren't pricing in. Stress-test before assuming the spread holds.
Location & tenants
- Location reads: area grade B — affects rentability + tenant quality, not the cash-flow math above.
- Indianapolis Public Schools (urban): math 14% / reading 20% proficiency, ranked #286 of 301 in IN (top 95%) — low school quality limits family demand, transient renter base, plan for 1-2y turnover; 77% free/reduced lunch — lower-income household profile, screen leases tightly.
- Zoned schools: Frederick Douglass School 19 (math 9% / reading 13%, grade F, #909 of 994 statewide, top 92%, 444 students, 81% FRL); H L Harshman Middle School (math 3% / reading 16%, grade F, #316 of 330 statewide, top 96%, 549 students, 84% FRL).
- Market conditions: Rents rising (+2.9%/yr); 500 active listings in the ZIP; 40 comparable units currently listed for rent nearby; rentals at typical pace (median 24d on market — plan ~3-4 weeks tenant-placement turnaround); 1,906 units permitted in Marion County in 2024 (621 in 5+ unit buildings).
Forward outlook
- Local home prices are declining (-3.0%/yr); year-one equity from $830 of loan paydown is wiped out by about $4k of value loss. Plan a longer hold.
- Marion County population projected at +18% by 2050 — long-run rental-demand tailwind backs the buy-and-hold thesis.
- At projected returns (-3.0% appreciation + 2.9% rent growth), your $34k cash investment doubles in ~10 years — after that, you're playing with house money.
Negotiation context
- It's been on market 79 days — a 6% lower offer ($113k) is reasonable based on typical stale-listing flexibility.
- 2 sale attempts since 22y ago; this cycle's ask has dropped $20k (14%) from the opening price — seller is motivated, your offer sets the floor, not the list.
- Current owner paid $70k; list at $120k implies a 70% gain — meaningful room to come down on a strong offer.
Risks & watch-outs
- Watch-outs: built in 1920 — expect roof / HVAC / electrical / plumbing capex.
Questions for the listing agent
- It's been on market 79 days. Have you received any prior offers? Is the seller open to a 6% concession, seller financing, or rate buy-down credit?
- Built in 1920 — when were the roof, HVAC, electrical panel, plumbing, and water heater last replaced?
- Why hasn't it sold? Are there any deal-killer items the seller is aware of (foundation, flood, title, zoning, code violations)?
- Is there a deadline driving the sale (1031 exchange, divorce, estate, relocation)? That informs how much negotiation room exists.
- What's the average days-on-market for RENTAL listings here right now (not sales)? A rising rental-DOM trend means longer vacancies and softer asking-rent achievability than the comps imply.
- What's the recent tenant-quality profile in this submarket — average credit score on applications, eviction rate, late-payment / NSF rate, and stable-employment percentage? A property-management company in the area should have these aggregated.
- How much new for-sale + rental construction is in the pipeline within 1–3 miles? Heavy new supply typically softens prices + rents 12–24 months out; constrained supply supports both.
Investment metrics
- 1% rule
- 1.16% ✓
- Cap rate
- 9.70%
- Cash-on-cash
- 12.17%
- DSCR
- 1.54
- GRM
- 7.2
CMA / ARV
- ARV (median comp)
- $161,552
- List price
- $120,000
- Delta
- -25.72%
- Verdict
- UNDERPRICED
- Comps
- 20 within 1.0 mi
Show comp detail 12 sales within ~0.75 mi
| Address | Dist | Beds/Ba | Sqft | Sold | Price | $/sf | Match |
|---|---|---|---|---|---|---|---|
| 1513 Finley Ave | 0.07mi | 3/2.0 (+1) | 1,522 (+3%) | 1mo | $66,000 | $43 | 82 |
| 1735 E Legrande Ave | 0.48mi | 2/1.0 | 1,488 (+1%) | 4mo | $150,000 | $101 | 73 |
| 1842 E Legrande Ave | 0.57mi | 2/1.0 | 1,488 (+1%) | 1mo | $87,000 | $58 | 72 |
| 1639 Comer Ave | 0.13mi | 3/2.0 (+1) | 1,327 (-10%) | 1mo | $100,000 | $75 | 67 |
| 1426 E Bradbury Ave | 0.18mi | 3/2.0 (+1) | 1,320 (-11%) | 1mo | $208,000 | $158 | 64 |
| 2027 Spruce St | 0.49mi | 3/2.0 (+1) | 1,432 (-3%) | 1mo | $210,000 | $147 | 62 |
| 2165 Napoleon St | 0.66mi | 3/2.0 (+1) | 1,465 (-1%) | 1mo | $140,000 | $96 | 58 |
| 1850 E Legrande Ave | 0.58mi | 2/1.0 | 1,344 (-9%) | 1mo | $145,000 | $108 | 57 |
| 1127 E Kelly St | 0.39mi | 2/2.0 | 1,280 (-13%) | 2mo | $185,000 | $145 | 54 |
| 1518 E Legrande Ave | 0.46mi | 2/2.0 | 1,296 (-12%) | 3mo | $177,000 | $137 | 51 |
| 2020 Mac Ct | 0.51mi | 3/1.0 (+1) | 1,314 (-11%) | 4mo | $185,000 | $141 | 49 |
| 2658 Allen Ave | 0.69mi | 2/1.0 | 1,696 (+15%) | 0mo | $210,000 | $124 | 43 |
Match score weights: distance 35% · size 25% · config 20% · recency 20%. Top-matched comps best support the ARV.
Projected returns pro-forma
-3.0% appreciation · 2.88% rent growth · sell at horizon
- IRR
- 1.6%
- Equity multiple
- 1.06×
- Total profit
- $2,059
- Equity at exit
- $17,892
- IRR
- 11.1%
- Equity multiple
- 1.86×
- Total profit
- $28,944
- Equity at exit
- $10,375
Cash invested: $33,600 (down + closing). Projections, not guarantees.
Landlord ↔ Tenant lean methodology
- Overall (STATE)
- 90 Strongly Landlord-Friendly
- State Indiana
- 90 Strongly Landlord-Friendly · R+11
- County
- — inherits STATE
- City
- — inherits STATE
ZIP-level market 46203
- Home prices YoY
- -26.7%
- Rents YoY
- 2.9%
- Active inventory
- 500
- Price-to-rent
- 7.2×
Monthly cashflow live
- Estimated rent
- $1,387 high interval (Pro) →
- Mortgage (P&I)
- −$629
- Tax from tax record
- −$76 /mo · $908/yr
- Insurance
- −$50
- HOA
- −$0
- Vacancy / Maint / Mgmt
- −$291
- Net cashflow
- $341
Break-even live
Sensitivity live
| Price | -10% $409 | -5% $375 | +0% $341 | +5% $307 | +10% $273 |
|---|---|---|---|---|---|
| Rent | -10% $231 | -5% $286 | +0% $341 | +5% $395 | +10% $450 |
| Rate | -1.0pp $401 | -0.5pp $371 | base $341 | +0.5pp $310 | +1.0pp $278 |
UW: 25.0% down · 7.5% · 30yr · 1.5% tax · 5.0% vac · 8.0% maint · 8.0% mgmt
Financing live
Cash to close
- Down payment
- $30,000
- Closing costs
- $3,600
- Reserves months
- —
- Total cash needed
- —
Loan-product check · same deal, 3 products live
Conventional
25% down · 7.5% · 30yr
- Down + closing
- —
- Monthly P&I
- —
- Monthly cashflow
- —
- DSCR
- —
- Eligible?
- —
Personal DTI + credit; lowest rate.
DSCR
20% down · 8.5% · 30yr
- Down + closing
- —
- Monthly P&I
- —
- Monthly cashflow
- —
- DSCR
- —
- Eligible?
- —
No personal income docs; deal must DSCR.
Hard money
10% down · 12.0% · 12mo
- Down + closing
- —
- Monthly P&I
- —
- Monthly cashflow
- —
- DSCR
- —
- Eligible?
- —
Short-term bridge; refi at stabilization.
Rent comps 40 comps
| Address | Beds | Baths | Sqft | Rent | $/sqft | DOM | Units | Dist |
|---|---|---|---|---|---|---|---|---|
| 1549 Nelson Ave Indianapolis, IN | 3.0 | 1.0 | 950 | $1,380 | $1.45 | 45d | 1 | 0.26mi |
| 1706 E Tabor St Unit 1708 Indianapolis, IN | 3.0 | 1.0 | 1000 | $1,300 | $1.30 | 9d | 1 | 0.38mi |
| 2714 Dawson St Indianapolis, IN | 3.0 | 1.0 | 912 | $1,500 | $1.64 | 0d | 1 | 0.42mi |
| 2633 S Randolph St Unit b Indianapolis, IN | 2.0 | 1.0 | 900 | $995 | $1.11 | 25d | 1 | 0.44mi |
| 2633 S Randolph St Indianapolis, IN | 2.0 | 1.0 | 900 | $995 | $1.11 | 12d | 1 | 0.44mi |
| 1144 McDougal St Indianapolis, IN | 3.0 | 1.0 | 876 | $1,500 | $1.71 | 23d | 1 | 0.47mi |
| 2020 Boyd Ave Indianapolis, IN | 3.0 | 1.5 | 1160 | $1,450 | $1.25 | 25d | 1 | 0.55mi |
| 2018 Boyd Ave Indianapolis, IN | 3.0 | 1.5 | 1160 | $1,350 | $1.16 | 45d | 1 | 0.55mi |
| 1011 E Raymond St Indianapolis, IN | 2.0 | 2.0 | 1100 | $1,350 | $1.23 | 25d | 1 | 0.59mi |
| 2103 Ringgold Ave Indianapolis, IN | 1.0 | 1.0 | 1090 | $775 | $0.71 | 15d | 1 | 0.70mi |
| 2036 Calhoun St Indianapolis, IN | 2.0 | 1.0 | 880 | $1,200 | $1.36 | 9d | 1 | 0.72mi |
| 2430 E Kelly St Indianapolis, IN | 2.0 | 1.0 | 965 | $949 | $0.98 | 45d | 1 | 0.76mi |
| 1258 E Naomi St Indianapolis, IN | 3.0 | 2.0 | 1608 | $1,450 | $0.90 | 9d | 1 | 0.77mi |
| 1117 E Naomi St Indianapolis, IN | 2.0 | 1.5 | 976 | $1,450 | $1.49 | 0d | 1 | 0.78mi |
| 1815 Dawson St Unit 1815 Indianapolis, IN | 2.0 | 1.0 | 1019 | $999 | $0.98 | 16d | 1 | 0.81mi |
| 1861 Barth Ave Unit 1861 Indianapolis, IN | 2.0 | 1.0 | 1300 | $1,600 | $1.23 | 25d | 1 | 0.82mi |
| 1742 Thaddeus St Unit 1742-A Indianapolis, IN | 3.0 | 2.0 | 1350 | $1,600 | $1.19 | 15d | 1 | 0.83mi |
| 1729 Thaddeus St Unit 1729-B Indianapolis, IN | 3.0 | 2.0 | 1350 | $1,600 | $1.19 | 15d | 1 | 0.85mi |
| 2109 Singleton St Indianapolis, IN | 3.0 | 2.0 | 1340 | $2,100 | $1.57 | 9d | 1 | 0.93mi |
| 2770 South East St Unit 302 Indianapolis, IN | 3.0 | 2.0 | 1158 | $1,015 | $0.88 | 4d | 1 | 0.96mi |
| 2770 S East St Apt 103 Indianapolis, IN | 3.0 | 2.0 | 1190 | $1,045 | $0.88 | 16d | 1 | 0.96mi |
| 3311 Linden St Indianapolis, IN | 3.0 | 1.0 | 1056 | $1,150 | $1.09 | 45d | 1 | 0.97mi |
| 2760 S East St Indianapolis, IN | 2.0–3.0 | 2.0 | 1072 | $895 | $0.83 | 5d | 3 | 0.97mi |
| 1602 Quill St Unit B Indianapolis, IN | 3.0 | 2.0 | 1250 | $1,525 | $1.22 | 0d | 1 | 0.98mi |
| 1602 Quill St Unit B Indianapolis, IN | 3.0 | 2.0 | 1250 | $1,750 | $1.40 | 45d | 1 | 0.98mi |
| 1602 Quill St Unit B Indianapolis, IN | 3.0 | 2.0 | 1250 | $1,650 | $1.32 | 16d | 1 | 0.98mi |
| 1543 S State Ave Indianapolis, IN | 2.0 | 1.0 | 1086 | $1,100 | $1.01 | 9d | 1 | 0.99mi |
| 1703 Ringgold Ave Indianapolis, IN | 3.0 | 2.0 | 1712 | $1,700 | $0.99 | 0d | 1 | 1.00mi |
| 3334 Laurel St Indianapolis, IN | 3.0 | 1.0 | 1068 | $1,200 | $1.12 | 22d | 1 | 1.02mi |
| 620 E Beecher St Indianapolis, IN | 3.0 | 2.0 | 1072 | $1,639 | $1.53 | 21d | 1 | 1.03mi |
| 3312 Olive St Indianapolis, IN | 3.0 | 2.0 | 1000 | $1,395 | $1.40 | 25d | 1 | 1.03mi |
| 3319 Olive St Indianapolis, IN | 3.0 | 2.0 | 1588 | $1,450 | $0.91 | 25d | 1 | 1.03mi |
| 1534 Dawson St Indianapolis, IN | 3.0 | 1.0 | 1040 | $1,499 | $1.44 | 25d | 1 | 1.04mi |
| 944 E Minnesota St Indianapolis, IN | 2.0 | 2.0 | 944 | $1,299 | $1.38 | 45d | 1 | 1.05mi |
| 1833 Orleans St Unit 1 Indianapolis, IN | 3.0 | 1.0 | 1260 | $1,350 | $1.07 | 45d | 1 | 1.05mi |
| 1830 Orleans St Indianapolis, IN | 3.0 | 2.5 | 1586 | $1,995 | $1.26 | 45d | 1 | 1.07mi |
| 438 E Beecher St Indianapolis, IN | 3.0 | 2.5 | 1500 | $1,450 | $0.97 | 25d | 1 | 1.12mi |
| 835 Weghorst St Unit 837 Indianapolis, IN | 3.0 | 1.5 | 1500 | $1,399 | $0.93 | 25d | 1 | 1.18mi |
| 1514 Ringgold Ave Indianapolis, IN | 3.0 | 1.0 | 1064 | $1,295 | $1.22 | 45d | 1 | 1.19mi |
| 512 E Minnesota St Unit 203 Indianapolis, IN | 2.0 | 1.0 | 903 | $1,195 | $1.32 | 25d | 1 | 1.23mi |
Listing history 13 events
-
2026-06-21days on market $120,000 Active 79 DOM
-
2026-06-18status $120,000 Active 76 DOM
-
2026-06-13statusdays on market $120,000 Pending 76 DOM
-
2026-06-09days on market $120,000 Active 73 DOM
-
2026-06-08days on market $120,000 Active 72 DOM
-
2026-06-07days on market $120,000 Active 71 DOM
-
2026-06-03days on market $120,000 Active 67 DOM
-
2026-06-02days on market $120,000 Active 66 DOM
-
2026-06-02pricestatus $120,000 Active 65 DOM
-
2026-04-18price $135,000 1257-char remark
Show marketing remark (1257 chars)
Whether you're looking for your next flip or a first home where you can build massive sweat equity, this is the one. This 3-bedroom, 1-bath traditional home offers over 1,700 sq. ft. of raw potential in one of Indy's most resilient investment pockets. Rare 3-bedroom footprint at this price point. The main floor features spacious living areas and a kitchen with character-rich cabinetry and a dishwasher already in place. A full, unfinished basement provides easy access to mechanicals and significant potential for a workshop or storage. Includes a detached garage, a long private driveway for off-street parking, and a fully fenced backyard, ideal for pets or future entertaining. Commuters will love the instant access to I-65, putting Downtown Indy and the surrounding suburbs just minutes away. You're also a short bike ride from the breweries, art galleries, and nightlife of Fountain Square and the sprawling green space of Garfield Park. This property is the perfect canvas for a savvy investor or a motivated starter-home buyer ready to trade some elbow grease for a high-value asset. At this price, the equity is just waiting to be unlocked. Bring your vision and your contractor. *Roof is 8 years old, water heater 1 year old, hvac 10 years old.
-
2026-03-16$140,000 Active 1257-char remark
Show marketing remark (1257 chars)
Whether you're looking for your next flip or a first home where you can build massive sweat equity, this is the one. This 3-bedroom, 1-bath traditional home offers over 1,700 sq. ft. of raw potential in one of Indy's most resilient investment pockets. Rare 3-bedroom footprint at this price point. The main floor features spacious living areas and a kitchen with character-rich cabinetry and a dishwasher already in place. A full, unfinished basement provides easy access to mechanicals and significant potential for a workshop or storage. Includes a detached garage, a long private driveway for off-street parking, and a fully fenced backyard, ideal for pets or future entertaining. Commuters will love the instant access to I-65, putting Downtown Indy and the surrounding suburbs just minutes away. You're also a short bike ride from the breweries, art galleries, and nightlife of Fountain Square and the sprawling green space of Garfield Park. This property is the perfect canvas for a savvy investor or a motivated starter-home buyer ready to trade some elbow grease for a high-value asset. At this price, the equity is just waiting to be unlocked. Bring your vision and your contractor. *Roof is 8 years old, water heater 1 year old, hvac 10 years old.
-
2004-12-30soldstatus $70,400 289-char remark
Show marketing remark (289 chars)
This house is ready to move in and has it all! Newer a/c, furnace roof, plumbing, water heater, stove, refrigerator, microwave; 3 large bedrooms; nicely updated bath, family room; dining room, large kitchen; bonus room/ office; 3-car garage;and fenced yard. 2054 sq ft. See this one soon!
-
2004-05-03$69,900 289-char remark
Show marketing remark (289 chars)
This house is ready to move in and has it all! Newer a/c, furnace roof, plumbing, water heater, stove, refrigerator, microwave; 3 large bedrooms; nicely updated bath, family room; dining room, large kitchen; bonus room/ office; 3-car garage;and fenced yard. 2054 sq ft. See this one soon!
ⓘ Source: listings_history table (triggers on properties + properties_extension) + one-shot
backfill from property_details.listing_events for pre-trigger history.
Tax reassessment forecast IN · Partial reset (capped growth)
- Current annual tax
- $908 · $76/mo
- Projected year-2 tax
- $964 · $80/mo
- Expected delta
- +$56/yr (+$5/mo · 6.2%)
ⓘ Screening estimate from a state-policy table — verify with the county assessor before closing.
Climate risk First Street
- Flood 1/10 Low FEMA zone X (unshaded) · 0% chance over 30 yrs
- Wildfire 1/10 Low
- Heat 4/10 Moderate 7 d/yr ≥101°F today · 19 d/yr by 30 yrs out
- Wind 2/10 Low 0% chance of damaging wind over 30 yrs
- Air quality 3/10 Moderate 2 unhealthy d/yr today · 3 by 30 yrs out
Nearby sold comps map
Loading sold comps map…
Walkable amenities ~0.75 mi
Loading nearby amenities…
Taxation est. · year 1
- Rental income
- $16,642
- − Mortgage interest
- −$6,722
- − Property taxes
- −$908
- − Insurance
- −$600
- − Repairs & maintenance
- −$1,331
- − Management
- −$1,331
- − Depreciation
- −$3,491
- Taxable income
- $2,259
- Est. tax owed @ 24.0%
- −$542
- After-tax cash flow
- $3,546/yr
For passive investors: Depreciation is non-cash, so a rental often shows a tax loss while cash-flowing — sheltering income. Rental losses are passive: they offset passive income freely, and up to $25,000/yr can offset ordinary (W-2) income if you actively participate and your MAGI is under $100k (phasing out to $0 by $150k); unused losses carry forward. On sale, claimed depreciation is recaptured at up to 25%, and gains may owe capital-gains tax (a 1031 exchange can defer both). Figures are a year-1 estimate at your 24.0% rate — not tax advice; consult a CPA.
Schools (NCES district)
- District
- Indianapolis Public Schools
- NCES district ID
- 1804770
- Math proficiency
- 14% ▼ -7.00%
- Reading proficiency
- 20% ▼ -3.00%
- Median HH income
- $32,034
- Composite
- 13.69/100
- National rank
- #9499
- State rank
- #286 of 301 in IN
Livability — Indianapolis city (balance)
No livability data for this city. (Only ~50 U.S. cities are tracked.)
Census & demographics
- Census place
- Indianapolis city (balance), IN
- County
- Marion County · 998,460 people
- City population
- 881,119
- Metro
- Indianapolis-Carmel-Anderson, IN
- Population (ZIP)
- 37,758
- Household income
- $57,393
- Rent vs Own
- Severe rent burden
- 1499.0
Population outlook (Marion County) Hauer SSP2
- Today (2025)
- 1,025,572 people
- By 2030
- 1,065,727 · +3.9%
- By 2040
- 1,141,577 · +11.3%
- By 2050
- 1,208,920 · +17.9%
- By 2075
- 1,367,288 · +33.3%
- By 2100
- 1,438,201 · +40.2%
Race, ethnicity, and origin ACS 2023
- Neighborhood character
- Predominantly White (69%)
- Race & ethnicity
- White 69% Hispanic / Latino 14% Black 12% Two or more races 8% Asian 2% Native American 1%
- Hispanic origin (detail)
- Mexican 12% Puerto Rican 1%
- Common ancestry
- Slovak 2% Lithuanian 2% Italian 1%
- Foreign-born
- 8% · Canada
- Languages at home
- 88% English-only · Spanish 10% Other Indo-European 1%
Political lean MEDSL · Marion
- 2024 margin
- Strong D (+27.7) · D 63.0% · R 35.3% · Other 1.7%
- 2008→2024 swing
- -0.7pp no change · 2008: 28.4pp · 2024: 27.7pp
- All cycles
- 2024: D+27.7 2020: D+29.1 2016: D+22.8 2012: D+22.2 2008: D+28.4
Not yet ingested
- Civics
- —
Market trends
- HPI YoY
- ▼ -127.37%
- Current HPI
- 349.579
- Rent YoY
- ▲ 2.88%
- Metro
- Indianapolis-Carmel-Anderson, IN
- State GDP YoY
- ▲ 2.90%
- F500 in state
- 18
Industry mix (Fortune 500 HQ in IN)
| Industry | F500 HQs | Revenue |
|---|---|---|
| Industrial Machinery | 2 | $37B |
|
||
| Healthcare | 1 | $177B |
|
||
| Pharmaceuticals | 1 | $45B |
|
||
| Metals / Steel | 1 | $18B |
|
||
| Agriculture | 1 | $17B |
|
||
| Packaging | 1 | $12B |
|
||
Price history
+93.1% since first listed4 events — show timeline
- 2026-04-18 Price Changed $135,000 MIBOR as Distributed by MLS Grid
- 2026-03-16 Listed $140,000 MIBOR as Distributed by MLS Grid
- 2004-12-30 Sold (MLS) $70,400 MIBOR as Distributed by MLS Grid
- 2004-05-03 Listed $69,900 MIBOR as Distributed by MLS Grid
Property tax history
+11.6%/yrLatest (2025): $908 · +11.8% YoY. Source: county tax records.
Cash-flow waterfall
monthlySold comps — $/sqft
last 12 mo · ≤1 miLoading sold comps…