645 W Kilpatrick St · Mineola, TX
Flood risk 1/10 · Minimal
- FEMA flood zone
- X (unshaded)
- Chance of flooding over 30 yrs
- 0.0%
- Est. flood insurance / yr
- $507 – $1,088
Fire risk 4/10 · Minor
- Est. fire insurance / yr
- $1,222 – $2,270
Heat risk 7/10 · Major
- Hot days now (above 110°F)
- 7 days/yr
- Hot days in 30 yrs
- 25 days/yr
Wind risk 6/10 · Moderate
- Chance of severe wind over 30 yrs
- 50.0%
Air-quality risk 2/10 · Minimal
- Unhealthy air days now
- 1 days/yr
- Unhealthy air days in 30 yrs
- 1 days/yr
Risk factors via First Street. Map © Google.
Why this score? — see what drove the C+ grade
The composite is a weighted blend of 9 inputs, each scored 0–100. Each bar is that input's sub-score; the figure is the points it added to the 100-point composite (weight × sub-score).
- Cash flow +22.6/30.0
- ARV discount +15.0/15.0
- DSCR +7.2/10.0
- 1% rule +6.7/10.0
- Schools +4.2/10.0
- Livability +3.5/5.0
- Rent growth +2.5/5.0
- Condition / age +2.5/5.0
- Appreciation +0.0/10.0
$135,000
🖨 Deal sheet 📄 Offer letter ✓ Due diligence
Listing remarks
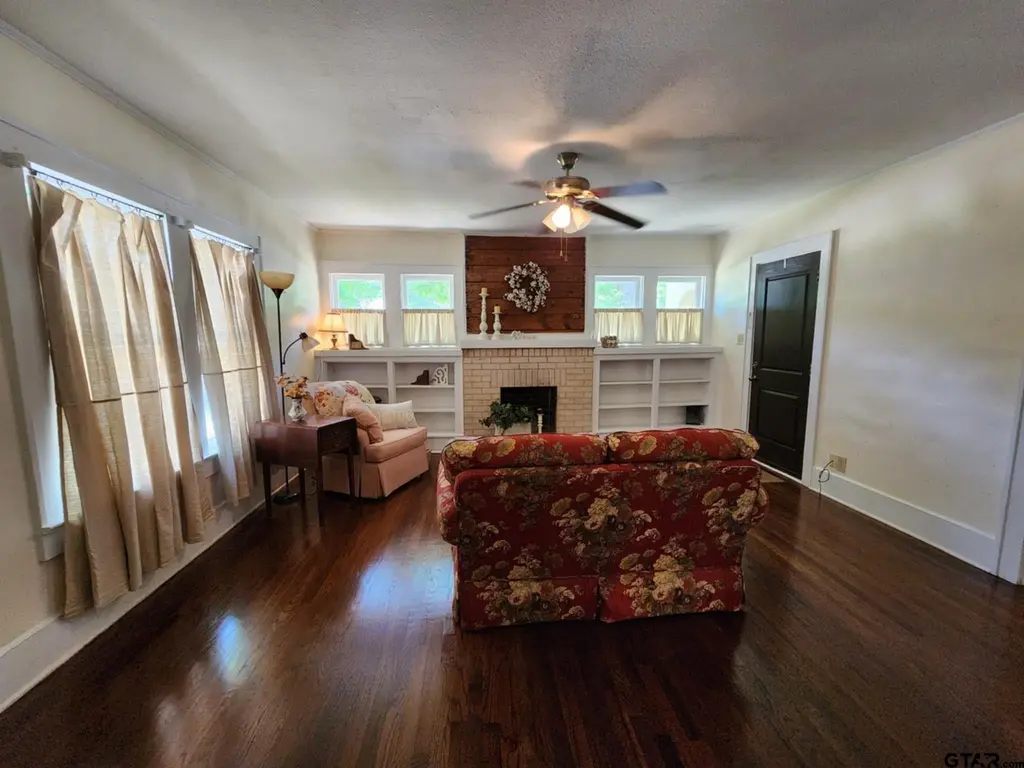
Charming Mineola Gem! Welcome to this beautifully remodeled 2-bedroom, 1 bathroom home in the heart of Mineola, TX! Located just a short stroll from downtown, this charming property offers the perfect blend of small-town charm and modern amenities. Perfect for a first-time home buyer or a retiree. As soon as you step inside, you're greeted by the warmth of original hardwood floors, beautifully preserved and refinished to perfection. The interior design is enhanced by shiplap accents, adding a touch of rustic charm to this already delightful home. This home is bursting with character. Glass doorknobs, original wood built-ins and fireplace just to name a few. This home has been thoughtfully r
Key facts
- 8,276 sq ft lot
- Built 1930
Neighborhood map
What this means for you Summary
Snapshot
- This is a 2-bed/2.0-bath single-family listed at $135k.
Deal economics
- At list price, monthly cash flow is $229 ($3k/yr) — positive.
- The deal already cash-flows at list — no discount required.
- Meets the 1% rule at list price ($2k rent vs $135k).
- Cap rate 8.3% vs local median 2.6% in Mineola — top-decile yield for the area; either an underpriced asset or a hidden risk that comps aren't pricing in. Stress-test before assuming the spread holds.
Location & tenants
- Location reads 69/100 on livability (#392 in TX) — a middle-class / working-renter tenant base. Strengths: cost of living A+, housing A+, health & safety A; Watch: employment D, amenities F, commute F.
- Mineola ISD (town): math 54% / reading 46% proficiency, ranked #190 of 826 in TX (top 23%) — acceptable for families but not a draw, mixed tenant base, ~2y average lease.
- Zoned schools: Mineola El (math 51% / reading 37%, grade F, #1,243 of 4,322 statewide, top 29%, 353 students, 69% FRL); Mineola Middle (math 60% / reading 51%, grade B-, #240 of 1,662 statewide, top 15%, 381 students, 69% FRL); Mineola H S (math 42% / reading 57%, grade D, #509 of 1,632 statewide, top 34%, 466 students, 62% FRL).
- Market conditions: 261 active listings in the ZIP; 10 comparable units currently listed for rent nearby; rentals at typical pace (median 21d on market — plan ~3-4 weeks tenant-placement turnaround); 40% of comp listings sitting > 30 days — soft ceiling on asking rent; 72 units permitted in Wood County in 2024 (29 in 5+ unit buildings).
Forward outlook
- Local home prices are declining (-3.0%/yr); year-one equity from $933 of loan paydown is wiped out by about $4k of value loss. Plan a longer hold.
- Wood County population projected at +12% by 2050 — modest demand growth; plan on rents tracking national, not racing it.
Negotiation context
- Only 0 days on market — expect competitive offers; lowballing is unlikely to land.
Risks & watch-outs
- Watch-outs: built in 1930 — expect roof / HVAC / electrical / plumbing capex.
- Climate carrying-cost: major wind risk, 50% chance of damaging wind over 30y; extreme-heat days projected 7→25/yr by 2055 (HVAC capex compounding) — expect insurance premiums to compound above CPI over the hold.
Questions for the listing agent
- Built in 1930 — when were the roof, HVAC, electrical panel, plumbing, and water heater last replaced?
- Is there a deadline driving the sale (1031 exchange, divorce, estate, relocation)? That informs how much negotiation room exists.
- Schools are D-rated, which usually means shorter tenancies and higher turnover. Who's the typical renter profile here, and what's been the actual vacancy rate?
- What's the average days-on-market for RENTAL listings here right now (not sales)? A rising rental-DOM trend means longer vacancies and softer asking-rent achievability than the comps imply.
- What's the recent tenant-quality profile in this submarket — average credit score on applications, eviction rate, late-payment / NSF rate, and stable-employment percentage? A property-management company in the area should have these aggregated.
- How much new for-sale + rental construction is in the pipeline within 1–3 miles? Heavy new supply typically softens prices + rents 12–24 months out; constrained supply supports both.
Investment metrics
- 1% rule
- 1.17% ✓
- Cap rate
- 8.33%
- Cash-on-cash
- 7.26%
- DSCR
- 1.32
- GRM
- 7.1
CMA / ARV
- ARV (on-the-fly)
- $168,210
- Comps found
- 7
Show comp detail 7 sales within ~0.75 mi
| Address | Dist | Beds/Ba | Sqft | Sold | Price | $/sf | Match |
|---|---|---|---|---|---|---|---|
| 425 N Newsom St | 0.70mi | 2/2.0 | 1,265 (+2%) | 10mo | $179,000 | $142 | 56 |
| 605 N Line | 0.61mi | 3/2.0 (+1) | 1,305 (+5%) | 4mo | $160,000 | $123 | 55 |
| 516 W Blair St | 0.19mi | 3/2.0 (+1) | 1,366 (+10%) | 22mo | $170,000 | $124 | 52 |
| 1265 Fm 1799 | 0.58mi | 3/2.0 (+1) | 1,388 (+11%) | 4mo | $249,900 | $180 | 46 |
| 601 N Newsom St | 0.74mi | 3/2.0 (+1) | 1,314 (+6%) | 12mo | $59,000 | $45 | 41 |
| 208 W Kilpatrick St | 0.45mi | 2/1.0 | 1,078 (-14%) | 19mo | $175,000 | $162 | 37 |
| 107 Frances | 0.73mi | 2/1.0 | 1,073 (-14%) | 19mo | $145,000 | $135 | 23 |
Match score weights: distance 35% · size 25% · config 20% · recency 20%. Top-matched comps best support the ARV.
Projected returns pro-forma
-3.0% appreciation · 3.0% rent growth · sell at horizon
- IRR
- -5.1%
- Equity multiple
- 0.81×
- Total profit
- $-7,230
- Equity at exit
- $20,129
- IRR
- 4.6%
- Equity multiple
- 1.34×
- Total profit
- $12,785
- Equity at exit
- $11,672
Cash invested: $37,800 (down + closing). Projections, not guarantees.
Landlord ↔ Tenant lean methodology
- Overall (STATE)
- 87 Strongly Landlord-Friendly
- State Texas
- 87 Strongly Landlord-Friendly · R+5
- County
- — inherits STATE
- City
- — inherits STATE
ZIP-level market 75773
- Home prices YoY
- -8.9%
- Active inventory
- 261
- Price-to-rent
- 7.1×
Monthly cashflow live
- Estimated rent
- $1,586 high interval (Pro) →
- Mortgage (P&I)
- −$708
- Tax from tax record
- −$260 /mo · $3,120/yr
- Insurance
- −$56
- HOA
- −$0
- Vacancy / Maint / Mgmt
- −$333
- Net cashflow
- $229
Break-even live
UW: 25.0% down · 7.5% · 30yr · 1.5% tax · 5.0% vac · 8.0% maint · 8.0% mgmt
Financing live
Cash to close
- Down payment
- $33,750
- Closing costs
- $4,050
- Reserves months
- —
- Total cash needed
- —
Loan-product check · same deal, 3 products live
Conventional
25% down · 7.5% · 30yr
- Down + closing
- —
- Monthly P&I
- —
- Monthly cashflow
- —
- DSCR
- —
- Eligible?
- —
Personal DTI + credit; lowest rate.
DSCR
20% down · 8.5% · 30yr
- Down + closing
- —
- Monthly P&I
- —
- Monthly cashflow
- —
- DSCR
- —
- Eligible?
- —
No personal income docs; deal must DSCR.
Hard money
10% down · 12.0% · 12mo
- Down + closing
- —
- Monthly P&I
- —
- Monthly cashflow
- —
- DSCR
- —
- Eligible?
- —
Short-term bridge; refi at stabilization.
Rent comps 10 comps
| Address | Beds | Baths | Sqft | Rent | $/sqft | DOM | Units | Dist |
|---|---|---|---|---|---|---|---|---|
| 409 Chapparel St Mineola, TX | 3.0 | 1.0 | 1424 | $1,400 | $0.98 | 44d | 1 | 0.41mi |
| 803 Second St Mineola, TX | 3.0 | 1.0 | 1160 | $1,400 | $1.21 | 13d | 1 | 0.56mi |
| 806 S Newsom St Mineola, TX | 3.0 | 2.5 | 1488 | $1,750 | $1.18 | 21d | 1 | 0.77mi |
| 806 N Newsom St Mineola, TX | 3.0 | 2.5 | 1488 | $1,750 | $1.18 | 44d | 1 | 0.88mi |
| 515 Giraud St Mineola, TX | 3.0 | 2.0 | 1400 | $1,700 | $1.21 | 21d | 1 | 0.91mi |
| 167 Blue Bird Ln Mineola, TX | 1.0–2.0 | 1.0–2.0 | 805 | $1,350 | $1.68 | 13d | 5 | 1.22mi |
| 150 Blue Bird Ln Mineola, TX | 3.0 | 2.0 | 1250 | $1,750 | $1.40 | 44d | 1 | 1.29mi |
| 233 Blue Bird Ln Mineola, TX | 3.0 | 2.0 | 1202 | $1,700 | $1.41 | 21d | 1 | 1.30mi |
| 211 Blue Bird Ln Mineola, TX | 3.0 | 2.0 | 1202 | $1,700 | $1.41 | 21d | 1 | 1.30mi |
| 211 Blue Bird Ln Mineola, TX | 3.0 | 2.0 | 1202 | $1,700 | $1.41 | 44d | 1 | 1.30mi |
Listing history 8 events
-
2026-06-13days on market $135,000 Pending
-
2026-04-27status Pending
-
2026-04-10price $135,000
-
2025-11-21$139,500 Active
-
2025-10-16price $139,500
-
2025-08-13price $149,500
-
2025-07-11price $154,900
-
1995-02-23soldstatus
ⓘ Source: listings_history table (triggers on properties + properties_extension) + one-shot
backfill from property_details.listing_events for pre-trigger history.
Tax reassessment forecast TX · Resets to sale price
- Current annual tax
- $3,120 · $260/mo
- Projected year-2 tax
- $3,120 · $260/mo
- Expected delta
- $0/yr ($0/mo · 0.0%)
ⓘ Screening estimate from a state-policy table — verify with the county assessor before closing.
Climate risk First Street
- Flood 1/10 Low FEMA zone X (unshaded) · 0% chance over 30 yrs
- Wildfire 4/10 Moderate
- Heat 7/10 Severe 7 d/yr ≥110°F today · 25 d/yr by 30 yrs out
- Wind 6/10 Major 50% chance of damaging wind over 30 yrs
- Air quality 2/10 Low 1 unhealthy d/yr today · 1 by 30 yrs out
Nearby sold comps map
Loading sold comps map…
Walkable amenities ~0.75 mi
Loading nearby amenities…
Taxation est. · year 1
- Rental income
- $19,032
- − Mortgage interest
- −$7,562
- − Property taxes
- −$3,120
- − Insurance
- −$675
- − Repairs & maintenance
- −$1,523
- − Management
- −$1,523
- − Depreciation
- −$3,927
- Taxable income
- $702
- Est. tax owed @ 24.0%
- −$168
- After-tax cash flow
- $2,576/yr
For passive investors: Depreciation is non-cash, so a rental often shows a tax loss while cash-flowing — sheltering income. Rental losses are passive: they offset passive income freely, and up to $25,000/yr can offset ordinary (W-2) income if you actively participate and your MAGI is under $100k (phasing out to $0 by $150k); unused losses carry forward. On sale, claimed depreciation is recaptured at up to 25%, and gains may owe capital-gains tax (a 1031 exchange can defer both). Figures are a year-1 estimate at your 24.0% rate — not tax advice; consult a CPA.
Schools (NCES district)
- District
- Mineola ISD
- NCES district ID
- 4830930
- Math proficiency
- 54% ▲ 12.00%
- Reading proficiency
- 46% ▲ 4.00%
- Median HH income
- $44,121
- Composite
- 42.27/100
- National rank
- #3274
- State rank
- #190 of 826 in TX
Livability — Mineola
- Score
- 69/100
- State rank
- #392
- US rank
- #8222
Category grades
Schools grade is shown separately in the Schools card above.
Census & demographics
- Census place
- Mineola, TX
- Population (ZIP)
- 14,311
Population outlook (Wood County) Hauer SSP2
- Today (2025)
- 46,480 people
- By 2030
- 47,796 · +2.8%
- By 2040
- 50,142 · +7.9%
- By 2050
- 52,122 · +12.1%
- By 2075
- 57,033 · +22.7%
- By 2100
- 56,418 · +21.4%
Race, ethnicity, and origin ACS 2023
- Neighborhood character
- Predominantly White (79%)
- Race & ethnicity
- White 79% Hispanic / Latino 14% Two or more races 8% Black 4%
- Hispanic origin (detail)
- Mexican 10%
- Common ancestry
- Lithuanian 2% Slovak 2% Serbian 1%
- Foreign-born
- 4% · Canada
- Languages at home
- 91% English-only · Spanish 7% German/W. Germanic 1%
Political lean MEDSL · Wood
- 2024 margin
- Solid R (+69.7) · D 14.8% · R 84.6%
- 2008→2024 swing
- -15.5pp toward R · 2008: -54.2pp · 2024: -69.7pp
- All cycles
- 2024: R+69.7 2020: R+68.2 2016: R+70.0 2012: R+64.2 2008: R+54.2
Not yet ingested
- Civics
- —
Market trends
- HPI YoY
- ▼ -22.31%
- Current HPI
- 227.0529
- Rent YoY
- —
- Metro
- —
- State GDP YoY
- ▲ 3.95%
- F500 in state
- 110
Industry mix (Fortune 500 HQ in TX)
| Industry | F500 HQs | Revenue |
|---|---|---|
| Energy | 16 | $1,198B |
|
||
| Technology | 5 | $198B |
|
||
| Engineering / Construction | 4 | $72B |
|
||
| Energy Services | 3 | $60B |
|
||
| Utilities | 3 | $41B |
|
||
| Healthcare | 2 | $330B |
|
||
Price history
-12.8% since first listed7 events — show timeline
- 2026-04-27 Pending — GTAR
- 2026-04-10 Price Changed $135,000 GTAR
- 2025-11-21 Listed $139,500 GTAR
- 2025-10-16 Price Changed $139,500 GTAR
- 2025-08-13 Price Changed $149,500 GTAR
- 2025-07-11 Price Changed $154,900 GTAR
- 1995-02-23 Sold (Public Records) — Public Records
Property tax history
+22.2%/yrLatest (2025): $3,120 · +8.3% YoY. Source: county tax records.
Cash-flow waterfall
monthlySold comps — $/sqft
last 12 mo · ≤1 miLoading sold comps…