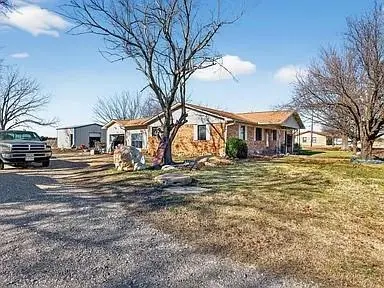
801 N Main St · Dodd City, TX
Flood risk 1/10 · Minimal
- FEMA flood zone
- X (unshaded)
- Chance of flooding over 30 yrs
- 0.0%
- Est. flood insurance / yr
- $507 – $1,088
Fire risk 8/10 · Major
- Est. fire insurance / yr
- $1,222 – $2,270
Heat risk 7/10 · Major
- Hot days now (above 110°F)
- 7 days/yr
- Hot days in 30 yrs
- 22 days/yr
Wind risk 6/10 · Moderate
- Chance of severe wind over 30 yrs
- 27.0%
Air-quality risk 2/10 · Minimal
- Unhealthy air days now
- 1 days/yr
- Unhealthy air days in 30 yrs
- 1 days/yr
Risk factors via First Street. Map © Google.
Why this score? — see what drove the D+ grade
The composite is a weighted blend of 9 inputs, each scored 0–100. Each bar is that input's sub-score; the figure is the points it added to the 100-point composite (weight × sub-score).
- ARV discount +15.0/15.0
- Cash flow +8.2/30.0
- Appreciation +7.5/10.0
- Schools +5.2/10.0
- 1% rule +3.5/10.0
- Livability +2.7/5.0
- Rent growth +2.5/5.0
- Condition / age +2.5/5.0
- DSCR +2.2/10.0
$145,000
🖨 Deal sheet 📄 Offer letter ✓ Due diligence
Listing remarks MLS
Nearly ¾ Acre + Shop + Updated Systems - Strong Value-Add Opportunity. C0ntact Jenna with any questions and or showing requests at nine oh three four three six three nine five eight - Any information used to advertise this listing is speculative in nature we make no guarantee or warranty regarding the information contained. Br0ker, agnt & seller expressly disclaim any warranty with respect to the accuracy of the submission items. Buyer & buyer’s agnt acknowledges they are relying on their own investigation & should perform a detailed independent analysis of the property to determine if it meets your satisfaction & accuracy of MLS data fields. Robinson Capital Real Estate, LLC will not be held liable for any MLS system errors and or discrepancies. Robinson Capital Real Estate, LLC 2025.
Key facts
- Updated systems
- 0.66 acre lot
- 2 garage spots
Tags
Neighborhood map
What this means for you Summary
Snapshot
- This is a 3-bed/2.0-bath single-family listed at $145k.
Deal economics
- At list price, monthly cash flow is $-138 ($-2k/yr) — negative.
- To cash-flow at today's rent, offer at most $121k (16.8% below list).
- To meet the 1% rule (rent ≥ 1% of price), the offer needs to be $123k (15.4% below list).
- Recommended offer: $121k (16.8% below list) — sets the bar for cash-flow.
Location & tenants
- Location reads 54/100 on livability (#1,415 in TX) — a working-class tenant base; expect higher turnover. Strengths: cost of living A+, housing A+, employment A-; Watch: crime F, amenities F, commute F.
- Dodd City ISD (rural): math 61% / reading 55% proficiency, ranked #160 of 1,141 in TX (top 14%) — acceptable for families but not a draw, mixed tenant base, ~2y average lease.
- Market conditions: 73 active listings in the ZIP; 82 units permitted in Fannin County in 2024 (0 in 5+ unit buildings).
Forward outlook
- In year one you build about $8k of equity ($1k loan paydown + $7k appreciation (5.0% local appreciation)).
- Fannin County population projected to shrink 6% by 2050 — rents likely to lag national; underwrite the cash flow, not the appreciation.
- By year 5, paydown + projected appreciation supports a ~$36k cash-out refi (75% LTV) — recoverable capital for the next deal without selling this one.
Negotiation context
- It's been on market 63 days — a 6% lower offer ($136k) is reasonable based on typical stale-listing flexibility.
- 3 sale attempts since 8y ago with the ask held roughly flat each time — persistent listings suggest the price (not the market) is what's stuck; bring a comps-based counter.
Risks & watch-outs
- Climate carrying-cost: major wind risk, 27% chance of damaging wind over 30y; severe wildfire risk; extreme-heat days projected 7→22/yr by 2055 (HVAC capex compounding) — expect insurance premiums to compound above CPI over the hold.
Questions for the listing agent
- What do current leases actually rent for vs. the listed asking? Can we see a recent rent roll and the last 12 months of T-12 income?
- It's been on market 63 days. Have you received any prior offers? Is the seller open to a 17% concession, seller financing, or rate buy-down credit?
- Why hasn't it sold? Are there any deal-killer items the seller is aware of (foundation, flood, title, zoning, code violations)?
- Is there a deadline driving the sale (1031 exchange, divorce, estate, relocation)? That informs how much negotiation room exists.
- Crime grade is F in this area — have there been break-ins, vandalism, or insurance claims at this property in the last 3 years? What carrier currently insures it and at what premium?
- The area grade is low — what's the realistic commute time and amenity access for the typical tenant pool here? Any planned neighborhood developments (good or bad) we should know about?
- What's the average days-on-market for RENTAL listings here right now (not sales)? A rising rental-DOM trend means longer vacancies and softer asking-rent achievability than the comps imply.
- What's the recent tenant-quality profile in this submarket — average credit score on applications, eviction rate, late-payment / NSF rate, and stable-employment percentage? A property-management company in the area should have these aggregated.
- How much new for-sale + rental construction is in the pipeline within 1–3 miles? Heavy new supply typically softens prices + rents 12–24 months out; constrained supply supports both.
Investment metrics
- 1% rule
- 0.85% ✗
- Cap rate
- 5.15%
- Cash-on-cash
- -4.08%
- DSCR
- 0.82
- GRM
- 9.8
CMA / ARV
- ARV (median comp)
- $252,388
- List price
- $145,000
- Delta
- -42.55%
- Verdict
- UNDERPRICED
- Comps
- 14 within 1.0 mi
Show comp detail 4 sales within ~0.75 mi
| Address | Dist | Beds/Ba | Sqft | Sold | Price | $/sf | Match |
|---|---|---|---|---|---|---|---|
| 203 E 4th St | 0.29mi | 3/2.0 | 1,544 (-8%) | 9mo | $259,500 | $168 | 65 |
| 503 N White Oak Rd | 0.24mi | 3/2.0 | 1,598 (-5%) | 24mo | $248,000 | $155 | 61 |
| 205 E 4th St | 0.30mi | 3/2.0 | 1,509 (-10%) | 20mo | $265,000 | $176 | 53 |
| 704 N Sulphur St | 0.32mi | 3/2.0 | 1,466 (-13%) | 20mo | $455,000 | $310 | 47 |
Match score weights: distance 35% · size 25% · config 20% · recency 20%. Top-matched comps best support the ARV.
Projected returns pro-forma
5.03% appreciation · 3.0% rent growth · sell at horizon
- IRR
- 9.6%
- Equity multiple
- 1.62×
- Total profit
- $25,003
- Equity at exit
- $82,472
- IRR
- 11.1%
- Equity multiple
- 3.05×
- Total profit
- $83,234
- Equity at exit
- $142,586
Cash invested: $40,600 (down + closing). Projections, not guarantees.
Landlord ↔ Tenant lean methodology
- Overall (STATE)
- 87 Strongly Landlord-Friendly
- State Texas
- 87 Strongly Landlord-Friendly · R+5
- County
- — inherits STATE
- City
- — inherits STATE
ZIP-level market 75438
- Home prices YoY
- 1.8%
- Active inventory
- 73
- Price-to-rent
- 9.8×
Monthly cashflow live
- Estimated rent
- $1,227 medium interval (Pro) →
- Mortgage (P&I)
- −$760
- Tax from tax record
- −$286 /mo · $3,435/yr
- Insurance
- −$60
- HOA
- −$0
- Vacancy / Maint / Mgmt
- −$258
- Net cashflow
- $-138
Break-even live
UW: 25.0% down · 7.5% · 30yr · 1.5% tax · 5.0% vac · 8.0% maint · 8.0% mgmt
Financing live
Cash to close
- Down payment
- $36,250
- Closing costs
- $4,350
- Reserves months
- —
- Total cash needed
- —
Loan-product check · same deal, 3 products live
Conventional
25% down · 7.5% · 30yr
- Down + closing
- —
- Monthly P&I
- —
- Monthly cashflow
- —
- DSCR
- —
- Eligible?
- —
Personal DTI + credit; lowest rate.
DSCR
20% down · 8.5% · 30yr
- Down + closing
- —
- Monthly P&I
- —
- Monthly cashflow
- —
- DSCR
- —
- Eligible?
- —
No personal income docs; deal must DSCR.
Hard money
10% down · 12.0% · 12mo
- Down + closing
- —
- Monthly P&I
- —
- Monthly cashflow
- —
- DSCR
- —
- Eligible?
- —
Short-term bridge; refi at stabilization.
Listing history 30 events
-
2026-06-19days on market $145,000 Active 63 DOM
-
2026-06-18days on market $145,000 Active 62 DOM
-
2026-06-17days on market $145,000 Active 61 DOM
-
2026-06-16days on market $145,000 Active 60 DOM
-
2026-06-15days on market $145,000 Active 59 DOM
-
2026-06-14days on market $145,000 Active 57 DOM
-
2026-06-12days on market $145,000 Active 56 DOM
-
2026-06-09days on market $145,000 Active 53 DOM
-
2026-06-08days on market $145,000 Active 52 DOM
-
2026-06-07days on market $145,000 Active 51 DOM
-
2026-06-05days on market $145,000 Active 49 DOM
-
2026-06-04days on market $145,000 Active 47 DOM
-
2026-06-02days on market $145,000 Active 46 DOM
-
2026-06-01days on market $145,000 Active 45 DOM
-
2026-05-31days on market $145,000 Active 44 DOM
-
2026-05-31days on market $145,000 Active 43 DOM
-
2026-04-17$145,000 Active 829-char remark
Show marketing remark (829 chars)
Nearly ¾ Acre + Shop + Updated Systems - Strong Value-Add Opportunity. C0ntact Jenna with any questions and or showing requests at nine oh three four three six three nine five eight - Any information used to advertise this listing is speculative in nature we make no guarantee or warranty regarding the information contained. Br0ker, agnt & seller expressly disclaim any warranty with respect to the accuracy of the submission items. Buyer & buyer’s agnt acknowledges they are relying on their own investigation & should perform a detailed independent analysis of the property to determine if it meets your satisfaction & accuracy of MLS data fields. Robinson Capital Real Estate, LLC will not be held liable for any MLS system errors and or discrepancies. Robinson Capital Real Estate, LLC 2025.
-
2026-03-19historical
-
2026-02-02price $209,000
-
2026-01-06$219,000 Active
-
2019-07-09soldstatus Sold
-
2019-07-09soldstatus
-
2019-06-04status Pending
-
2019-05-26historical Active Option Contract
-
2019-03-14price $155,000
-
2018-12-13price $158,000
-
2018-10-23price $169,900
-
2018-10-08$172,500 Active
-
2014-10-07soldstatus
-
1984-11-13soldstatus
ⓘ Source: listings_history table (triggers on properties + properties_extension) + one-shot
backfill from property_details.listing_events for pre-trigger history.
Tax reassessment forecast TX · Resets to sale price
- Current annual tax
- $3,435 · $286/mo
- Projected year-2 tax
- $3,435 · $286/mo
- Expected delta
- $0/yr ($0/mo · 0.0%)
ⓘ Screening estimate from a state-policy table — verify with the county assessor before closing.
Climate risk First Street
- Flood 1/10 Low FEMA zone X (unshaded) · 0% chance over 30 yrs
- Wildfire 8/10 Severe
- Heat 7/10 Severe 7 d/yr ≥110°F today · 22 d/yr by 30 yrs out
- Wind 6/10 Major 27% chance of damaging wind over 30 yrs
- Air quality 2/10 Low 1 unhealthy d/yr today · 1 by 30 yrs out
Nearby sold comps map
Loading sold comps map…
Walkable amenities ~0.75 mi
Loading nearby amenities…
Taxation est. · year 1
- Rental income
- $14,721
- − Mortgage interest
- −$8,122
- − Property taxes
- −$3,435
- − Insurance
- −$725
- − Repairs & maintenance
- −$1,178
- − Management
- −$1,178
- − Depreciation
- −$4,218
- Taxable loss
- −$4,135
- Est. tax savings @ 24.0%
- +$992
- After-tax cash flow
- $-663/yr
For passive investors: Depreciation is non-cash, so a rental often shows a tax loss while cash-flowing — sheltering income. Rental losses are passive: they offset passive income freely, and up to $25,000/yr can offset ordinary (W-2) income if you actively participate and your MAGI is under $100k (phasing out to $0 by $150k); unused losses carry forward. On sale, claimed depreciation is recaptured at up to 25%, and gains may owe capital-gains tax (a 1031 exchange can defer both). Figures are a year-1 estimate at your 24.0% rate — not tax advice; consult a CPA.
Schools (NCES district)
- District
- Dodd City ISD
- NCES district ID
- 4817280
- Math proficiency
- 61% ▲ 5.00%
- Reading proficiency
- 55% ▼ -3.00%
- Median HH income
- $54,015
- Composite
- 51.5/100
- National rank
- #3675
- State rank
- #160 of 1141 in TX
Livability — Dodd City
- Score
- 54/100
- State rank
- #1415
- US rank
- #24219
Category grades
Schools grade is shown separately in the Schools card above.
Census & demographics
- Census place
- Dodd City, TX
- Population (ZIP)
- 1,279
Population outlook (Fannin County) Hauer SSP2
- Today (2025)
- 33,423 people
- By 2030
- 33,035 · -1.2%
- By 2040
- 32,250 · -3.5%
- By 2050
- 31,462 · -5.9%
- By 2075
- 29,447 · -11.9%
- By 2100
- 25,459 · -23.8%
Race, ethnicity, and origin ACS 2023
- Neighborhood character
- Predominantly White (93%)
- Race & ethnicity
- White 93% Hispanic / Latino 3% Two or more races 2% Black 2%
- Common ancestry
- Italian 6% Serbian 3% Slovak 2%
- Foreign-born
- 2% · Canada
- Languages at home
- 96% English-only · Spanish 3%
Political lean MEDSL · Fannin
- 2024 margin
- Solid R (+67.4) · D 15.9% · R 83.3%
- 2008→2024 swing
- -27.8pp toward R · 2008: -39.6pp · 2024: -67.4pp
- All cycles
- 2024: R+67.4 2020: R+63.4 2016: R+61.9 2012: R+52.5 2008: R+39.6
Not yet ingested
- Civics
- —
Market trends
- HPI YoY
- ▲ 5.03%
- Current HPI
- 287.5793
- Rent YoY
- —
- Metro
- —
- State GDP YoY
- ▲ 3.95%
- F500 in state
- 110
Industry mix (Fortune 500 HQ in TX)
| Industry | F500 HQs | Revenue |
|---|---|---|
| Energy | 16 | $1,198B |
|
||
| Technology | 5 | $198B |
|
||
| Engineering / Construction | 4 | $72B |
|
||
| Energy Services | 3 | $60B |
|
||
| Utilities | 3 | $41B |
|
||
| Healthcare | 2 | $330B |
|
||
Price history
-15.9% since first listed14 events — show timeline
- 2026-04-17 Listed $145,000 NTREIS
- 2026-03-19 Listing Removed — NTREIS
- 2026-02-02 Price Changed $209,000 NTREIS
- 2026-01-06 Listed $219,000 NTREIS
- 2019-07-09 Sold (Public Records) — Public Records
- 2019-07-09 Sold (MLS) — NTREIS
- 2019-06-04 Pending — NTREIS
- 2019-05-26 Contingent — NTREIS
- 2019-03-14 Price Changed $155,000 NTREIS
- 2018-12-13 Price Changed $158,000 NTREIS
- 2018-10-23 Price Changed $169,900 NTREIS
- 2018-10-08 Listed $172,500 NTREIS
- 2014-10-07 Sold (Public Records) — Public Records
- 1984-11-13 Sold (Public Records) — Public Records
Property tax history
+4.8%/yrLatest (2025): $3,435 · -7.3% YoY. Source: county tax records.
Cash-flow waterfall
monthlySold comps — $/sqft
last 12 mo · ≤1 miLoading sold comps…