15-1358 17th Ave · Hawaiian Paradise Park, HI
Flood risk 1/10 · Minimal
- FEMA flood zone
- X (unshaded)
- Chance of flooding over 30 yrs
- 0.0%
- Est. flood insurance / yr
- $507 – $1,088
Fire risk No data
- Est. fire insurance / yr
- —
Heat risk No data
- Hot days now (above threshold)
- —
- Hot days in 30 yrs
- —
Wind risk No data
- Chance of severe wind over 30 yrs
- —
Air-quality risk 1/10 · Minimal
- Unhealthy air days now
- —
- Unhealthy air days in 30 yrs
- —
Risk factors via First Street. Map © Google.
Why this score? — see what drove the C+ grade
The composite is a weighted blend of 9 inputs, each scored 0–100. Each bar is that input's sub-score; the figure is the points it added to the 100-point composite (weight × sub-score).
- Cash flow +25.3/30.0
- DSCR +8.3/10.0
- ARV discount +7.5/15.0
- 1% rule +6.1/10.0
- Appreciation +5.5/10.0
- Schools +3.7/10.0
- Livability +3.1/5.0
- Rent growth +2.5/5.0
- Condition / age +2.5/5.0
$160,000
🖨 Deal sheet 📄 Offer letter ✓ Due diligence
Listing remarks
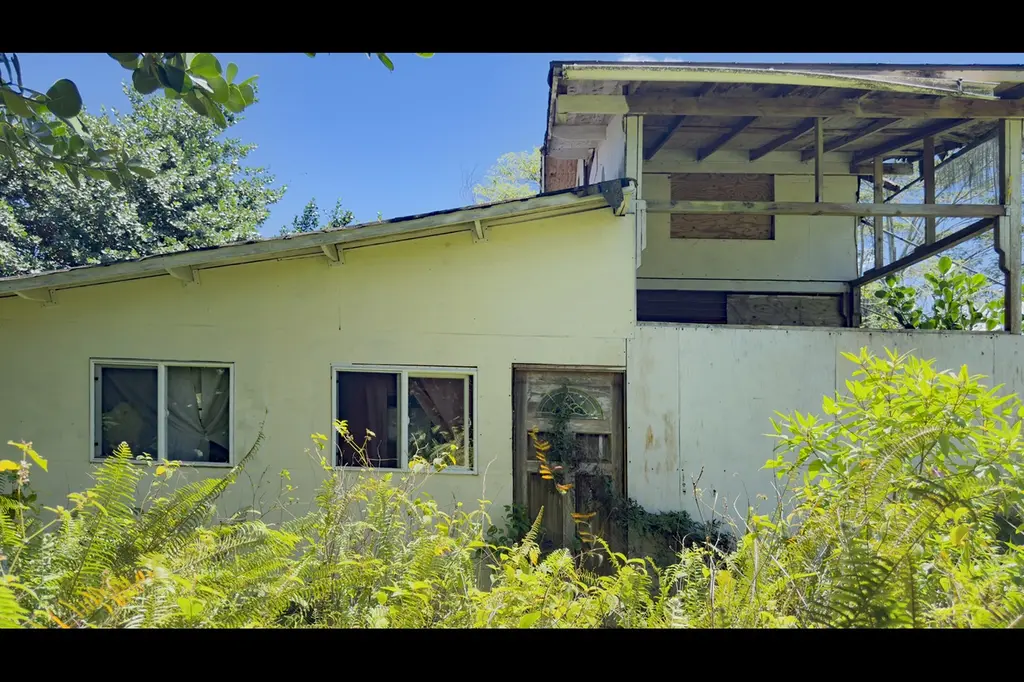
Located on 17th Ave in Hawaiian Paradise Park, this 1-acre property is priced at land value and offers a prime opportunity for redevelopment. The existing structure is in poor condition and will likely require demolition or complete rebuilding. This is not a candidate for traditional financing and is best suited for cash buyers, contractors, or investors seeking their next project. With generous acreage, privacy, and established vegetation, the property provides an opportunity for creating a new home or investment in a growing area. Utilities and improvements should be verified by buyers, but the value here is in the land and the potential it holds. Hawaiian Paradise Park is one of the most
Key facts
- 1 acre lot
- Built 2013
- Listed 51 days
Property features AI
Finance
- Other: Road maintenance annual amount $435
- Financial info: Not used as a short-term vacation rental
Exterior
- Utilities: Electricity available; Water not available; Fiber-optic internet; No solid waste disposal service listed
- Home design: Fee simple ownership; Zoned A-1A; Lava zone 3
- Exterior features: Fairly level, wooded lot; Private, unpaved road access
Interior
- Bathrooms: 1 full bathroom
- Interior features: Unpermitted improvements present
Neighborhood map
What this means for you Summary
Snapshot
- This is a 1-bed/1.0-bath other listed at $160k.
Deal economics
- At list price, monthly cash flow is $364 ($4k/yr) — positive.
- The deal already cash-flows at list — no discount required.
- Meets the 1% rule at list price ($2k rent vs $160k).
- Recommended offer: $155k (3.0% below list) — sets the bar for market timing.
- Cap rate 9.0% vs local median 2.8% in Hawaiian Paradise Park — top-decile yield for the area; either an underpriced asset or a hidden risk that comps aren't pricing in. Stress-test before assuming the spread holds.
Location & tenants
- Location reads 61/100 on livability (#81 in HI) — a middle-class / working-renter tenant base. Strengths: housing A+, employment A; Watch: health & safety C-, schools D-, amenities F.
- Hawaii Department Of Education (suburban): math 32% / reading 50% proficiency, ranked #1 of 1 in HI (top 100%) — families likely to look elsewhere, expect single-tenant / working-renter base with shorter leases.
- Market conditions: 189 active listings in the ZIP; 1 comparable units currently listed for rent nearby; solid renter incomes; 982 units permitted in Hawaii County in 2024 (0 in 5+ unit buildings).
Forward outlook
- In year one you build about $3k of equity ($1k loan paydown + $1k appreciation (0.9% local appreciation)).
- Hawaii County population projected at +24% by 2050 — long-run rental-demand tailwind backs the buy-and-hold thesis.
- At projected returns (0.9% appreciation + 3.0% rent growth), your $45k cash investment doubles in ~6 years — after that, you're playing with house money.
Negotiation context
- It's been on market 51 days — a 3% lower offer ($155k) is reasonable based on typical stale-listing flexibility.
- 2 sale attempts since 11y ago with the ask held roughly flat each time — persistent listings suggest the price (not the market) is what's stuck; bring a comps-based counter.
- Current owner paid $35k; list at $160k implies a 357% gain — meaningful room to come down on a strong offer.
Questions for the listing agent
- It's been on market 51 days. Have you received any prior offers? Is the seller open to a 3% concession, seller financing, or rate buy-down credit?
- Is there a deadline driving the sale (1031 exchange, divorce, estate, relocation)? That informs how much negotiation room exists.
- Schools are D-rated, which usually means shorter tenancies and higher turnover. Who's the typical renter profile here, and what's been the actual vacancy rate?
- What's the average days-on-market for RENTAL listings here right now (not sales)? A rising rental-DOM trend means longer vacancies and softer asking-rent achievability than the comps imply.
- What's the recent tenant-quality profile in this submarket — average credit score on applications, eviction rate, late-payment / NSF rate, and stable-employment percentage? A property-management company in the area should have these aggregated.
- How much new for-sale + rental construction is in the pipeline within 1–3 miles? Heavy new supply typically softens prices + rents 12–24 months out; constrained supply supports both.
Investment metrics
- 1% rule
- 1.11% ✓
- Cap rate
- 9.02%
- Cash-on-cash
- 9.74%
- DSCR
- 1.43
- GRM
- 7.5
CMA / ARV
- ARV (median comp)
- $365,000
- List price
- $160,000
- Delta
- -56.16%
- Verdict
- UNDERPRICED
- Comps
- 1 within 2.0 mi
Projected returns pro-forma
0.93% appreciation · 3.0% rent growth · sell at horizon
- IRR
- 11.3%
- Equity multiple
- 1.57×
- Total profit
- $25,612
- Equity at exit
- $54,056
- IRR
- 15.1%
- Equity multiple
- 2.82×
- Total profit
- $81,459
- Equity at exit
- $71,401
Cash invested: $44,800 (down + closing). Projections, not guarantees.
Landlord ↔ Tenant lean methodology
- Overall (STATE)
- 37 Tenant-Leaning
- State Hawaii
- 37 Tenant-Leaning · D+13
- County
- — inherits STATE
- City
- — inherits STATE
ZIP-level market 96749
- Home prices YoY
- 0.5%
- Active inventory
- 189
- Price-to-rent
- 7.5×
Monthly cashflow live
- Estimated rent
- $1,769 medium interval (Pro) →
- Mortgage (P&I)
- −$839
- Tax from tax record
- −$128 /mo · $1,532/yr
- Insurance
- −$67
- HOA
- −$0
- Vacancy / Maint / Mgmt
- −$371
- Net cashflow
- $364
Break-even live
UW: 25.0% down · 7.5% · 30yr · 1.5% tax · 5.0% vac · 8.0% maint · 8.0% mgmt
Financing live
Cash to close
- Down payment
- $40,000
- Closing costs
- $4,800
- Reserves months
- —
- Total cash needed
- —
Loan-product check · same deal, 3 products live
Conventional
25% down · 7.5% · 30yr
- Down + closing
- —
- Monthly P&I
- —
- Monthly cashflow
- —
- DSCR
- —
- Eligible?
- —
Personal DTI + credit; lowest rate.
DSCR
20% down · 8.5% · 30yr
- Down + closing
- —
- Monthly P&I
- —
- Monthly cashflow
- —
- DSCR
- —
- Eligible?
- —
No personal income docs; deal must DSCR.
Hard money
10% down · 12.0% · 12mo
- Down + closing
- —
- Monthly P&I
- —
- Monthly cashflow
- —
- DSCR
- —
- Eligible?
- —
Short-term bridge; refi at stabilization.
Rent comps 1 comps
| Address | Beds | Baths | Sqft | Rent | $/sqft | DOM | Units | Dist |
|---|---|---|---|---|---|---|---|---|
| 15-1510 14th Ave Unit B Keaau, HI | — | 1.0 | 480 | $1,600 | $3.33 | 44d | 1 | 0.82mi |
Listing history 19 events
-
2026-06-18days on market $160,000 Active 51 DOM
-
2026-06-17days on market $160,000 Active 50 DOM
-
2026-06-16days on market $160,000 Active 49 DOM
-
2026-06-15days on market $160,000 Active 48 DOM
-
2026-06-13days on market $160,000 Active 46 DOM
-
2026-06-13days on market $160,000 Active 45 DOM
-
2026-06-10days on market $160,000 Active 43 DOM
-
2026-06-09days on market $160,000 Active 42 DOM
-
2026-06-08days on market $160,000 Active 41 DOM
-
2026-06-07days on market $160,000 Active 40 DOM
-
2026-06-05days on market $160,000 Active 37 DOM
-
2026-06-03days on market $160,000 Active 36 DOM
-
2026-06-02days on market $160,000 Active 35 DOM
-
2026-06-01days on market $160,000 Active 34 DOM
-
2026-05-31days on market $160,000 Active 33 DOM
-
2026-04-28$160,000 Active 1823-char remark
-
2015-09-04historical
-
2015-06-29$45,000 Active
-
2008-06-27soldstatus $35,000
ⓘ Source: listings_history table (triggers on properties + properties_extension) + one-shot
backfill from property_details.listing_events for pre-trigger history.
Tax reassessment forecast HI · Partial reset (capped growth)
- Current annual tax
- $1,532 · $128/mo
- Projected year-2 tax
- $1,532 · $128/mo
- Expected delta
- $0/yr ($0/mo · 0.0%)
ⓘ Screening estimate from a state-policy table — verify with the county assessor before closing.
Climate risk First Street
- Flood 1/10 Low FEMA zone X (unshaded) · 0% chance over 30 yrs
- Air quality 1/10 Low
Nearby sold comps map
Loading sold comps map…
Walkable amenities ~0.75 mi
Loading nearby amenities…
Taxation est. · year 1
- Rental income
- $21,223
- − Mortgage interest
- −$8,962
- − Property taxes
- −$1,532
- − Insurance
- −$800
- − Repairs & maintenance
- −$1,698
- − Management
- −$1,698
- − Depreciation
- −$4,655
- Taxable income
- $1,878
- Est. tax owed @ 24.0%
- −$451
- After-tax cash flow
- $3,915/yr
For passive investors: Depreciation is non-cash, so a rental often shows a tax loss while cash-flowing — sheltering income. Rental losses are passive: they offset passive income freely, and up to $25,000/yr can offset ordinary (W-2) income if you actively participate and your MAGI is under $100k (phasing out to $0 by $150k); unused losses carry forward. On sale, claimed depreciation is recaptured at up to 25%, and gains may owe capital-gains tax (a 1031 exchange can defer both). Figures are a year-1 estimate at your 24.0% rate — not tax advice; consult a CPA.
Schools (NCES district)
- District
- Hawaii Department Of Education
- NCES district ID
- 1500030
- Math proficiency
- 32% ▼ -10.00%
- Reading proficiency
- 50% ▼ -3.00%
- Median HH income
- $69,005
- Composite
- 37.07/100
- National rank
- #4504
- State rank
- #1 of 1 in HI
Livability — Hawaiian Paradise Park
- Score
- 61/100
- State rank
- #81
- US rank
- #18406
Category grades
Schools grade is shown separately in the Schools card above.
Census & demographics
- Census place
- Hawaiian Paradise Park, HI
- County
- Hawaii County · 119,311 people
- Metro
- Hilo, HI
- Population (ZIP)
- 19,132
- Household income
- $85,399
- Rent vs Own
- Severe rent burden
- 290.0
Population outlook (Hawaii County) Hauer SSP2
- Today (2025)
- 220,733 people
- By 2030
- 232,156 · +5.2%
- By 2040
- 252,486 · +14.4%
- By 2050
- 272,703 · +23.5%
- By 2075
- 332,113 · +50.5%
- By 2100
- 398,342 · +80.5%
Race, ethnicity, and origin ACS 2023
- Neighborhood character
- Highly diverse neighborhood (Simpson 0.87)
- Race & ethnicity
- Two or more races 33% White 24% Asian 22% Pacific Islander 14% Hispanic / Latino 13% Black 1%
- Hispanic origin (detail)
- Mexican 7% Puerto Rican 3%
- Common ancestry
- Russian 9% Lithuanian 3% Italian 2%
- Foreign-born
- 14% · Vietnam, Canada
- Languages at home
- 73% English-only · Other Asian/Pacific 15% Vietnamese 2% Spanish 2%
Political lean MEDSL · Hawaii
- 2024 margin
- Strong D (+28.3) · D 63.0% · R 34.7% · Other 2.3%
- 2008→2024 swing
- -25.4pp toward R · 2008: 53.7pp · 2024: 28.3pp
- All cycles
- 2024: D+28.3 2020: D+36.2 2016: D+36.6 2012: D+51.3 2008: D+53.7
Not yet ingested
- Civics
- —
Market trends
- HPI YoY
- ▲ 0.93%
- Current HPI
- 183.9836
- Rent YoY
- —
- Metro
- Hilo, HI
- State GDP YoY
- —
- F500 in state
- 0
Price history
+357.1% since first listed4 events — show timeline
- 2026-04-28 Listed $160,000 HI Information Service
- 2015-09-04 Listing Removed — HI Information Service
- 2015-06-29 Listed $45,000 HI Information Service
- 2008-06-27 Sold (Public Records) $35,000 Public Records
Property tax history
+10.1%/yrLatest (2025): $1,532 · +11.8% YoY. Source: county tax records.
Cash-flow waterfall
monthlySold comps — $/sqft
last 12 mo · ≤1 miLoading sold comps…