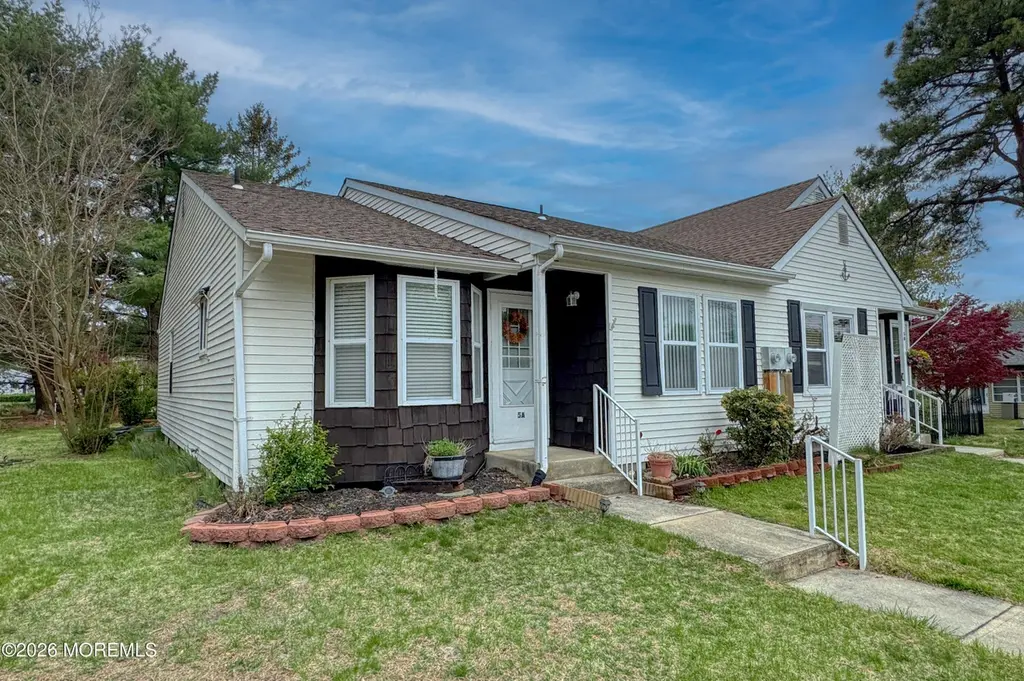
5 Berkeley St Unit A · Pine Ridge at Crestwood, NJ
Flood risk 1/10 · Minimal
- FEMA flood zone
- X (unshaded)
- Chance of flooding over 30 yrs
- 0.0%
- Est. flood insurance / yr
- $507 – $1,088
Fire risk 6/10 · Moderate
- Est. fire insurance / yr
- $526 – $976
Heat risk 7/10 · Major
- Hot days now (above 103°F)
- 7 days/yr
- Hot days in 30 yrs
- 15 days/yr
Wind risk 6/10 · Moderate
- Chance of severe wind over 30 yrs
- 65.0%
Air-quality risk 3/10 · Minor
- Unhealthy air days now
- 3 days/yr
- Unhealthy air days in 30 yrs
- 4 days/yr
Risk factors via First Street. Map © Google.
Why this score? — see what drove the D grade
The composite is a weighted blend of 9 inputs, each scored 0–100. Each bar is that input's sub-score; the figure is the points it added to the 100-point composite (weight × sub-score).
- Cash flow +11.0/30.0
- ARV discount +10.8/15.0
- 1% rule +4.2/10.0
- DSCR +3.2/10.0
- Livability +3.0/5.0
- Schools +2.9/10.0
- Rent growth +2.5/5.0
- Condition / age +2.5/5.0
- Appreciation +0.0/10.0
$189,900
🖨 Deal sheet (PDF) 📄 Offer letter ✓ Due diligence
Listing remarks MLS
This is just what you've been waiting for with larger eat-in kitchen, open living/dining room, to the attached screened porch, extra half bath, larger lot and fabulous privacy. Double doors to second bedroom or den/office. Garage offers plenty of private storage. There are many choices for living style in this spacious home. Seller will also rent with one year lease.
Key facts
- Edgemont model home
- Remodeled
- Eat-in kitchen
Tags
Property features AI
Finance
- HOA & community: HOA with clubhouse; Monthly association fee of $142; Association fee includes trash and snow removal; Association name: Crestwood Village 6
Exterior
- Parking: 1-car garage
- Utilities: Public sewer
- Home design: Model: Edgemont; Fee simple ownership
- Construction: Shingle roof; Crawl space basement
- Exterior features: Level topography
Interior
- Kitchen: Dishwasher; Stove; Refrigerator
- Bedrooms: 2 bedrooms
- Bathrooms: 1 full bathroom; 1 half bathroom
- Heating & cooling: Electric baseboard heating; Central air conditioning
- Interior features: Washer; Dryer; Blinds/Shades; Light fixtures; Garage door opener
- Laundry & utility: Washer and dryer included
Neighborhood map
What this means for you Summary
Snapshot
- This is a 2-bed/1.5-bath single-family listed at $190k.
Deal economics
- At list price, monthly cash flow is $-78 ($-938/yr) — negative.
- To cash-flow at today's rent, offer at most $179k (6.0% below list).
- To meet the 1% rule (rent ≥ 1% of price), the offer needs to be $174k (8.3% below list).
- Recommended offer: $174k (8.3% below list) — sets the bar for 1% rule.
Location & tenants
- Location reads 60/100 on livability (#481 in NJ) — a middle-class / working-renter tenant base. Strengths: crime A+, housing A+, cost of living B; Watch: employment D, amenities F, commute F.
- Manchester Township School District (suburban): math 25% / reading 44% proficiency, ranked #320 of 472 in NJ (top 68%) — families likely to look elsewhere, expect single-tenant / working-renter base with shorter leases.
- Zoned schools: Whiting Elementary School (math 22% / reading 47%, grade F, #582 of 1,303 statewide, top 49%, 301 students, 25% FRL); Manchester Township Middle School (math 28% / reading 45%, grade F, #226 of 431 statewide, top 55%, 582 students, 41% FRL); Manchester Township High School (math 21% / reading 38%, grade F, #290 of 399 statewide, top 74%, 959 students, 38% FRL).
- Market conditions: 658 active listings in the ZIP; 6 comparable units currently listed for rent nearby; rentals at typical pace (median 14d on market — plan ~3-4 weeks tenant-placement turnaround); 4,434 units permitted in Ocean County in 2024 (868 in 5+ unit buildings).
Forward outlook
- Local home prices are declining (-3.0%/yr); year-one equity from $1k of loan paydown is wiped out by about $6k of value loss. Plan a longer hold.
- Ocean County population projected to shrink 8% by 2050 — rents likely to lag national; underwrite the cash flow, not the appreciation.
Negotiation context
- It's been on market 18 days — a 2% lower offer ($187k) is reasonable based on typical stale-listing flexibility.
- 4 sale attempts since 18y ago with the ask held roughly flat each time — persistent listings suggest the price (not the market) is what's stuck; bring a comps-based counter.
- Current owner paid $72k; list at $190k implies a 164% gain — meaningful room to come down on a strong offer.
Risks & watch-outs
- Climate carrying-cost: major wind risk, 65% chance of damaging wind over 30y; major wildfire risk; extreme-heat days projected 7→15/yr by 2055 (HVAC capex compounding) — expect insurance premiums to compound above CPI over the hold.
Questions for the listing agent
- What do current leases actually rent for vs. the listed asking? Can we see a recent rent roll and the last 12 months of T-12 income?
- What does the HOA fee cover, when was the last increase, and are there any pending special assessments or reserve-fund shortfalls?
- Is there a deadline driving the sale (1031 exchange, divorce, estate, relocation)? That informs how much negotiation room exists.
- Schools are F-rated, which usually means shorter tenancies and higher turnover. Who's the typical renter profile here, and what's been the actual vacancy rate?
- The area grade is low — what's the realistic commute time and amenity access for the typical tenant pool here? Any planned neighborhood developments (good or bad) we should know about?
- What's the average days-on-market for RENTAL listings here right now (not sales)? A rising rental-DOM trend means longer vacancies and softer asking-rent achievability than the comps imply.
- What's the recent tenant-quality profile in this submarket — average credit score on applications, eviction rate, late-payment / NSF rate, and stable-employment percentage? A property-management company in the area should have these aggregated.
- How much new for-sale + rental construction is in the pipeline within 1–3 miles? Heavy new supply typically softens prices + rents 12–24 months out; constrained supply supports both.
Investment metrics
- 1% rule
- 0.92% ✗
- Cap rate
- 5.80%
- Cash-on-cash
- -1.76%
- DSCR
- 0.92
- GRM
- 9.1
CMA / ARV
- ARV (median comp)
- $204,899
- List price
- $189,900
- Delta
- -7.32%
- Verdict
- FAIR
- Comps
- 20 within 1.0 mi
Show comp detail 12 sales within ~0.75 mi
| Address | Dist | Beds/Ba | Sqft | Sold | Price | $/sf | Match |
|---|---|---|---|---|---|---|---|
| 15A Alpine Rd #63 | 0.27mi | 2/2.0 | 1,076 (-2%) | 1mo | $205,000 | $191 | 81 |
| 7 Amherst Rd Unit A | 0.28mi | 2/2.0 | 1,076 (-2%) | 1mo | $225,000 | $209 | 81 |
| 20 Amesbury Rd Unit B | 0.05mi | 2/1.0 | 965 (-12%) | 1mo | $168,000 | $174 | 75 |
| 3 Amherst Rd #63 | 0.28mi | 2/2.0 | 1,219 (+11%) | 5mo | $250,000 | $205 | 62 |
| 45 Beaver Ave | 0.58mi | 2/2.0 | 1,056 (-4%) | 5mo | $79,900 | $76 | 61 |
| 3 Badger Ct | 0.63mi | 2/2.0 | 1,152 (+5%) | 2mo | $85,000 | $74 | 59 |
| 40 Stonybrook Rd #62 | 0.57mi | 2/1.0 | 1,008 (-8%) | 3mo | $150,000 | $149 | 55 |
| 9 Greenwood Ln #62 | 0.54mi | 1/1.0 (-1) | 1,009 (-8%) | 1mo | $190,000 | $188 | 54 |
| 3 Arbor St | 0.60mi | 2/2.0 | 1,196 (+9%) | 3mo | $55,000 | $46 | 53 |
| 1 Greenwood Ln Unit B | 0.66mi | 2/1.0 | 1,009 (-8%) | 2mo | $252,000 | $250 | 52 |
| 65A Sunset Rd #60 | 0.74mi | 2/1.5 | 1,184 (+8%) | 1mo | $227,500 | $192 | 52 |
| 1104 Sycamore Ct | 0.73mi | 2/2.0 | 1,243 (+13%) | 2mo | $168,000 | $135 | 41 |
Match score weights: distance 35% · size 25% · config 20% · recency 20%. Top-matched comps best support the ARV.
Projected returns pro-forma
-3.0% appreciation · 3.0% rent growth · sell at horizon
- IRR
- -19.1%
- Equity multiple
- 0.33×
- Total profit
- $-35,637
- Equity at exit
- $28,315
- IRR
- -11.6%
- Equity multiple
- 0.30×
- Total profit
- $-36,983
- Equity at exit
- $16,419
Cash invested: $53,172 (down + closing). Projections, not guarantees.
Landlord ↔ Tenant lean methodology
- Overall (STATE)
- 21 Tenant-Leaning
- State New Jersey
- 21 Tenant-Leaning · D+6
- County
- — inherits STATE
- City
- — inherits STATE
ZIP-level market 08759
- Active inventory
- 658
- Price-to-rent
- 9.1×
Monthly cashflow live
- Estimated rent
- $1,742 high interval (Pro) →
- Mortgage (P&I)
- −$996
- Tax est. 1.5%
- −$237 /mo · $2,848/yr
- Insurance
- −$79
- HOA
- −$142
- Vacancy / Maint / Mgmt
- −$366
- Net cashflow
- $-78
Break-even live
Sensitivity live
| Price | -10% $53 | -5% $-13 | +0% $-78 | +5% $-144 | +10% $-209 |
|---|---|---|---|---|---|
| Rent | -10% $-216 | -5% $-147 | +0% $-78 | +5% $-9 | +10% $59 |
| Rate | -1.0pp $17 | -0.5pp $-30 | base $-78 | +0.5pp $-127 | +1.0pp $-177 |
UW: 25.0% down · 7.5% · 30yr · 1.5% tax · 5.0% vac · 8.0% maint · 8.0% mgmt
Financing live
Cash to close
- Down payment
- $47,475
- Closing costs
- $5,697
- Reserves months
- —
- Total cash needed
- —
Loan-product check · same deal, 3 products live
Conventional
25% down · 7.5% · 30yr
- Down + closing
- —
- Monthly P&I
- —
- Monthly cashflow
- —
- DSCR
- —
- Eligible?
- —
Personal DTI + credit; lowest rate.
DSCR
20% down · 8.5% · 30yr
- Down + closing
- —
- Monthly P&I
- —
- Monthly cashflow
- —
- DSCR
- —
- Eligible?
- —
No personal income docs; deal must DSCR.
Hard money
10% down · 12.0% · 12mo
- Down + closing
- —
- Monthly P&I
- —
- Monthly cashflow
- —
- DSCR
- —
- Eligible?
- —
Short-term bridge; refi at stabilization.
Rent comps 6 comps
| Address | Beds | Baths | Sqft | Rent | $/sqft | DOM | Units | Dist |
|---|---|---|---|---|---|---|---|---|
| 24 Partridge Pl Manchester Township, NJ | 3.0 | 2.0 | 1248 | $1,780 | $1.43 | 14d | 1 | 0.62mi |
| 4 Autumn Ct Manchester Township, NJ | 2.0 | 2.0 | 1056 | $1,600 | $1.52 | 0d | 1 | 0.63mi |
| — Manchester Township, NJ | 2.0 | 2.0 | 1141 | $1,700 | $1.49 | 12d | 1 | 0.67mi |
| 7 Teal Ct Whiting, NJ | 2.0 | 2.0 | 1056 | $1,600 | $1.52 | 5d | 1 | 0.72mi |
| 57D Milford Ave Unit 53 Whiting, NJ | 2.0 | 1.0 | 880 | $1,800 | $2.05 | 26d | 1 | 1.07mi |
| 19B Maplewood Dr #52 Whiting, NJ | 2.0 | 1.5 | 1109 | $2,250 | $2.03 | 18d | 1 | 1.36mi |
HOA detail
- Monthly dues
- $142 · $1,704/yr
Listing history 6 events
-
2026-05-14status Pending 584-char remark
-
2026-04-25$189,900 Active 584-char remark
-
2009-09-23soldstatus $72,000 369-char remark
Show marketing remark (369 chars)
This is just what you've been waiting for with larger eat-in kitchen, open living/dining room, to the attached screened porch, extra half bath, larger lot and fabulous privacy. Double doors to second bedroom or den/office. Garage offers plenty of private storage. There are many choices for living style in this spacious home. Seller will also rent with one year lease.
-
2009-06-09$88,500 369-char remark
Show marketing remark (369 chars)
This is just what you've been waiting for with larger eat-in kitchen, open living/dining room, to the attached screened porch, extra half bath, larger lot and fabulous privacy. Double doors to second bedroom or den/office. Garage offers plenty of private storage. There are many choices for living style in this spacious home. Seller will also rent with one year lease.
-
2008-12-06$88,850
-
2008-05-23$100,000
ⓘ Source: listings_history table (triggers on properties + properties_extension) + one-shot
backfill from property_details.listing_events for pre-trigger history.
Climate risk First Street
- Flood 1/10 Low FEMA zone X (unshaded) · 0% chance over 30 yrs
- Wildfire 6/10 Major
- Heat 7/10 Severe 7 d/yr ≥103°F today · 15 d/yr by 30 yrs out
- Wind 6/10 Major 65% chance of damaging wind over 30 yrs
- Air quality 3/10 Moderate 3 unhealthy d/yr today · 4 by 30 yrs out
Nearby sold comps map
Loading sold comps map…
Walkable amenities ~0.75 mi
Loading nearby amenities…
Taxation est. · year 1
- Rental income
- $20,904
- − Mortgage interest
- −$10,637
- − Property taxes
- −$2,848
- − Insurance
- −$950
- − Repairs & maintenance
- −$1,672
- − Management
- −$1,672
- − HOA
- −$1,704
- − Depreciation
- −$5,524
- Taxable loss
- −$4,104
- Est. tax savings @ 24.0%
- +$985
- After-tax cash flow
- $47/yr
For passive investors: Depreciation is non-cash, so a rental often shows a tax loss while cash-flowing — sheltering income. Rental losses are passive: they offset passive income freely, and up to $25,000/yr can offset ordinary (W-2) income if you actively participate and your MAGI is under $100k (phasing out to $0 by $150k); unused losses carry forward. On sale, claimed depreciation is recaptured at up to 25%, and gains may owe capital-gains tax (a 1031 exchange can defer both). Figures are a year-1 estimate at your 24.0% rate — not tax advice; consult a CPA.
Schools (NCES district)
- District
- Manchester Township School District
- NCES district ID
- 3409450
- Math proficiency
- 25% ▼ -17.00%
- Reading proficiency
- 44% ▼ -5.00%
- Median HH income
- $38,905
- Composite
- 28.8/100
- National rank
- #6662
- State rank
- #320 of 472 in NJ
Livability — Pine Ridge at Crestwood
- Score
- 60/100
- State rank
- #481
- US rank
- #18916
Category grades
Schools grade is shown separately in the Schools card above.
Census & demographics
- Census place
- Pine Ridge at Crestwood, NJ
- Population (ZIP)
- 34,290
Population outlook (Ocean County) Hauer SSP2
- Today (2025)
- 586,991 people
- By 2030
- 581,403 · -1.0%
- By 2040
- 564,913 · -3.8%
- By 2050
- 538,149 · -8.3%
- By 2075
- 468,845 · -20.1%
- By 2100
- 350,297 · -40.3%
Race, ethnicity, and origin ACS 2023
- Neighborhood character
- Predominantly White (87%)
- Race & ethnicity
- White 87% Hispanic / Latino 5% Black 4% Two or more races 4% Asian 2%
- Hispanic origin (detail)
- Puerto Rican 2%
- Common ancestry
- Romanian 8% Scotch-Irish 2% Lithuanian 2%
- Foreign-born
- 11% · Canada, China
- Languages at home
- 88% English-only · Spanish 3% Russian/Polish/Slavic 2% Other Indo-European 2%
Political lean MEDSL · Ocean
- 2024 margin
- Solid R (+36.0) · D 31.4% · R 67.4% · Other 1.2%
- 2008→2024 swing
- -17.6pp toward R · 2008: -18.4pp · 2024: -36.0pp
- All cycles
- 2024: R+36.0 2020: R+28.7 2016: R+34.0 2012: R+17.7 2008: R+18.4
Not yet ingested
- Civics
- —
Market trends
- HPI YoY
- ▼ -347.85%
- Current HPI
- 274.4679
- Rent YoY
- —
- Metro
- —
- State GDP YoY
- ▲ 2.05%
- F500 in state
- 34
Industry mix (Fortune 500 HQ in NJ)
| Industry | F500 HQs | Revenue |
|---|---|---|
| Consumer Goods | 3 | $31B |
|
||
| Pharmaceuticals | 2 | $153B |
|
||
| Technology | 2 | $21B |
|
||
| Insurance | 2 | $20B |
|
||
| Healthcare | 2 | $19B |
|
||
| Financial Services | 1 | $70B |
|
||
Price history
+89.9% since first listed6 events — show timeline
- 2026-05-14 Pending — MOMLS
- 2026-04-25 Listed $189,900 MOMLS
- 2009-09-23 Sold (MLS) $72,000 MOMLS
- 2009-06-09 Listed $88,500 MOMLS
- 2008-12-06 Listed $88,850 MOMLS
- 2008-05-23 Listed $100,000 MOMLS
Cash-flow waterfall
monthlySold comps — $/sqft
last 12 mo · ≤1 miLoading sold comps…