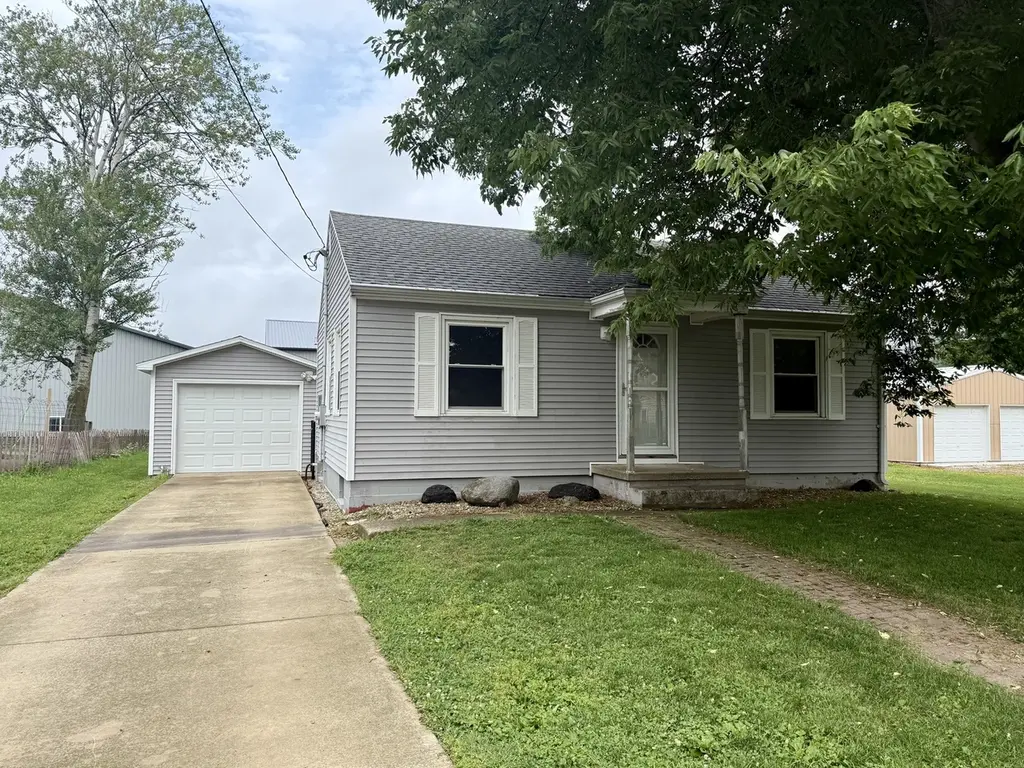
510 S King St · Newman, IL
Flood risk 1/10 · Minimal
- FEMA flood zone
- X (unshaded)
- Chance of flooding over 30 yrs
- 0.0%
- Est. flood insurance / yr
- $473 – $860
Fire risk 1/10 · Minimal
- Est. fire insurance / yr
- $804 – $1,492
Heat risk 3/10 · Minor
- Hot days now (above 105°F)
- 7 days/yr
- Hot days in 30 yrs
- 19 days/yr
Wind risk 2/10 · Minimal
- Chance of severe wind over 30 yrs
- 1.0%
Air-quality risk 2/10 · Minimal
- Unhealthy air days now
- 1 days/yr
- Unhealthy air days in 30 yrs
- 1 days/yr
Risk factors via First Street. Map © Google.
Why this score? — see what drove the C grade
The composite is a weighted blend of 9 inputs, each scored 0–100. Each bar is that input's sub-score; the figure is the points it added to the 100-point composite (weight × sub-score).
- Cash flow +22.4/30.0
- ARV discount +7.5/15.0
- DSCR +7.2/10.0
- 1% rule +5.4/10.0
- Livability +3.5/5.0
- Appreciation +3.3/10.0
- Rent growth +2.5/5.0
- Condition / age +2.5/5.0
- Schools +1.4/10.0
$79,000
🖨 Deal sheet (PDF) 📄 Offer letter ✓ Due diligence
Listing remarks
Comfortable spaces and a backyard ready to enjoy make this home one you won't want to miss. From the moment you arrive, you'll appreciate the spacious yard with plenty of room to relax, entertain, or enjoy everyday life outdoors. Inside, the bright and welcoming layout offers an open flow between the living room and kitchen, creating a space that feels connected and functional. The home features 2 bedrooms, 1 full bathroom, and a full unfinished basement with plenty of storage space and potential for future use. The roof, siding and windows are approximately 15 years old. Don't miss out on this great opportunity! Schedule your private showing today!
Key facts
- Spacious fenced yard
- Updates include roof
- 9,147 sq ft lot
Tags
Property features AI
Finance
- Other: Property listed as not rebuilt or rehabbed; Total finished/unfinished area noted (approx. 1,440 total); Living area reported from assessor (approx. 720)
- HOA & community: No master association fee required
Exterior
- Parking: Detached garage with garage door opener; Concrete driveway; 1 garage space (1 total parking space)
- Utilities: Public water; Septic tank sewer; 200+ amp electric service
- Home design: Detached single-family home; One-story; Fee simple ownership; Built approximately 71–80 years ago; Asphalt roof; Vinyl siding
- Construction: Vinyl siding construction; Asphalt roof; Unfinished basement (approx. 720 sq ft)
- Exterior features: Deck; Patio; Fenced yard; Lot approximately 61 x 150
Interior
- Kitchen: Kitchen
- Bedrooms: 2 bedrooms; Master bedroom on the main level (approx. 11 x 11); Second bedroom on the main level (approx. 8 x 11)
- Flooring: Laminate flooring
- Bathrooms: 1 full bathroom
- Heating & cooling: Natural gas heating; Central air conditioning
- Interior features: CO detectors; Sump pump; Unfinished full basement
- Laundry & utility: Laundry room
Neighborhood map
What this means for you Summary
Snapshot
- This is a 2-bed/1.0-bath single-family listed at $79k.
Deal economics
- At list price, monthly cash flow is $132 ($2k/yr) — positive.
- The deal already cash-flows at list — no discount required.
- Meets the 1% rule at list price ($825 rent vs $79k).
Location & tenants
- Location reads 69/100 on livability (#416 in IL) — a middle-class / working-renter tenant base. Strengths: crime A+, cost of living A+, housing A+; Watch: amenities F, commute F, health & safety F.
- Shiloh CUSD 1 (rural): math 9% / reading 13% proficiency, ranked #816 of 919 in IL (top 89%) — low school quality limits family demand, transient renter base, plan for 1-2y turnover.
- Zoned schools: Shiloh Elementary School (math 12% / reading 12%, grade F, #1,403 of 2,056 statewide, top 71%, 173 students, 0% FRL); Shiloh High School (math 2% / reading 12%, grade F, #599 of 693 statewide, top 87%, 198 students, 0% FRL) — zoned schools average 0% FRL vs 48% district-wide (48 pts lower); this property's tenant base skews higher-income than the district average.
- Market conditions: 5 active listings in the ZIP; 36 units permitted in Douglas County in 2024 (0 in 5+ unit buildings).
Forward outlook
- Local home prices are declining (-3.0%/yr); year-one equity from $546 of loan paydown is wiped out by about $2k of value loss. Plan a longer hold.
- Douglas County population projected to shrink 7% by 2050 — rents likely to lag national; underwrite the cash flow, not the appreciation.
Negotiation context
- Only 9 days on market — expect competitive offers; lowballing is unlikely to land.
- Current owner paid $65k; 22% above their basis — modest negotiation headroom, anchor on the comps not their cost.
Risks & watch-outs
- Watch-outs: built in 1949 — expect roof / HVAC / electrical / plumbing capex.
Questions for the listing agent
- Built in 1949 — when were the roof, HVAC, electrical panel, plumbing, and water heater last replaced?
- Is there a deadline driving the sale (1031 exchange, divorce, estate, relocation)? That informs how much negotiation room exists.
- Schools are F-rated, which usually means shorter tenancies and higher turnover. Who's the typical renter profile here, and what's been the actual vacancy rate?
- What's the average days-on-market for RENTAL listings here right now (not sales)? A rising rental-DOM trend means longer vacancies and softer asking-rent achievability than the comps imply.
- What's the recent tenant-quality profile in this submarket — average credit score on applications, eviction rate, late-payment / NSF rate, and stable-employment percentage? A property-management company in the area should have these aggregated.
- How much new for-sale + rental construction is in the pipeline within 1–3 miles? Heavy new supply typically softens prices + rents 12–24 months out; constrained supply supports both.
Investment metrics
- 1% rule
- 1.04% ✓
- Cap rate
- 8.29%
- Cash-on-cash
- 7.15%
- DSCR
- 1.32
- GRM
- 8.0
CMA / ARV
No comps found within radius.
Projected returns pro-forma
-3.0% appreciation · 3.0% rent growth · sell at horizon
- IRR
- -5.4%
- Equity multiple
- 0.80×
- Total profit
- $-4,412
- Equity at exit
- $11,779
- IRR
- 4.3%
- Equity multiple
- 1.31×
- Total profit
- $6,952
- Equity at exit
- $6,830
Cash invested: $22,120 (down + closing). Projections, not guarantees.
Landlord ↔ Tenant lean methodology
- Overall (STATE)
- 43 Moderately Tenant-Leaning
- State Illinois
- 43 Moderately Tenant-Leaning · D+7
- County
- — inherits STATE
- City
- — inherits STATE
ZIP-level market 61942
- Home prices YoY
- -1.6%
- Active inventory
- 5
- Price-to-rent
- 8.0×
Monthly cashflow live
- Estimated rent
- $825 medium interval (Pro) →
- Mortgage (P&I)
- −$414
- Tax from tax record
- −$73 /mo · $876/yr
- Insurance
- −$33
- HOA
- −$0
- Vacancy / Maint / Mgmt
- −$173
- Net cashflow
- $132
Break-even live
Sensitivity live
| Price | -10% $176 | -5% $154 | +0% $132 | +5% $109 | +10% $87 |
|---|---|---|---|---|---|
| Rent | -10% $67 | -5% $99 | +0% $132 | +5% $164 | +10% $197 |
| Rate | -1.0pp $172 | -0.5pp $152 | base $132 | +0.5pp $111 | +1.0pp $90 |
UW: 25.0% down · 7.5% · 30yr · 1.5% tax · 5.0% vac · 8.0% maint · 8.0% mgmt
Financing live
Cash to close
- Down payment
- $19,750
- Closing costs
- $2,370
- Reserves months
- —
- Total cash needed
- —
Loan-product check · same deal, 3 products live
Conventional
25% down · 7.5% · 30yr
- Down + closing
- —
- Monthly P&I
- —
- Monthly cashflow
- —
- DSCR
- —
- Eligible?
- —
Personal DTI + credit; lowest rate.
DSCR
20% down · 8.5% · 30yr
- Down + closing
- —
- Monthly P&I
- —
- Monthly cashflow
- —
- DSCR
- —
- Eligible?
- —
No personal income docs; deal must DSCR.
Hard money
10% down · 12.0% · 12mo
- Down + closing
- —
- Monthly P&I
- —
- Monthly cashflow
- —
- DSCR
- —
- Eligible?
- —
Short-term bridge; refi at stabilization.
Listing history 8 events
-
2026-06-17status $79,000 Pending 9 DOM
-
2026-06-17days on market $79,000 Active 9 DOM
-
2026-06-16days on market $79,000 Active 8 DOM
-
2026-06-15days on market $79,000 Active 7 DOM
-
2026-06-13days on market $79,000 Active 5 DOM
-
2026-06-12days on market $79,000 Active 4 DOM
-
2026-06-09remarks 657-char remark
-
2026-06-09$79,000 Active 1 DOM
ⓘ Source: listings_history table (triggers on properties + properties_extension) + one-shot
backfill from property_details.listing_events for pre-trigger history.
Tax reassessment forecast IL · Partial reset (capped growth)
- Current annual tax
- $876 · $73/mo
- Projected year-2 tax
- $1,335 · $111/mo
- Expected delta
- +$459/yr (+$38/mo · 52.4%)
ⓘ Screening estimate from a state-policy table — verify with the county assessor before closing.
Climate risk First Street
- Flood 1/10 Low FEMA zone X (unshaded) · 0% chance over 30 yrs
- Wildfire 1/10 Low
- Heat 3/10 Moderate 7 d/yr ≥105°F today · 19 d/yr by 30 yrs out
- Wind 2/10 Low 100% chance of damaging wind over 30 yrs
- Air quality 2/10 Low 1 unhealthy d/yr today · 1 by 30 yrs out
Nearby sold comps map
Loading sold comps map…
Walkable amenities ~0.75 mi
Loading nearby amenities…
Taxation est. · year 1
- Rental income
- $9,903
- − Mortgage interest
- −$4,425
- − Property taxes
- −$876
- − Insurance
- −$395
- − Repairs & maintenance
- −$792
- − Management
- −$792
- − Depreciation
- −$2,298
- Taxable income
- $324
- Est. tax owed @ 24.0%
- −$78
- After-tax cash flow
- $1,503/yr
For passive investors: Depreciation is non-cash, so a rental often shows a tax loss while cash-flowing — sheltering income. Rental losses are passive: they offset passive income freely, and up to $25,000/yr can offset ordinary (W-2) income if you actively participate and your MAGI is under $100k (phasing out to $0 by $150k); unused losses carry forward. On sale, claimed depreciation is recaptured at up to 25%, and gains may owe capital-gains tax (a 1031 exchange can defer both). Figures are a year-1 estimate at your 24.0% rate — not tax advice; consult a CPA.
Schools (NCES district)
- District
- Shiloh CUSD 1
- NCES district ID
- 1700122
- Math proficiency
- 9% ▼ -1.00%
- Reading proficiency
- 13% ▼ -7.00%
- Median HH income
- $45,781
- Composite
- 13.65/100
- National rank
- #14481
- State rank
- #816 of 919 in IL
Livability — Newman
- Score
- 69/100
- State rank
- #416
- US rank
- #8558
Category grades
Schools grade is shown separately in the Schools card above.
Census & demographics
- Census place
- Newman, IL
- Population (ZIP)
- 1,031
Population outlook (Douglas County) Hauer SSP2
- Today (2025)
- 19,209 people
- By 2030
- 18,940 · -1.4%
- By 2040
- 18,397 · -4.2%
- By 2050
- 17,829 · -7.2%
- By 2075
- 16,395 · -14.6%
- By 2100
- 14,329 · -25.4%
Race, ethnicity, and origin ACS 2023
- Neighborhood character
- Predominantly White (96%)
- Race & ethnicity
- White 96% Black 2% Hispanic / Latino 2%
- Common ancestry
- Lithuanian 3% Slovak 2% Romanian 2%
- Foreign-born
- 2%
- Languages at home
- 98% English-only · German/W. Germanic 1% Spanish 1%
Political lean MEDSL · Douglas
- 2024 margin
- Solid R (+46.1) · D 26.1% · R 72.3% · Other 1.6%
- 2008→2024 swing
- -24.9pp toward R · 2008: -21.3pp · 2024: -46.1pp
- All cycles
- 2024: R+46.1 2020: R+44.4 2016: R+46.3 2012: R+36.8 2008: R+21.3
Not yet ingested
- Civics
- —
Market trends
- HPI YoY
- ▼ -3.36%
- Current HPI
- 212.8473
- Rent YoY
- —
- Metro
- —
- State GDP YoY
- ▲ 1.59%
- F500 in state
- 60
Industry mix (Fortune 500 HQ in IL)
| Industry | F500 HQs | Revenue |
|---|---|---|
| Insurance | 4 | $201B |
|
||
| Consumer Goods | 4 | $87B |
|
||
| Industrial Machinery | 3 | $64B |
|
||
| Healthcare | 2 | $55B |
|
||
| Retail / Pharmacy | 1 | $148B |
|
||
| Agriculture / Food | 1 | $86B |
|
||
Price history
+122.5% since first listed4 events — show timeline
- 2026-06-08 Listed $79,000 MRED as Distributed by MLS Grid
- 2020-11-12 Sold (Public Records) $65,000 Public Records
- 2020-11-05 Sold (Public Records) $65,000 Public Records
- 2013-01-15 Sold (Public Records) $35,500 Public Records
Property tax history
+4.0%/yrLatest (2024): $876 · +6.7% YoY. Source: county tax records.
Cash-flow waterfall
monthlySold comps — $/sqft
last 12 mo · ≤1 miLoading sold comps…