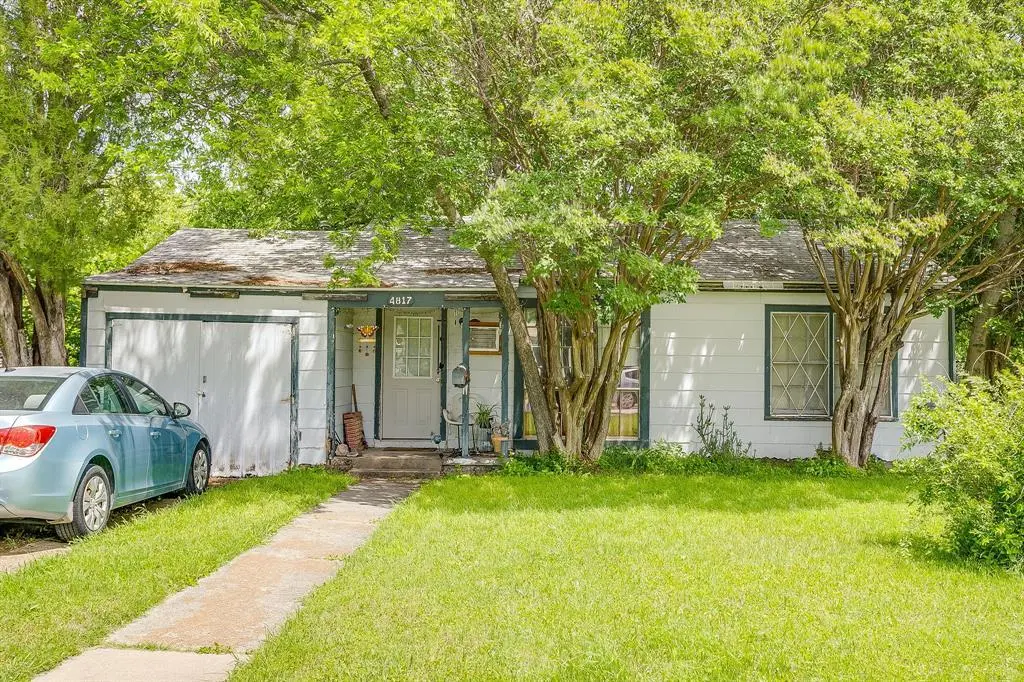
4817 Marks Pl · Fort Worth, TX
Flood risk 1/10 · Minimal
- FEMA flood zone
- X (unshaded)
- Chance of flooding over 30 yrs
- 0.0%
- Est. flood insurance / yr
- $507 – $1,088
Fire risk 1/10 · Minimal
- Est. fire insurance / yr
- $1,222 – $2,270
Heat risk 7/10 · Major
- Hot days now (above 108°F)
- 7 days/yr
- Hot days in 30 yrs
- 22 days/yr
Wind risk 4/10 · Minor
- Chance of severe wind over 30 yrs
- 24.0%
Air-quality risk 3/10 · Minor
- Unhealthy air days now
- 2 days/yr
- Unhealthy air days in 30 yrs
- 3 days/yr
Risk factors via First Street. Map © Google.
Why this score? — see what drove the C+ grade
The composite is a weighted blend of 9 inputs, each scored 0–100. Each bar is that input's sub-score; the figure is the points it added to the 100-point composite (weight × sub-score).
- Cash flow +24.1/30.0
- ARV discount +15.0/15.0
- DSCR +7.8/10.0
- 1% rule +6.2/10.0
- Livability +4.0/5.0
- Rent growth +2.9/5.0
- Condition / age +2.5/5.0
- Schools +2.0/10.0
- Appreciation +0.0/10.0
$135,000
🖨 Deal sheet 📄 Offer letter ✓ Due diligence
Listing remarks
Beautiful large lot with shaded backyard in fantastic location. Home is in need of repairs and or full renovation - great for investor, flipper, owner occupants. Property is being sold by Court Appointed Independent Administrator, call Listing Agent for name on contract. Neither Independent Administrator nor listing agent has walked interior of the home, neither have any knowledge regarding condition of home, or home systems. Buyer may walk interior of home once under contract during inspections.
Key facts
- 8,398 sq ft lot
- Garage
- Built 1955
Property features AI
Finance
- Other: Deed restrictions; Will not subdivide
- Financial info: Listing terms: Cash; Treat as clear loan type; No second mortgage
- HOA & community: No association
Exterior
- Parking: Attached garage with one garage space; Covered parking (1 covered space); Garage faces front with a 2-car single door
- Security: Security features unknown
- Utilities: City water; City sewer; Electricity connected; Individual water meter; Not in a municipal utility district
- Home design: Single family residence; Residential property; One story; Preowned (built 1955)
- Construction: Siding exterior; Composition roof; Pillar/post/pier foundation; Year built 1955
- Exterior features: Chain link fence; Large backyard with grass; Utilities easement
Interior
- Kitchen: No appliances included
- Bedrooms: 2 bedrooms (primary bedroom on main level)
- Bathrooms: 1 full bathroom
- Heating & cooling: Natural gas heating; Wall/window cooling units
- Interior features: One-level floorplan; One living area; One dining area; Other interior features
- Laundry & utility: Electric dryer hookup
Neighborhood map
What this means for you Summary
Snapshot
- This is a 3-bed/1.0-bath single-family listed at $135k.
Deal economics
- At list price, monthly cash flow is $268 ($3k/yr) — positive.
- The deal already cash-flows at list — no discount required.
- Meets the 1% rule at list price ($2k rent vs $135k).
- Recommended offer: $133k (1.5% below list) — sets the bar for market timing.
- Cap rate 8.7% vs local median 3.9% in Fort Worth — top-decile yield for the area; either an underpriced asset or a hidden risk that comps aren't pricing in. Stress-test before assuming the spread holds.
Location & tenants
- Location reads 80/100 on livability (#49 in TX, #1,954 nationally) — a professional / high-income tenant draw. Strengths: amenities A+, cost of living A+, housing A+; Watch: schools D+, crime F.
- Fort Worth ISD (urban): math 18% / reading 28% proficiency, ranked #742 of 826 in TX (top 90%) — low school quality limits family demand, transient renter base, plan for 1-2y turnover; 73% free/reduced lunch — lower-income household profile, screen leases tightly.
- Market conditions: Rents rising (+1.8%/yr); 209 active listings in the ZIP; 34 comparable units currently listed for rent nearby; rentals leasing fast (median 13d on market — plan ~1-2 weeks tenant-placement turnaround); 18,938 units permitted in Tarrant County in 2024 (8,336 in 5+ unit buildings).
- This rent runs 32% of the median local income ($56k/yr) — at the standard rent-burdened threshold; future hikes will face affordability resistance.
Forward outlook
- Local home prices are declining (-3.0%/yr); year-one equity from $933 of loan paydown is wiped out by about $4k of value loss. Plan a longer hold.
- Tarrant County population projected at +41% by 2050 — long-run rental-demand tailwind backs the buy-and-hold thesis.
Negotiation context
- It's been on market 20 days — a 2% lower offer ($133k) is reasonable based on typical stale-listing flexibility.
Risks & watch-outs
- Watch-outs: built in 1955 — expect roof / HVAC / electrical / plumbing capex.
- Climate carrying-cost: extreme-heat days projected 7→22/yr by 2055 (HVAC capex compounding) — expect insurance premiums to compound above CPI over the hold.
Questions for the listing agent
- Built in 1955 — when were the roof, HVAC, electrical panel, plumbing, and water heater last replaced?
- Is there a deadline driving the sale (1031 exchange, divorce, estate, relocation)? That informs how much negotiation room exists.
- Schools are D-rated, which usually means shorter tenancies and higher turnover. Who's the typical renter profile here, and what's been the actual vacancy rate?
- Crime grade is F in this area — have there been break-ins, vandalism, or insurance claims at this property in the last 3 years? What carrier currently insures it and at what premium?
- What's the average days-on-market for RENTAL listings here right now (not sales)? A rising rental-DOM trend means longer vacancies and softer asking-rent achievability than the comps imply.
- What's the recent tenant-quality profile in this submarket — average credit score on applications, eviction rate, late-payment / NSF rate, and stable-employment percentage? A property-management company in the area should have these aggregated.
- How much new for-sale + rental construction is in the pipeline within 1–3 miles? Heavy new supply typically softens prices + rents 12–24 months out; constrained supply supports both.
Investment metrics
- 1% rule
- 1.12% ✓
- Cap rate
- 8.67%
- Cash-on-cash
- 8.51%
- DSCR
- 1.38
- GRM
- 7.4
CMA / ARV
- ARV (median comp)
- $176,823
- List price
- $135,000
- Delta
- -23.65%
- Verdict
- UNDERPRICED
- Comps
- 20 within 1.0 mi
Show comp detail 12 sales within ~0.75 mi
| Address | Dist | Beds/Ba | Sqft | Sold | Price | $/sf | Match |
|---|---|---|---|---|---|---|---|
| 4817 Marks Pl | 0.00mi | 2/1.0 (-1) | 761 (0%) | 0mo | $135,000 | $177 | 95 |
| 4816 Marks Pl | 0.03mi | 2/1.0 (-1) | 725 (-5%) | 6mo | $185,000 | $255 | 81 |
| 7429 Culver Ave | 0.28mi | 2/1.0 (-1) | 754 (-1%) | 1mo | $185,000 | $245 | 80 |
| 4941 Gilbert Dr | 0.29mi | 2/1.0 (-1) | 754 (-1%) | 0mo | $144,900 | $192 | 80 |
| 7433 Mohawk Ave | 0.28mi | 2/1.0 (-1) | 761 (0%) | 9mo | $165,900 | $218 | 75 |
| 4501 Marks Pl | 0.23mi | 2/1.0 (-1) | 747 (-2%) | 9mo | $189,900 | $254 | 73 |
| 4945 Gilbert Dr | 0.29mi | 2/1.0 (-1) | 822 (+8%) | 3mo | $200,000 | $243 | 66 |
| 4709 Mayfair St | 0.49mi | 3/2.0 | 744 (-2%) | 8mo | $185,000 | $249 | 63 |
| 4208 Fairfax St | 0.50mi | 2/1.0 (-1) | 720 (-5%) | 2mo | $187,000 | $260 | 61 |
| 5117 Pamela Dr | 0.60mi | 2/1.0 (-1) | 760 (-0%) | 7mo | $189,000 | $249 | 61 |
| 4932 Royal Dr | 0.43mi | 2/1.0 (-1) | 720 (-5%) | 8mo | $149,900 | $208 | 59 |
| 5061 Royal Dr | 0.59mi | 2/1.0 (-1) | 820 (+8%) | 9mo | $185,000 | $226 | 47 |
Match score weights: distance 35% · size 25% · config 20% · recency 20%. Top-matched comps best support the ARV.
Projected returns pro-forma
-3.0% appreciation · 1.77% rent growth · sell at horizon
- IRR
- -4.8%
- Equity multiple
- 0.82×
- Total profit
- $-6,644
- Equity at exit
- $20,129
- IRR
- 3.4%
- Equity multiple
- 1.23×
- Total profit
- $8,857
- Equity at exit
- $11,672
Cash invested: $37,800 (down + closing). Projections, not guarantees.
Landlord ↔ Tenant lean methodology
- Overall (STATE)
- 87 Strongly Landlord-Friendly
- State Texas
- 87 Strongly Landlord-Friendly · R+5
- County
- — inherits STATE
- City
- — inherits STATE
ZIP-level market 76116
- Rents YoY
- 1.8%
- Active inventory
- 209
- Price-to-rent
- 7.4×
Monthly cashflow live
- Estimated rent
- $1,514 high interval (Pro) →
- Mortgage (P&I)
- −$708
- Tax from tax record
- −$164 /mo · $1,968/yr
- Insurance
- −$56
- HOA
- −$0
- Vacancy / Maint / Mgmt
- −$318
- Net cashflow
- $268
Break-even live
UW: 25.0% down · 7.5% · 30yr · 1.5% tax · 5.0% vac · 8.0% maint · 8.0% mgmt
Financing live
Cash to close
- Down payment
- $33,750
- Closing costs
- $4,050
- Reserves months
- —
- Total cash needed
- —
Loan-product check · same deal, 3 products live
Conventional
25% down · 7.5% · 30yr
- Down + closing
- —
- Monthly P&I
- —
- Monthly cashflow
- —
- DSCR
- —
- Eligible?
- —
Personal DTI + credit; lowest rate.
DSCR
20% down · 8.5% · 30yr
- Down + closing
- —
- Monthly P&I
- —
- Monthly cashflow
- —
- DSCR
- —
- Eligible?
- —
No personal income docs; deal must DSCR.
Hard money
10% down · 12.0% · 12mo
- Down + closing
- —
- Monthly P&I
- —
- Monthly cashflow
- —
- DSCR
- —
- Eligible?
- —
Short-term bridge; refi at stabilization.
Rent comps 34 comps
| Address | Beds | Baths | Sqft | Rent | $/sqft | DOM | Units | Dist |
|---|---|---|---|---|---|---|---|---|
| 4714 Old Benbrook Rd Fort Worth, TX | 2.0 | 1.0 | 810 | $1,375 | $1.70 | 24d | 1 | 0.39mi |
| 5036 Gilbert Dr Fort Worth, TX | 3.0 | 1.0 | 1074 | $2,000 | $1.86 | 44d | 1 | 0.41mi |
| 4300 Old Benbrook Rd Fort Worth, TX | 1.0–2.0 | 1.0–2.0 | 743 | $1,300 | $1.75 | 3d | 12 | 0.48mi |
| 4709 Mayfair St Fort Worth, TX | 4.0 | 2.0 | 744 | $1,895 | $2.55 | 2d | 1 | 0.49mi |
| 4100 Marks Pl Fort Worth, TX | 3.0 | 1.0 | 1018 | $1,695 | $1.67 | 22d | 1 | 0.54mi |
| 4639 Williams Rd Unit 113 Benbrook, TX | 2.0 | 2.0 | 925 | $1,195 | $1.29 | 15d | 1 | 0.70mi |
| 4639 Williams Rd Benbrook, TX | 2.0 | 2.0 | 925 | $1,195 | $1.29 | 13d | 1 | 0.70mi |
| 3450 River Park Dr Fort Worth, TX | 1.0–3.0 | 1.0–2.0 | 1050 | $2,090 | $1.99 | 2d | 17 | 0.89mi |
| 7500 Chapin Rd Apt C Fort Worth, TX | 2.0 | 1.5 | 1000 | $1,200 | $1.20 | 24d | 1 | 0.91mi |
| 7500 Chapin Rd Unit b 103 Fort Worth, TX | 2.0 | 1.5 | 1000 | $1,200 | $1.20 | 44d | 1 | 0.91mi |
| 7504 Chapin Rd Unit B Fort Worth, TX | 2.0 | 1.5 | 1075 | $1,300 | $1.21 | 44d | 1 | 0.92mi |
| 3721 Marks Pl Fort Worth, TX | 2.0 | 1.0 | 1050 | $1,350 | $1.29 | 24d | 1 | 0.93mi |
| 3736 Ramona Dr #200 Fort Worth, TX | 2.0 | 1.5 | 1015 | $1,125 | $1.11 | 44d | 1 | 0.94mi |
| 3741 Bonnie Dr Apt A Fort Worth, TX | 2.0 | 1.5 | 1015 | $1,175 | $1.16 | 3d | 1 | 0.95mi |
| 7604 Chapin Rd Unit C Fort Worth, TX | 2.0 | 1.5 | 1095 | $1,395 | $1.27 | 3d | 1 | 0.95mi |
| 7604 Chapin Rd Unit C Fort Worth, TX | 2.0 | 1.5 | 1095 | $1,395 | $1.27 | 44d | 1 | 0.95mi |
| 3451 River Park Dr Unit 3488 Fort Worth, TX | 2.0 | 2.0 | 1088 | $1,832 | $1.68 | 44d | 1 | 1.01mi |
| 3451 River Park Dr Apt 2121 Fort Worth, TX | 2.0 | 2.0 | 1024 | $1,722 | $1.68 | 3d | 1 | 1.01mi |
| 3813 Coates Cir Fort Worth, TX | 2.0 | 1.5 | 1065 | $1,350 | $1.27 | 19d | 1 | 1.03mi |
| 5836 Highland Park Dr Unit 2121 Fort Worth, TX | 2.0 | 2.0 | 1046 | $1,332 | $1.27 | 3d | 1 | 1.09mi |
| 5836 Highland Park Dr Unit 5893 Fort Worth, TX | 2.0 | 2.0 | 1046 | $1,365 | $1.30 | 44d | 1 | 1.09mi |
| 3309 Riveroad Ct Fort Worth, TX | 1.0–2.0 | 1.0–2.0 | 817 | $1,504 | $1.84 | 5d | 30 | 1.10mi |
| 3301 River Park Dr Unit 3358 Fort Worth, TX | 2.0 | 2.0 | 965 | $1,314 | $1.36 | 3d | 1 | 1.16mi |
| 3301 River Park Dr Unit 3338 Fort Worth, TX | 2.0 | 2.0 | 1018 | $1,378 | $1.35 | 13d | 1 | 1.16mi |
| 3101 River Park Dr Fort Worth, TX | 1.0–3.0 | 1.0–2.0 | 1110 | $1,905 | $1.72 | 2d | 32 | 1.22mi |
| 5707 Bellaire Dr S Unit 2121 Benbrook, TX | 2.0 | 2.0 | 863 | $1,126 | $1.30 | 3d | 1 | 1.29mi |
| 5707 Bellaire Dr S Unit 5764 Benbrook, TX | 2.0 | 2.0 | 863 | $1,169 | $1.35 | 5d | 1 | 1.29mi |
| 5759 Cedar Creek Dr Benbrook, TX | 2.0 | 2.0 | 980 | $1,825 | $1.86 | 24d | 1 | 1.29mi |
| 5644 Riverwalk Dr Unit 2121 Benbrook, TX | 2.0 | 2.0 | 931 | $1,106 | $1.19 | 3d | 1 | 1.36mi |
| 5644 Riverwalk Dr Unit 3121 Benbrook, TX | 3.0 | 2.0 | 1110 | $1,233 | $1.11 | 3d | 1 | 1.36mi |
| 5644 Riverwalk Dr Unit 610 Benbrook, TX | 3.0 | 2.0 | 1110 | $1,265 | $1.14 | 11d | 1 | 1.36mi |
| 5644 Riverwalk Dr Unit 5701 Benbrook, TX | 2.0 | 2.0 | 931 | $1,139 | $1.22 | 44d | 1 | 1.36mi |
| 3964 Watercourse Dr Fort Worth, TX | 3.0 | 1.0–2.0 | 1028 | $2,802 | $2.72 | 1d | 31 | 1.40mi |
| 2751 River Park Dr Fort Worth, TX | 1.0–3.0 | 1.0–2.0 | 1024 | $2,340 | $2.28 | 1d | 43 | 1.42mi |
Listing history 3 events
-
2026-05-13historical Active Option Contract 502-char remark
-
2026-05-06$135,000 Active 502-char remark
-
1985-06-18soldstatus
ⓘ Source: listings_history table (triggers on properties + properties_extension) + one-shot
backfill from property_details.listing_events for pre-trigger history.
Tax reassessment forecast TX · Resets to sale price
- Current annual tax
- $1,968 · $164/mo
- Projected year-2 tax
- $2,470 · $206/mo
- Expected delta
- +$503/yr (+$42/mo · 25.5%)
ⓘ Screening estimate from a state-policy table — verify with the county assessor before closing.
Climate risk First Street
- Flood 1/10 Low FEMA zone X (unshaded) · 0% chance over 30 yrs
- Wildfire 1/10 Low
- Heat 7/10 Severe 7 d/yr ≥108°F today · 22 d/yr by 30 yrs out
- Wind 4/10 Moderate 24% chance of damaging wind over 30 yrs
- Air quality 3/10 Moderate 2 unhealthy d/yr today · 3 by 30 yrs out
Nearby sold comps map
Loading sold comps map…
Walkable amenities ~0.75 mi
Loading nearby amenities…
Taxation est. · year 1
- Rental income
- $18,169
- − Mortgage interest
- −$7,562
- − Property taxes
- −$1,968
- − Insurance
- −$675
- − Repairs & maintenance
- −$1,453
- − Management
- −$1,453
- − Depreciation
- −$3,927
- Taxable income
- $1,129
- Est. tax owed @ 24.0%
- −$271
- After-tax cash flow
- $2,944/yr
For passive investors: Depreciation is non-cash, so a rental often shows a tax loss while cash-flowing — sheltering income. Rental losses are passive: they offset passive income freely, and up to $25,000/yr can offset ordinary (W-2) income if you actively participate and your MAGI is under $100k (phasing out to $0 by $150k); unused losses carry forward. On sale, claimed depreciation is recaptured at up to 25%, and gains may owe capital-gains tax (a 1031 exchange can defer both). Figures are a year-1 estimate at your 24.0% rate — not tax advice; consult a CPA.
Schools (NCES district)
- District
- Fort Worth ISD
- NCES district ID
- 4819700
- Math proficiency
- 18% ▼ -16.00%
- Reading proficiency
- 28% ▼ -6.00%
- Median HH income
- $42,109
- Composite
- 19.61/100
- National rank
- #8753
- State rank
- #742 of 826 in TX
Livability — Fort Worth
- Score
- 80/100
- State rank
- #49
- US rank
- #1954
Category grades
Schools grade is shown separately in the Schools card above.
Census & demographics
- Census place
- Fort Worth, TX
- County
- Tarrant County · 2,033,669 people
- City population
- 911,619
- Metro
- Dallas-Fort Worth-Arlington, TX
- Population (ZIP)
- 49,856
- Household income
- $56,187
- Rent vs Own
- Severe rent burden
- 4188.0
Population outlook (Tarrant County) Hauer SSP2
- Today (2025)
- 2,380,417 people
- By 2030
- 2,578,900 · +8.3%
- By 2040
- 2,974,995 · +25.0%
- By 2050
- 3,350,489 · +40.8%
- By 2075
- 4,216,909 · +77.2%
- By 2100
- 4,741,527 · +99.2%
Race, ethnicity, and origin ACS 2023
- Neighborhood character
- Diverse neighborhood (Simpson 0.66)
- Race & ethnicity
- White 48% Hispanic / Latino 27% Black 20% Two or more races 11% Asian 2%
- Hispanic origin (detail)
- Mexican 22% Puerto Rican 1%
- Common ancestry
- Italian 2% Slovak 1% Lithuanian 1%
- Foreign-born
- 10% · Canada, China
- Languages at home
- 79% English-only · Spanish 17% Other Indo-European 1% Chinese 1%
Political lean MEDSL · Tarrant
- 2024 margin
- Lean R (+5.1) · D 46.7% · R 51.9% · Other 1.4%
- 2008→2024 swing
- +6.6pp toward D · 2008: -11.7pp · 2024: -5.1pp
- All cycles
- 2024: R+5.1 2020: D+0.2 2016: R+8.7 2012: R+15.7 2008: R+11.7
Not yet ingested
- Civics
- —
Market trends
- HPI YoY
- ▼ -283.10%
- Current HPI
- 282.3806
- Rent YoY
- ▲ 1.77%
- Metro
- Dallas-Fort Worth-Arlington, TX
- State GDP YoY
- ▲ 3.95%
- F500 in state
- 110
Industry mix (Fortune 500 HQ in TX)
| Industry | F500 HQs | Revenue |
|---|---|---|
| Energy | 16 | $1,198B |
|
||
| Technology | 5 | $198B |
|
||
| Engineering / Construction | 4 | $72B |
|
||
| Energy Services | 3 | $60B |
|
||
| Utilities | 3 | $41B |
|
||
| Healthcare | 2 | $330B |
|
||
Price history
5 events — show timeline
- 2026-06-11 Sold (MLS) — NTREIS
- 2026-05-26 Pending — NTREIS
- 2026-05-13 Contingent — NTREIS
- 2026-05-06 Listed $135,000 NTREIS
- 1985-06-18 Sold (Public Records) — Public Records
Property tax history
+4.5%/yrLatest (2025): $1,968 · -2.4% YoY. Source: county tax records.
Cash-flow waterfall
monthlySold comps — $/sqft
last 12 mo · ≤1 miLoading sold comps…