 🏷️ Likely Rental
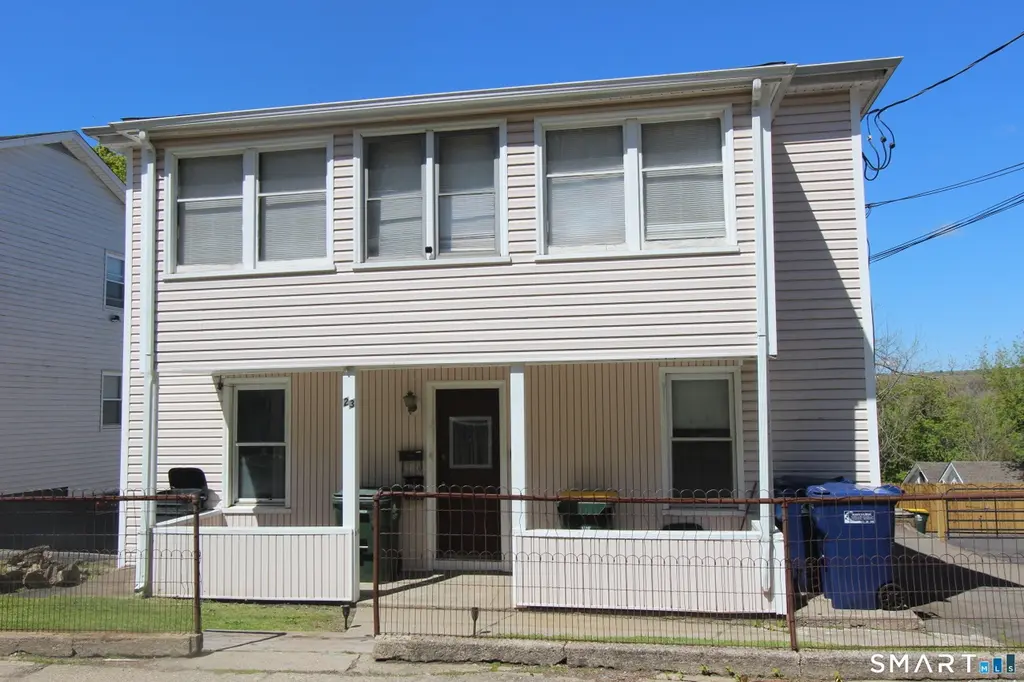
23 N Spring St · Ansonia, CT
Flood risk 1/10 · Minimal
- FEMA flood zone
- X (unshaded)
- Chance of flooding over 30 yrs
- 0.0%
- Est. flood insurance / yr
- $473 – $860
Fire risk 2/10 · Minimal
- Est. fire insurance / yr
- $829 – $1,539
Heat risk 6/10 · Moderate
- Hot days now (above 98°F)
- 7 days/yr
- Hot days in 30 yrs
- 16 days/yr
Wind risk 6/10 · Moderate
- Chance of severe wind over 30 yrs
- 27.0%
Air-quality risk 4/10 · Minor
- Unhealthy air days now
- 4 days/yr
- Unhealthy air days in 30 yrs
- 6 days/yr
Risk factors via First Street. Map © Google.
Why this score? — see what drove the C+ grade
The composite is a weighted blend of 9 inputs, each scored 0–100. Each bar is that input's sub-score; the figure is the points it added to the 100-point composite (weight × sub-score).
- Cash flow +22.3/30.0
- ARV discount +15.0/15.0
- DSCR +7.1/10.0
- 1% rule +5.5/10.0
- Rent growth +4.3/5.0
- Livability +3.6/5.0
- Condition / age +2.5/5.0
- Schools +1.7/10.0
- Appreciation +0.0/10.0
$389,900
🖨 Deal sheet 📄 Offer letter ✓ Due diligence
Multi-family units
County records classify this as Multi-Family (2-4 Unit). Listing-text estimate: 2 units. confirmed
Listing remarks MLS
Great investor property! Great positive cash flow! Full rented with long-term tenants on month-to-month leases. Three bedrooms in each unit; may need cosmetics. House is vinyl sided, has thermal replacement windows, hardwood floors in most of the rooms, separate utilities, natural gas heat and hot water, off-street parking in rear. New (2017) water heater for 1st floor, new gas stove (2017) in second floor apartment. Back porches recently painted. Lot extends behind parking area; stairs at left of parking area down to lower area of lot. Motivated seller!
Key facts
- Spacious layouts
- Ample parking
- Two-family home
Tags
Property features AI
Exterior
- Parking: Space for 6 vehicles; Driveway parking; Off-street parking
- Utilities: Public water connected; Public sewer connected; 30-gallon hot water tank; Gas available in street for heating
- Home design: Multi-family (2-family); Multi-family for sale
- Construction: Frame construction; Vinyl siding; Asphalt shingle roof; Brick and concrete foundation; Built as a two-family residence
- Exterior features: Porch; Gutters; Secluded lot with city views; Private paved driveway; Paved off-street parking
Interior
- Bedrooms: 6 bedrooms
- Bathrooms: 2 full bathrooms
- Heating & cooling: Radiant heat; Window air-conditioning units; Ceiling fans
- Interior features: 12 total rooms; Partial basement; Attic with hatch access; Ceiling fans; Window AC units
Neighborhood map
What this means for you Summary
Snapshot
- This is a 2 × 3-bed/1.0-bath units multifamily listed at $390k.
Deal economics
- At list price, monthly cash flow is $639 ($8k/yr) — positive. Per door: $319/mo.
- The deal already cash-flows at list — no discount required.
- Meets the 1% rule at list price ($4k rent vs $390k).
- Recommended offer: $384k (1.5% below list) — sets the bar for market timing.
- Cap rate 8.3% vs local median 3.8% in Ansonia — top-decile yield for the area; either an underpriced asset or a hidden risk that comps aren't pricing in. Stress-test before assuming the spread holds.
Location & tenants
- Location reads 71/100 on livability (#87 in CT) — a middle-class / working-renter tenant base. Strengths: crime A+, health & safety A+, housing A-; Watch: employment C-, schools F, amenities F.
- Ansonia School District (suburban): math 13% / reading 25% proficiency, ranked #144 of 153 in CT (top 94%) — low school quality limits family demand, transient renter base, plan for 1-2y turnover.
- Market conditions: Rents rising fast (+7.3%/yr); 51 active listings in the ZIP; 2 comparable units currently listed for rent nearby; solid renter incomes; 502 units permitted in Naugatuck Valley Planning Region in 2024 (171 in 5+ unit buildings).
- At $4,113/mo this rent would consume 57% of the median local household income ($86k/yr) (locally 541% of renters already pay >50% of income on rent) — very limited rent-growth headroom before tenants either downsize or default.
Forward outlook
- Local home prices are declining (-3.0%/yr); year-one equity from $3k of loan paydown is wiped out by about $12k of value loss. Plan a longer hold.
- At projected returns (-3.0% appreciation + 7.3% rent growth), your $109k cash investment doubles in ~9 years — after that, you're playing with house money.
Negotiation context
- It's been on market 27 days — a 2% lower offer ($384k) is reasonable based on typical stale-listing flexibility.
- 9 sale attempts since 30y ago with the ask held roughly flat each time — persistent listings suggest the price (not the market) is what's stuck; bring a comps-based counter.
- Current owner paid $172k; list at $390k implies a 126% gain — meaningful room to come down on a strong offer.
Risks & watch-outs
- Watch-outs: built in 1920 — expect roof / HVAC / electrical / plumbing capex.
- Climate carrying-cost: major wind risk, 27% chance of damaging wind over 30y; extreme-heat days projected 7→16/yr by 2055 (HVAC capex compounding) — expect insurance premiums to compound above CPI over the hold.
Questions for the listing agent
- Can we see the unit-by-unit rent roll, current vacancy, and any below-market leases? What's the average tenancy length?
- What capital expenditures (roof, boiler, parking lot, exteriors) have been made in the last 5 years, and what's planned in the next 2?
- Built in 1920 — when were the roof, HVAC, electrical panel, plumbing, and water heater last replaced?
- Is there a deadline driving the sale (1031 exchange, divorce, estate, relocation)? That informs how much negotiation room exists.
- Schools are F-rated, which usually means shorter tenancies and higher turnover. Who's the typical renter profile here, and what's been the actual vacancy rate?
- What's the average days-on-market for RENTAL listings here right now (not sales)? A rising rental-DOM trend means longer vacancies and softer asking-rent achievability than the comps imply.
- What's the recent tenant-quality profile in this submarket — average credit score on applications, eviction rate, late-payment / NSF rate, and stable-employment percentage? A property-management company in the area should have these aggregated.
- How much new apartment / multifamily construction is in the pipeline within 1–3 miles? Heavy new supply (>2% of stock underway) typically softens rents 12–24 months out; light construction supports rent growth.
Investment metrics
- 1% rule
- 1.05% ✓
- Cap rate
- 8.26%
- Cash-on-cash
- 7.02%
- DSCR
- 1.31
- GRM
- 7.9
CMA / ARV
- ARV (median comp)
- $497,401
- List price
- $389,900
- Delta
- -21.61%
- Verdict
- UNDERPRICED
- Comps
- 20 within 1.0 mi
Show comp detail 7 sales within ~0.75 mi
| Address | Dist | Beds/Ba | Sqft | Sold | Price | $/sf | Match |
|---|---|---|---|---|---|---|---|
| 103 Myrtle Ave | 0.30mi | 5/2.0 (-1) | 1,984 (-3%) | 5mo | $385,000 | $194 | 72 |
| 21 N Spring St | 0.01mi | 6/2.0 | 2,240 (+10%) | 21mo | $440,000 | $196 | 65 |
| 3 Hunters Ln | 0.41mi | 5/2.0 (-1) | 1,916 (-6%) | 17mo | $499,900 | $261 | 51 |
| 281 Beaver St | 0.63mi | 6/2.5 | 2,080 (+2%) | 20mo | $490,000 | $236 | 48 |
| 6 Crescent St | 0.66mi | 6/2.0 | 1,762 (-14%) | 7mo | $405,000 | $230 | 41 |
| 22 Columbia St | 0.58mi | 6/2.0 | 2,240 (+10%) | 23mo | $380,000 | $170 | 37 |
| 17 Bassett St | 0.73mi | 6/5.0 | 2,184 (+7%) | 13mo | $440,000 | $201 | 31 |
Match score weights: distance 35% · size 25% · config 20% · recency 20%. Top-matched comps best support the ARV.
Projected returns pro-forma
-3.0% appreciation · 7.35% rent growth · sell at horizon
- IRR
- -0.9%
- Equity multiple
- 0.97×
- Total profit
- $-3,695
- Equity at exit
- $58,135
- IRR
- 12.9%
- Equity multiple
- 2.22×
- Total profit
- $133,570
- Equity at exit
- $33,711
Cash invested: $109,172 (down + closing). Projections, not guarantees.
Landlord ↔ Tenant lean methodology
- Overall (STATE)
- 27 Tenant-Leaning
- State Connecticut
- 27 Tenant-Leaning · D+7
- County
- — inherits STATE
- City
- — inherits STATE
ZIP-level market 06401
- Home prices YoY
- -4.7%
- Rents YoY
- 7.3%
- Active inventory
- 51
- Price-to-rent
- 15.8×
Monthly cashflow live
- Estimated rent
- $4,113 high interval (Pro) →
- Mortgage (P&I)
- −$2,045
- Tax from tax record
- −$403 /mo · $4,840/yr
- Insurance
- −$162
- HOA
- −$0
- Vacancy / Maint / Mgmt
- −$864
- Net cashflow
- $639
Break-even live
2-unit breakdown (identical units grouped — click to expand)
| Units | Beds | Baths | Est. rent |
|---|---|---|---|
| 2× units | 3 | 1 | $4,114 |
| #1 | 3 | 1 | $2,057 |
| #2 | 3 | 1 | $2,057 |
| Total (2 units) | $4,113 | ||
UW: 25.0% down · 7.5% · 30yr · 1.5% tax · 5.0% vac · 8.0% maint · 8.0% mgmt
Financing live
Cash to close
- Down payment
- $97,475
- Closing costs
- $11,697
- Reserves months
- —
- Total cash needed
- —
Loan-product check · same deal, 3 products live
Conventional
25% down · 7.5% · 30yr
- Down + closing
- —
- Monthly P&I
- —
- Monthly cashflow
- —
- DSCR
- —
- Eligible?
- —
Personal DTI + credit; lowest rate.
DSCR
20% down · 8.5% · 30yr
- Down + closing
- —
- Monthly P&I
- —
- Monthly cashflow
- —
- DSCR
- —
- Eligible?
- —
No personal income docs; deal must DSCR.
Hard money
10% down · 12.0% · 12mo
- Down + closing
- —
- Monthly P&I
- —
- Monthly cashflow
- —
- DSCR
- —
- Eligible?
- —
Short-term bridge; refi at stabilization.
Rent comps 2 comps
| Address | Beds | Baths | Sqft | Rent | $/sqft | DOM | Units | Dist |
|---|---|---|---|---|---|---|---|---|
| 20 5th St Unit Osher Ansonia, CT | 6.0 | 2.0 | 2504 | $2,950 | $1.18 | 2d | 1 | 1.08mi |
| 145 Hawkins St Derby, CT | 5.0 | 1.5 | 2632 | $3,500 | $1.33 | 23d | 1 | 1.35mi |
Listing history 24 events
-
2026-05-02$389,900 Active 950-char remark
-
2019-01-04soldstatus $172,200
-
2018-12-28soldstatus $172,200 Closed 560-char remark
Show marketing remark (560 chars)
Great investor property! Great positive cash flow! Full rented with long-term tenants on month-to-month leases. Three bedrooms in each unit; may need cosmetics. House is vinyl sided, has thermal replacement windows, hardwood floors in most of the rooms, separate utilities, natural gas heat and hot water, off-street parking in rear. New (2017) water heater for 1st floor, new gas stove (2017) in second floor apartment. Back porches recently painted. Lot extends behind parking area; stairs at left of parking area down to lower area of lot. Motivated seller!
-
2018-11-21historical 560-char remark
Show marketing remark (560 chars)
Great investor property! Great positive cash flow! Full rented with long-term tenants on month-to-month leases. Three bedrooms in each unit; may need cosmetics. House is vinyl sided, has thermal replacement windows, hardwood floors in most of the rooms, separate utilities, natural gas heat and hot water, off-street parking in rear. New (2017) water heater for 1st floor, new gas stove (2017) in second floor apartment. Back porches recently painted. Lot extends behind parking area; stairs at left of parking area down to lower area of lot. Motivated seller!
-
2018-11-11historical Under Contract - Continue to Show 560-char remark
Show marketing remark (560 chars)
Great investor property! Great positive cash flow! Full rented with long-term tenants on month-to-month leases. Three bedrooms in each unit; may need cosmetics. House is vinyl sided, has thermal replacement windows, hardwood floors in most of the rooms, separate utilities, natural gas heat and hot water, off-street parking in rear. New (2017) water heater for 1st floor, new gas stove (2017) in second floor apartment. Back porches recently painted. Lot extends behind parking area; stairs at left of parking area down to lower area of lot. Motivated seller!
-
2018-09-14price $187,500 560-char remark
Show marketing remark (560 chars)
Great investor property! Great positive cash flow! Full rented with long-term tenants on month-to-month leases. Three bedrooms in each unit; may need cosmetics. House is vinyl sided, has thermal replacement windows, hardwood floors in most of the rooms, separate utilities, natural gas heat and hot water, off-street parking in rear. New (2017) water heater for 1st floor, new gas stove (2017) in second floor apartment. Back porches recently painted. Lot extends behind parking area; stairs at left of parking area down to lower area of lot. Motivated seller!
-
2018-09-06status Active 560-char remark
Show marketing remark (560 chars)
Great investor property! Great positive cash flow! Full rented with long-term tenants on month-to-month leases. Three bedrooms in each unit; may need cosmetics. House is vinyl sided, has thermal replacement windows, hardwood floors in most of the rooms, separate utilities, natural gas heat and hot water, off-street parking in rear. New (2017) water heater for 1st floor, new gas stove (2017) in second floor apartment. Back porches recently painted. Lot extends behind parking area; stairs at left of parking area down to lower area of lot. Motivated seller!
-
2018-09-06historical Under Contract - Continue to Show 560-char remark
Show marketing remark (560 chars)
Great investor property! Great positive cash flow! Full rented with long-term tenants on month-to-month leases. Three bedrooms in each unit; may need cosmetics. House is vinyl sided, has thermal replacement windows, hardwood floors in most of the rooms, separate utilities, natural gas heat and hot water, off-street parking in rear. New (2017) water heater for 1st floor, new gas stove (2017) in second floor apartment. Back porches recently painted. Lot extends behind parking area; stairs at left of parking area down to lower area of lot. Motivated seller!
-
2018-07-18$195,000 Active 560-char remark
Show marketing remark (560 chars)
Great investor property! Great positive cash flow! Full rented with long-term tenants on month-to-month leases. Three bedrooms in each unit; may need cosmetics. House is vinyl sided, has thermal replacement windows, hardwood floors in most of the rooms, separate utilities, natural gas heat and hot water, off-street parking in rear. New (2017) water heater for 1st floor, new gas stove (2017) in second floor apartment. Back porches recently painted. Lot extends behind parking area; stairs at left of parking area down to lower area of lot. Motivated seller!
-
2012-02-15historical
-
2011-12-23historical
-
2011-08-15$189,900
-
2011-06-10$187,900
-
2010-05-15historical
-
2009-12-15$205,900
-
2006-09-22historical
-
2006-03-22$252,500
-
2005-05-04soldstatus $190,000
-
2005-04-20soldstatus $190,000
-
2004-05-16$199,900
-
1996-07-12soldstatus $85,000
-
1996-07-12soldstatus $85,000
-
1996-01-10$99,900
-
1993-05-21soldstatus $80,000
ⓘ Source: listings_history table (triggers on properties + properties_extension) + one-shot
backfill from property_details.listing_events for pre-trigger history.
Tax reassessment forecast CT · Partial reset (capped growth)
- Current annual tax
- $4,840 · $403/mo
- Projected year-2 tax
- $6,592 · $549/mo
- Expected delta
- +$1,752/yr (+$146/mo · 36.2%)
ⓘ Screening estimate from a state-policy table — verify with the county assessor before closing.
Climate risk First Street
- Flood 1/10 Low FEMA zone X (unshaded) · 0% chance over 30 yrs
- Wildfire 2/10 Low
- Heat 6/10 Major 7 d/yr ≥98°F today · 16 d/yr by 30 yrs out
- Wind 6/10 Major 27% chance of damaging wind over 30 yrs
- Air quality 4/10 Moderate 4 unhealthy d/yr today · 6 by 30 yrs out
Nearby sold comps map
Loading sold comps map…
Walkable amenities ~0.75 mi
Loading nearby amenities…
Taxation est. · year 1
- Rental income
- $49,356
- − Mortgage interest
- −$21,840
- − Property taxes
- −$4,840
- − Insurance
- −$1,950
- − Repairs & maintenance
- −$3,948
- − Management
- −$3,948
- − Depreciation
- −$11,343
- Taxable income
- $1,487
- Est. tax owed @ 24.0%
- −$357
- After-tax cash flow
- $7,309/yr
For passive investors: Depreciation is non-cash, so a rental often shows a tax loss while cash-flowing — sheltering income. Rental losses are passive: they offset passive income freely, and up to $25,000/yr can offset ordinary (W-2) income if you actively participate and your MAGI is under $100k (phasing out to $0 by $150k); unused losses carry forward. On sale, claimed depreciation is recaptured at up to 25%, and gains may owe capital-gains tax (a 1031 exchange can defer both). Figures are a year-1 estimate at your 24.0% rate — not tax advice; consult a CPA.
Schools (NCES district)
- District
- Ansonia School District
- NCES district ID
- 0900060
- Math proficiency
- 13% ▼ -15.00%
- Reading proficiency
- 25% ▼ -12.00%
- Median HH income
- $49,300
- Composite
- 16.97/100
- National rank
- #9132
- State rank
- #144 of 153 in CT
Livability — Ansonia
- Score
- 71/100
- State rank
- #87
- US rank
- #6938
Category grades
Schools grade is shown separately in the Schools card above.
Census & demographics
- Census place
- Ansonia, CT
- County
- New Haven County · 688,236 people
- City population
- 19,315
- Metro
- New Haven-Milford, CT
- Population (ZIP)
- 19,315
- Household income
- $86,178
- Rent vs Own
- Severe rent burden
- 541.0
Population outlook (Naugatuck Valley County) Hauer SSP2
- By 2040
- 496,846
Race, ethnicity, and origin ACS 2023
- Neighborhood character
- Diverse neighborhood (Simpson 0.66)
- Race & ethnicity
- White 50% Hispanic / Latino 25% Black 17% Two or more races 11% Asian 3%
- Hispanic origin (detail)
- Puerto Rican 11% Dominican 4%
- Common ancestry
- Romanian 7% Russian 1% Scotch-Irish 1%
- Foreign-born
- 18% · Canada, Jamaica, China
- Languages at home
- 75% English-only · Spanish 15% Other Indo-European 5% Russian/Polish/Slavic 2%
Political lean MEDSL · Naugatuck Valley
- 2024 margin
- Lean R (+7.4) · D 45.6% · R 53.0% · Other 1.4%
- All cycles
- 2024: R+7.4
Not yet ingested
- Civics
- —
Market trends
- HPI YoY
- ▼ -13.08%
- Current HPI
- 264.8538
- Rent YoY
- ▲ 7.35%
- Metro
- New Haven-Milford, CT
- State GDP YoY
- ▲ 1.06%
- F500 in state
- 38
Industry mix (Fortune 500 HQ in CT)
| Industry | F500 HQs | Revenue |
|---|---|---|
| Industrial Machinery | 4 | $38B |
|
||
| Insurance | 3 | $71B |
|
||
| Financial Services | 2 | $25B |
|
||
| Transportation / Logistics | 2 | $18B |
|
||
| Healthcare | 1 | $247B |
|
||
| Telecommunications | 1 | $55B |
|
||
Price history
+387.4% since first listed25 events — show timeline
- 2026-05-29 Pending — Smart MLS
- 2026-05-02 Listed $389,900 Smart MLS
- 2019-01-04 Sold (Public Records) $172,200 Public Records
- 2018-12-28 Sold (MLS) $172,200 Smart MLS
- 2018-11-21 Listing Removed — Smart MLS
- 2018-11-11 Contingent — Smart MLS
- 2018-09-14 Price Changed $187,500 Smart MLS
- 2018-09-06 Relisted — Smart MLS
- 2018-09-06 Contingent — Smart MLS
- 2018-07-18 Listed $195,000 Smart MLS
- 2012-02-15 Listing Removed — Smart MLS
- 2011-12-23 Listing Removed — Smart MLS
- 2011-08-15 Listed $189,900 Smart MLS
- 2011-06-10 Listed $187,900 Smart MLS
- 2010-05-15 Listing Removed — Smart MLS
- 2009-12-15 Listed $205,900 Smart MLS
- 2006-09-22 Listing Removed — Smart MLS
- 2006-03-22 Listed $252,500 Smart MLS
- 2005-05-04 Sold (Public Records) $190,000 Public Records
- 2005-04-20 Sold (MLS) $190,000 Smart MLS
- 2004-05-16 Listed $199,900 Smart MLS
- 1996-07-12 Sold (Public Records) $85,000 Public Records
- 1996-07-12 Sold (MLS) $85,000 Smart MLS
- 1996-01-10 Listed $99,900 Smart MLS
- 1993-05-21 Sold (Public Records) $80,000 Public Records
Property tax history
+1.3%/yrLatest (2023): $4,840 · +5.0% YoY. Source: county tax records.
Cash-flow waterfall
monthlySold comps — $/sqft
last 12 mo · ≤1 miLoading sold comps…