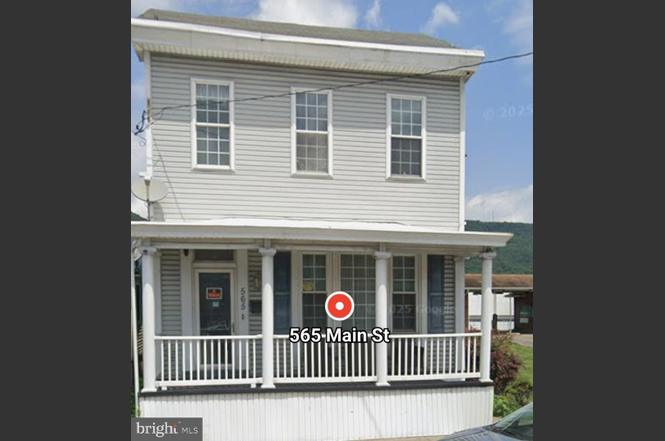
565 Main St · Lykens, PA
Flood risk 8/10 · Major
- FEMA flood zone
- X (shaded)
- Chance of flooding over 30 yrs
- 0.99%
- Est. flood insurance / yr
- $473 – $860
Fire risk 3/10 · Minor
- Est. fire insurance / yr
- $511 – $949
Heat risk 5/10 · Moderate
- Hot days now (above 95°F)
- 8 days/yr
- Hot days in 30 yrs
- 17 days/yr
Wind risk 3/10 · Minor
- Chance of severe wind over 30 yrs
- 4.0%
Air-quality risk 2/10 · Minimal
- Unhealthy air days now
- 1 days/yr
- Unhealthy air days in 30 yrs
- 2 days/yr
Risk factors via First Street. Map © Google.
Why this score? — see what drove the C- grade
The composite is a weighted blend of 9 inputs, each scored 0–100. Each bar is that input's sub-score; the figure is the points it added to the 100-point composite (weight × sub-score).
- ARV discount +14.8/15.0
- Cash flow +12.0/30.0
- Appreciation +4.8/10.0
- Schools +3.9/10.0
- DSCR +3.5/10.0
- Livability +3.4/5.0
- 1% rule +3.1/10.0
- Rent growth +2.5/5.0
- Condition / age +2.5/5.0
$148,000
🖨 Deal sheet 📄 Offer letter ✓ Due diligence
Listing remarks MLS
Amazing Property That Was Completely REBUILT in 2003 After a Fire. Lovely High Ceilings, 2 Staircases, Security System, Large Closets, Large Rear Deck, Perfect for Entertaining. Oil Heat. This Home is a "Must See" & You Will Fall in Love!! Call for an Appointment.
Key facts
- Double vanity sink
- Kitchen layout
- French doors
Tags
Neighborhood map
What this means for you Summary
Snapshot
- This is a 3-bed/2.0-bath single-family listed at $148k.
Deal economics
- At list price, monthly cash flow is $-92 ($-1k/yr) — negative.
- To cash-flow at today's rent, offer at most $132k (11.0% below list).
- To meet the 1% rule (rent ≥ 1% of price), the offer needs to be $120k (18.9% below list).
- Recommended offer: $120k (18.9% below list) — sets the bar for 1% rule.
Location & tenants
- Location reads 67/100 on livability (#969 in PA) — a middle-class / working-renter tenant base. Strengths: crime A+, cost of living A+, housing A+; Watch: amenities F, commute F, employment D-.
- Upper Dauphin Area SD (rural): math 37% / reading 55% proficiency, ranked #259 of 539 in PA (top 48%) — families likely to look elsewhere, expect single-tenant / working-renter base with shorter leases.
- Zoned schools: Upper Dauphin Area Hs (math 77%, 343 students, 47% FRL).
- Market conditions: 26 active listings in the ZIP; 1 comparable units currently listed for rent nearby; 540 units permitted in Dauphin County in 2024 (194 in 5+ unit buildings).
Forward outlook
- In year one you build about $311 of equity ($1k loan paydown + $-712 appreciation (-0.5% local appreciation)).
Negotiation context
- It's been on market 90 days — a 6% lower offer ($139k) is reasonable based on typical stale-listing flexibility.
- 4 sale attempts since 19y ago; this cycle's ask has dropped $12k (8%) from the opening price — seller is motivated, your offer sets the floor, not the list.
- Current owner paid $95k; list at $148k implies a 56% gain — meaningful room to come down on a strong offer.
Risks & watch-outs
- Watch-outs: flood insurance adds $56/mo; built in 1870 — expect roof / HVAC / electrical / plumbing capex.
- Climate carrying-cost: severe flood risk; extreme-heat days projected 8→17/yr by 2055 (HVAC capex compounding) — expect insurance premiums to compound above CPI over the hold.
Questions for the listing agent
- What do current leases actually rent for vs. the listed asking? Can we see a recent rent roll and the last 12 months of T-12 income?
- It's been on market 90 days. Have you received any prior offers? Is the seller open to a 19% concession, seller financing, or rate buy-down credit?
- Built in 1870 — when were the roof, HVAC, electrical panel, plumbing, and water heater last replaced?
- What's the actual annual flood-insurance premium (NFIP or private), and is the property in a SFHA with mandatory coverage?
- Why hasn't it sold? Are there any deal-killer items the seller is aware of (foundation, flood, title, zoning, code violations)?
- Is there a deadline driving the sale (1031 exchange, divorce, estate, relocation)? That informs how much negotiation room exists.
- Schools are D-rated, which usually means shorter tenancies and higher turnover. Who's the typical renter profile here, and what's been the actual vacancy rate?
- What's the average days-on-market for RENTAL listings here right now (not sales)? A rising rental-DOM trend means longer vacancies and softer asking-rent achievability than the comps imply.
- What's the recent tenant-quality profile in this submarket — average credit score on applications, eviction rate, late-payment / NSF rate, and stable-employment percentage? A property-management company in the area should have these aggregated.
- How much new for-sale + rental construction is in the pipeline within 1–3 miles? Heavy new supply typically softens prices + rents 12–24 months out; constrained supply supports both.
Investment metrics
- 1% rule
- 0.81% ✗
- Cap rate
- 6.00%
- Cash-on-cash
- -1.05%
- DSCR
- 0.95
- GRM
- 10.3
CMA / ARV
- ARV (on-the-fly)
- $176,500
- Comps found
- 10
Show comp detail 10 sales within ~0.75 mi
| Address | Dist | Beds/Ba | Sqft | Sold | Price | $/sf | Match |
|---|---|---|---|---|---|---|---|
| 521 S 2nd St | 0.10mi | 2/2.0 (-1) | 1,503 (+6%) | 11mo | $205,000 | $136 | 70 |
| 700 South St | 0.26mi | 3/1.0 | 1,316 (-7%) | 12mo | $165,000 | $125 | 62 |
| 454 S 2nd St | 0.17mi | 3/2.0 | 1,596 (+13%) | 10mo | $174,900 | $110 | 62 |
| 433 S 2nd St | 0.20mi | 4/2.0 (+1) | 1,598 (+13%) | 7mo | $154,500 | $97 | 58 |
| 618 Park View Rd | 0.31mi | 3/1.5 | 1,296 (-8%) | 15mo | $234,000 | $181 | 57 |
| 312 Center St | 0.59mi | 3/1.5 | 1,575 (+12%) | 1mo | $228,100 | $145 | 50 |
| 767 Main St | 0.36mi | 3/1.5 | 1,603 (+14%) | 10mo | $120,000 | $75 | 50 |
| 519 S 2nd St | 0.10mi | 2/1.0 (-1) | 1,248 (-12%) | 23mo | $61,000 | $49 | 48 |
| 312 Pottsville St | 0.71mi | 3/1.5 | 1,410 (-0%) | 23mo | $120,000 | $85 | 46 |
| 822 Main St | 0.45mi | 3/1.5 | 1,265 (-10%) | 23mo | $175,000 | $138 | 41 |
Match score weights: distance 35% · size 25% · config 20% · recency 20%. Top-matched comps best support the ARV.
Projected returns pro-forma
-0.48% appreciation · 3.0% rent growth · sell at horizon
- IRR
- -7.2%
- Equity multiple
- 0.68×
- Total profit
- $-13,460
- Equity at exit
- $39,448
- IRR
- -0.8%
- Equity multiple
- 0.92×
- Total profit
- $-3,378
- Equity at exit
- $44,688
Cash invested: $41,440 (down + closing). Projections, not guarantees.
Landlord ↔ Tenant lean methodology
- Overall (STATE)
- 62 Landlord-Friendly
- State Pennsylvania
- 62 Landlord-Friendly · EVEN
- County
- — inherits STATE
- City
- — inherits STATE
ZIP-level market 17048
- Home prices YoY
- -0.2%
- Active inventory
- 26
- Price-to-rent
- 10.3×
Monthly cashflow live
- Estimated rent
- $1,200 medium interval (Pro) →
- Mortgage (P&I)
- −$776
- Tax from tax record
- −$146 /mo · $1,757/yr
- Insurance
- −$62
- Flood insurance flood zone
- −$56 /mo · $666/yr
- HOA
- −$0
- Vacancy / Maint / Mgmt
- −$252
- Net cashflow
- $-92
Break-even live
UW: 25.0% down · 7.5% · 30yr · 1.5% tax · 5.0% vac · 8.0% maint · 8.0% mgmt
Financing live
Cash to close
- Down payment
- $37,000
- Closing costs
- $4,440
- Reserves months
- —
- Total cash needed
- —
Loan-product check · same deal, 3 products live
Conventional
25% down · 7.5% · 30yr
- Down + closing
- —
- Monthly P&I
- —
- Monthly cashflow
- —
- DSCR
- —
- Eligible?
- —
Personal DTI + credit; lowest rate.
DSCR
20% down · 8.5% · 30yr
- Down + closing
- —
- Monthly P&I
- —
- Monthly cashflow
- —
- DSCR
- —
- Eligible?
- —
No personal income docs; deal must DSCR.
Hard money
10% down · 12.0% · 12mo
- Down + closing
- —
- Monthly P&I
- —
- Monthly cashflow
- —
- DSCR
- —
- Eligible?
- —
Short-term bridge; refi at stabilization.
Rent comps 1 comps
| Address | Beds | Baths | Sqft | Rent | $/sqft | DOM | Units | Dist |
|---|---|---|---|---|---|---|---|---|
| 609 Spruce St Lykens, PA | 2.0 | 1.0 | 1404 | $1,200 | $0.85 | 43d | 1 | 0.22mi |
Listing history 18 events
-
2026-04-17status Pending
-
2026-04-01price $148,000
-
2026-03-11price $150,000
-
2026-03-06price $153,000
-
2026-02-28price $155,500
-
2026-02-24price $158,000
-
2026-02-14status Active
-
2026-02-08status Pending
-
2026-01-29price $159,000
-
2026-01-10$160,000 Active
-
2021-10-15soldstatus $95,000
-
2013-09-08historical
-
2013-01-08$124,900
-
2007-07-17soldstatus $130,000
-
2007-07-15soldstatus $130,000 281-char remark
Show marketing remark (281 chars)
Amazing Property That Was Completely REBUILT in 2003 After a Fire. Lovely High Ceilings, 2 Staircases, Security System, Large Closets, Large Rear Deck, Perfect for Entertaining. Oil Heat. This Home is a "Must See" & You Will Fall in Love!! Call for an Appointment.
-
2007-06-02historical 281-char remark
Show marketing remark (281 chars)
Amazing Property That Was Completely REBUILT in 2003 After a Fire. Lovely High Ceilings, 2 Staircases, Security System, Large Closets, Large Rear Deck, Perfect for Entertaining. Oil Heat. This Home is a "Must See" & You Will Fall in Love!! Call for an Appointment.
-
2007-05-31$174,900 281-char remark
Show marketing remark (281 chars)
Amazing Property That Was Completely REBUILT in 2003 After a Fire. Lovely High Ceilings, 2 Staircases, Security System, Large Closets, Large Rear Deck, Perfect for Entertaining. Oil Heat. This Home is a "Must See" & You Will Fall in Love!! Call for an Appointment.
-
1999-06-29soldstatus $57,170
ⓘ Source: listings_history table (triggers on properties + properties_extension) + one-shot
backfill from property_details.listing_events for pre-trigger history.
Tax reassessment forecast PA · Partial reset (capped growth)
- Current annual tax
- $1,757 · $146/mo
- Projected year-2 tax
- $2,048 · $171/mo
- Expected delta
- +$291/yr (+$24/mo · 16.5%)
ⓘ Screening estimate from a state-policy table — verify with the county assessor before closing.
Climate risk First Street
- Flood 8/10 Severe FEMA zone X (shaded) · 99% chance over 30 yrs
- Wildfire 3/10 Moderate
- Heat 5/10 Major 8 d/yr ≥95°F today · 17 d/yr by 30 yrs out
- Wind 3/10 Moderate 4% chance of damaging wind over 30 yrs
- Air quality 2/10 Low 1 unhealthy d/yr today · 2 by 30 yrs out
Nearby sold comps map
Loading sold comps map…
Walkable amenities ~0.75 mi
Loading nearby amenities…
Taxation est. · year 1
- Rental income
- $14,400
- − Mortgage interest
- −$8,290
- − Property taxes
- −$1,757
- − Insurance
- −$1,406
- − Repairs & maintenance
- −$1,152
- − Management
- −$1,152
- − Depreciation
- −$4,305
- Taxable loss
- −$3,663
- Est. tax savings @ 24.0%
- +$879
- After-tax cash flow
- $-222/yr
For passive investors: Depreciation is non-cash, so a rental often shows a tax loss while cash-flowing — sheltering income. Rental losses are passive: they offset passive income freely, and up to $25,000/yr can offset ordinary (W-2) income if you actively participate and your MAGI is under $100k (phasing out to $0 by $150k); unused losses carry forward. On sale, claimed depreciation is recaptured at up to 25%, and gains may owe capital-gains tax (a 1031 exchange can defer both). Figures are a year-1 estimate at your 24.0% rate — not tax advice; consult a CPA.
Schools (NCES district)
- District
- Upper Dauphin Area SD
- NCES district ID
- 4224360
- Math proficiency
- 37% ▼ -3.00%
- Reading proficiency
- 55% ▼ -8.00%
- Median HH income
- $48,201
- Composite
- 39.23/100
- National rank
- #4012
- State rank
- #259 of 539 in PA
Livability — Lykens
- Score
- 67/100
- State rank
- #969
- US rank
- #10571
Category grades
Schools grade is shown separately in the Schools card above.
Census & demographics
- Census place
- Lykens, PA
- Population (ZIP)
- 3,801
Population outlook (Dauphin County) Hauer SSP2
- Today (2025)
- 281,628 people
- By 2030
- 283,549 · +0.7%
- By 2040
- 285,385 · +1.3%
- By 2050
- 286,188 · +1.6%
- By 2075
- 291,053 · +3.3%
- By 2100
- 282,374 · +0.3%
Race, ethnicity, and origin ACS 2023
- Neighborhood character
- Predominantly White (88%)
- Race & ethnicity
- White 88% Two or more races 8% Hispanic / Latino 2% Asian 2%
- Common ancestry
- Polish 4% Romanian 3% Iranian 3%
- Foreign-born
- 1% · Canada, India
- Languages at home
- 88% English-only · German/W. Germanic 10% Spanish 2%
Political lean MEDSL · Dauphin
- 2024 margin
- Lean D (+5.9) · D 52.4% · R 46.5% · Other 1.1%
- 2008→2024 swing
- -3.1pp toward R · 2008: 9.1pp · 2024: 5.9pp
- All cycles
- 2024: D+5.9 2020: D+8.5 2016: D+2.8 2012: D+6.0 2008: D+9.1
Not yet ingested
- Civics
- —
Market trends
- HPI YoY
- ▼ -0.48%
- Current HPI
- 241.7628
- Rent YoY
- —
- Metro
- —
- State GDP YoY
- ▲ 1.68%
- F500 in state
- 34
Industry mix (Fortune 500 HQ in PA)
| Industry | F500 HQs | Revenue |
|---|---|---|
| Healthcare | 2 | $309B |
|
||
| Insurance | 2 | $27B |
|
||
| Telecommunications / Media | 1 | $124B |
|
||
| Industrial Distribution | 1 | $22B |
|
||
| Financial Services | 1 | $20B |
|
||
| Chemicals / Materials | 1 | $18B |
|
||
Price history
+158.9% since first listed18 events — show timeline
- 2026-04-17 Pending — BRIGHT MLS
- 2026-04-01 Price Changed $148,000 BRIGHT MLS
- 2026-03-11 Price Changed $150,000 BRIGHT MLS
- 2026-03-06 Price Changed $153,000 BRIGHT MLS
- 2026-02-28 Price Changed $155,500 BRIGHT MLS
- 2026-02-24 Price Changed $158,000 BRIGHT MLS
- 2026-02-14 Relisted — BRIGHT MLS
- 2026-02-08 Pending — BRIGHT MLS
- 2026-01-29 Price Changed $159,000 BRIGHT MLS
- 2026-01-10 Listed $160,000 BRIGHT MLS
- 2021-10-15 Sold (Public Records) $95,000 Public Records
- 2013-09-08 Listing Removed — BRIGHT MLS
- 2013-01-08 Listed $124,900 BRIGHT MLS
- 2007-07-17 Sold (Public Records) $130,000 Public Records
- 2007-07-15 Sold (MLS) $130,000 BRIGHT MLS
- 2007-06-02 Listing Removed — BRIGHT MLS
- 2007-05-31 Listed $174,900 BRIGHT MLS
- 1999-06-29 Sold (Public Records) $57,170 Public Records
Property tax history
+2.2%/yrLatest (2026): $1,757 · +5.6% YoY. Source: county tax records.
Cash-flow waterfall
monthlySold comps — $/sqft
last 12 mo · ≤1 miLoading sold comps…