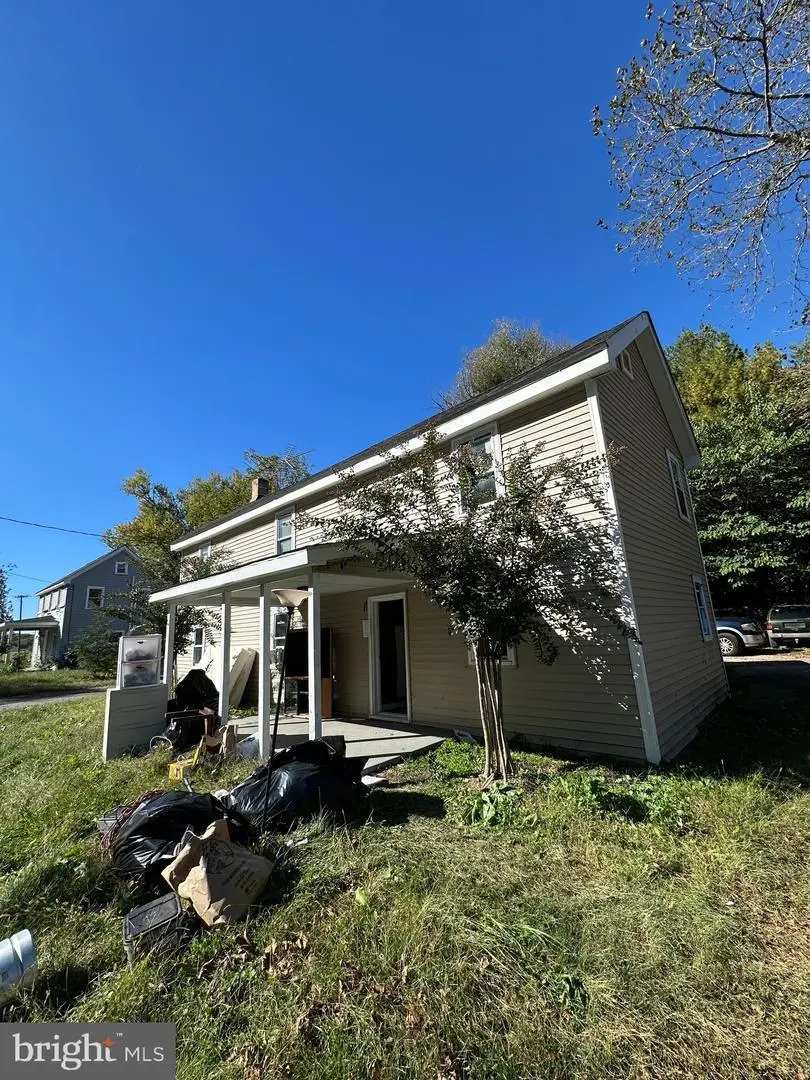
943 Cayots Corner Rd · Chesapeake City, MD
Flood risk 1/10 · Minimal
- FEMA flood zone
- X (unshaded)
- Chance of flooding over 30 yrs
- 0.0%
- Est. flood insurance / yr
- $507 – $1,088
Fire risk 4/10 · Minor
- Est. fire insurance / yr
- $755 – $1,403
Heat risk 7/10 · Major
- Hot days now (above 103°F)
- 7 days/yr
- Hot days in 30 yrs
- 15 days/yr
Wind risk 6/10 · Moderate
- Chance of severe wind over 30 yrs
- 27.0%
Air-quality risk 3/10 · Minor
- Unhealthy air days now
- 2 days/yr
- Unhealthy air days in 30 yrs
- 4 days/yr
Risk factors via First Street. Map © Google.
Why this score? — see what drove the B- grade
The composite is a weighted blend of 9 inputs, each scored 0–100. Each bar is that input's sub-score; the figure is the points it added to the 100-point composite (weight × sub-score).
- Cash flow +30.0/30.0
- 1% rule +10.0/10.0
- DSCR +10.0/10.0
- ARV discount +7.5/15.0
- Livability +3.1/5.0
- Rent growth +2.5/5.0
- Condition / age +2.5/5.0
- Schools +2.2/10.0
- Appreciation +0.0/10.0
$109,999
🖨 Deal sheet (PDF) 📄 Offer letter ✓ Due diligence
Listing remarks MLS
needs work sold as is
Key facts
- 0.25 acre lot
- Built 1920
- Listed 210 days
Neighborhood map
What this means for you Summary
Snapshot
- This is a 3-bed/1.0-bath single-family listed at $110k.
Deal economics
- At list price, monthly cash flow is $783 ($9k/yr) — positive.
- The deal already cash-flows at list — no discount required.
- Meets the 1% rule at list price ($2k rent vs $110k).
- Recommended offer: $97k (12.0% below list) — sets the bar for market timing.
Location & tenants
- Location reads 62/100 on livability (#310 in MD) — a middle-class / working-renter tenant base. Strengths: housing B+, cost of living B; Watch: employment D+, crime D, amenities F.
- Cecil County Public Schools (rural): math 15% / reading 30% proficiency, ranked #15 of 24 in MD (top 62%) — low school quality limits family demand, transient renter base, plan for 1-2y turnover.
- Zoned schools: Chesapeake City Elementary (math 12% / reading 17%, grade F, #477 of 860 statewide, top 59%, 379 students, 45% FRL); Bohemia Manor Middle (math 12% / reading 35%, grade F, #118 of 225 statewide, top 54%, 436 students, 48% FRL); Bohemia Manor High (math 52% / reading 77%, grade B-, #55 of 222 statewide, top 26%, 626 students, 38% FRL).
- Market conditions: 19 active listings in the ZIP; 563 units permitted in Cecil County in 2024 (330 in 5+ unit buildings).
Forward outlook
- Local home prices are declining (-3.0%/yr); year-one equity from $760 of loan paydown is wiped out by about $3k of value loss. Plan a longer hold.
- At projected returns (-3.0% appreciation + 3.0% rent growth), your $31k cash investment doubles in ~4 years — after that, you're playing with house money.
Negotiation context
- It's been on market 210 days — a 12% lower offer ($97k) is reasonable based on typical stale-listing flexibility.
- 2 sale attempts; this cycle's ask has dropped $40k (27%) from the opening price — seller is motivated, your offer sets the floor, not the list.
Risks & watch-outs
- Watch-outs: built in 1920 — expect roof / HVAC / electrical / plumbing capex.
- Climate carrying-cost: major wind risk, 27% chance of damaging wind over 30y; extreme-heat days projected 7→15/yr by 2055 (HVAC capex compounding) — expect insurance premiums to compound above CPI over the hold.
Questions for the listing agent
- It's been on market 210 days. Have you received any prior offers? Is the seller open to a 12% concession, seller financing, or rate buy-down credit?
- Built in 1920 — when were the roof, HVAC, electrical panel, plumbing, and water heater last replaced?
- Why hasn't it sold? Are there any deal-killer items the seller is aware of (foundation, flood, title, zoning, code violations)?
- Is there a deadline driving the sale (1031 exchange, divorce, estate, relocation)? That informs how much negotiation room exists.
- Schools are B-rated — typically a magnet for longer-tenancy family renters. What's the average tenant stay here, and is there a school-zone premium baked into asking?
- Crime grade is D in this area — have there been break-ins, vandalism, or insurance claims at this property in the last 3 years? What carrier currently insures it and at what premium?
- What's the average days-on-market for RENTAL listings here right now (not sales)? A rising rental-DOM trend means longer vacancies and softer asking-rent achievability than the comps imply.
- What's the recent tenant-quality profile in this submarket — average credit score on applications, eviction rate, late-payment / NSF rate, and stable-employment percentage? A property-management company in the area should have these aggregated.
- How much new for-sale + rental construction is in the pipeline within 1–3 miles? Heavy new supply typically softens prices + rents 12–24 months out; constrained supply supports both.
Investment metrics
- 1% rule
- 1.80% ✓
- Cap rate
- 14.84%
- Cash-on-cash
- 30.52%
- DSCR
- 2.36
- GRM
- 4.6
CMA / ARV
- ARV (median comp)
- $230,799
- List price
- $109,999
- Delta
- -52.34%
- Verdict
- UNDERPRICED
- Comps
- 17 within 2.0 mi
Projected returns pro-forma
-3.0% appreciation · 3.0% rent growth · sell at horizon
- IRR
- 25.2%
- Equity multiple
- 2.04×
- Total profit
- $32,102
- Equity at exit
- $16,401
- IRR
- 33.0%
- Equity multiple
- 4.00×
- Total profit
- $92,364
- Equity at exit
- $9,511
Cash invested: $30,800 (down + closing). Projections, not guarantees.
Landlord ↔ Tenant lean methodology
- Overall (STATE)
- 27 Tenant-Leaning
- State Maryland
- 27 Tenant-Leaning · D+14
- County
- — inherits STATE
- City
- — inherits STATE
ZIP-level market 21915
- Home prices YoY
- -27.8%
- Active inventory
- 19
- Price-to-rent
- 4.6×
Monthly cashflow live
- Estimated rent
- $1,982 medium interval (Pro) →
- Mortgage (P&I)
- −$577
- Tax from tax record
- −$160 /mo · $1,916/yr
- Insurance
- −$46
- HOA
- −$0
- Vacancy / Maint / Mgmt
- −$416
- Net cashflow
- $783
Break-even live
Sensitivity live
| Price | -10% $845 | -5% $814 | +0% $783 | +5% $752 | +10% $721 |
|---|---|---|---|---|---|
| Rent | -10% $627 | -5% $705 | +0% $783 | +5% $861 | +10% $940 |
| Rate | -1.0pp $839 | -0.5pp $811 | base $783 | +0.5pp $755 | +1.0pp $726 |
UW: 25.0% down · 7.5% · 30yr · 1.5% tax · 5.0% vac · 8.0% maint · 8.0% mgmt
Financing live
Cash to close
- Down payment
- $27,500
- Closing costs
- $3,300
- Reserves months
- —
- Total cash needed
- —
Loan-product check · same deal, 3 products live
Conventional
25% down · 7.5% · 30yr
- Down + closing
- —
- Monthly P&I
- —
- Monthly cashflow
- —
- DSCR
- —
- Eligible?
- —
Personal DTI + credit; lowest rate.
DSCR
20% down · 8.5% · 30yr
- Down + closing
- —
- Monthly P&I
- —
- Monthly cashflow
- —
- DSCR
- —
- Eligible?
- —
No personal income docs; deal must DSCR.
Hard money
10% down · 12.0% · 12mo
- Down + closing
- —
- Monthly P&I
- —
- Monthly cashflow
- —
- DSCR
- —
- Eligible?
- —
Short-term bridge; refi at stabilization.
Listing history 25 events
-
2026-06-21days on market $109,999 Active 210 DOM
-
2026-06-18days on market $109,999 Active 207 DOM
-
2026-06-17days on market $109,999 Active 206 DOM
-
2026-06-16days on market $109,999 Active 205 DOM
-
2026-06-15pricedays on market $109,999 Active 204 DOM
-
2026-06-13days on market $114,999 Active 202 DOM
-
2026-06-09days on market $114,999 Active 198 DOM
-
2026-06-08days on market $114,999 Active 197 DOM
-
2026-06-07days on market $114,999 Active 196 DOM
-
2026-06-04days on market $114,999 Active 193 DOM
-
2026-06-03days on market $114,999 Active 192 DOM
-
2026-06-02days on market $114,999 Active 191 DOM
-
2026-06-01days on market $114,999 Active 190 DOM
-
2026-05-31days on market $114,999 Active 189 DOM
-
2026-04-13price $119,999 21-char remark
Show marketing remark (21 chars)
needs work sold as is
-
2026-02-11status Active 21-char remark
Show marketing remark (21 chars)
needs work sold as is
-
2026-01-06status Pending 21-char remark
Show marketing remark (21 chars)
needs work sold as is
-
2025-12-30price $122,499 21-char remark
Show marketing remark (21 chars)
needs work sold as is
-
2025-12-15price $124,999 21-char remark
Show marketing remark (21 chars)
needs work sold as is
-
2025-11-21price $129,999 21-char remark
Show marketing remark (21 chars)
needs work sold as is
-
2025-11-07price $139,999 21-char remark
Show marketing remark (21 chars)
needs work sold as is
-
2025-10-17$149,999 Active 21-char remark
Show marketing remark (21 chars)
needs work sold as is
-
2025-10-17historical $149,999 21-char remark
Show marketing remark (21 chars)
needs work sold as is
-
2006-09-21soldstatus $425,000
-
1981-10-01soldstatus $22,500
ⓘ Source: listings_history table (triggers on properties + properties_extension) + one-shot
backfill from property_details.listing_events for pre-trigger history.
Tax reassessment forecast MD · Partial reset (capped growth)
- Current annual tax
- $1,916 · $160/mo
- Projected year-2 tax
- $1,916 · $160/mo
- Expected delta
- $0/yr ($0/mo · 0.0%)
ⓘ Screening estimate from a state-policy table — verify with the county assessor before closing.
Climate risk First Street
- Flood 1/10 Low FEMA zone X (unshaded) · 0% chance over 30 yrs
- Wildfire 4/10 Moderate
- Heat 7/10 Severe 7 d/yr ≥103°F today · 15 d/yr by 30 yrs out
- Wind 6/10 Major 27% chance of damaging wind over 30 yrs
- Air quality 3/10 Moderate 2 unhealthy d/yr today · 4 by 30 yrs out
Nearby sold comps map
Loading sold comps map…
Walkable amenities ~0.75 mi
Loading nearby amenities…
Taxation est. · year 1
- Rental income
- $23,781
- − Mortgage interest
- −$6,162
- − Property taxes
- −$1,916
- − Insurance
- −$550
- − Repairs & maintenance
- −$1,902
- − Management
- −$1,902
- − Depreciation
- −$3,200
- Taxable income
- $8,148
- Est. tax owed @ 24.0%
- −$1,956
- After-tax cash flow
- $7,443/yr
For passive investors: Depreciation is non-cash, so a rental often shows a tax loss while cash-flowing — sheltering income. Rental losses are passive: they offset passive income freely, and up to $25,000/yr can offset ordinary (W-2) income if you actively participate and your MAGI is under $100k (phasing out to $0 by $150k); unused losses carry forward. On sale, claimed depreciation is recaptured at up to 25%, and gains may owe capital-gains tax (a 1031 exchange can defer both). Figures are a year-1 estimate at your 24.0% rate — not tax advice; consult a CPA.
Schools (NCES district)
- District
- Cecil County Public Schools
- NCES district ID
- 2400240
- Math proficiency
- 15% ▼ -21.00%
- Reading proficiency
- 30% ▼ -15.00%
- Median HH income
- $66,544
- Composite
- 21.51/100
- National rank
- #8322
- State rank
- #15 of 24 in MD
Livability — Chesapeake City
- Score
- 62/100
- State rank
- #310
- US rank
- #16238
Category grades
Schools grade is shown separately in the Schools card above.
Census & demographics
- Population (ZIP)
- 2,471
Population outlook (Cecil County) Hauer SSP2
- Today (2025)
- 105,877 people
- By 2030
- 106,905 · +1.0%
- By 2040
- 107,156 · +1.2%
- By 2050
- 104,170 · -1.6%
- By 2075
- 95,771 · -9.5%
- By 2100
- 82,381 · -22.2%
Race, ethnicity, and origin ACS 2023
- Neighborhood character
- Predominantly White (91%)
- Race & ethnicity
- White 91% Hispanic / Latino 6% Two or more races 4% Native American 1%
- Hispanic origin (detail)
- Mexican 5%
- Common ancestry
- Romanian 4% Italian 4% Subsaharan African 2%
- Foreign-born
- 2% · Canada
- Languages at home
- 96% English-only · Spanish 3% Russian/Polish/Slavic 1%
Political lean MEDSL · Cecil
- 2024 margin
- Solid R (+30.9) · D 33.5% · R 64.4% · Other 2.1%
- 2008→2024 swing
- -16.3pp toward R · 2008: -14.6pp · 2024: -30.9pp
- All cycles
- 2024: R+30.9 2020: R+26.6 2016: R+35.3 2012: R+20.4 2008: R+14.6
Not yet ingested
- Civics
- —
Market trends
- HPI YoY
- ▼ -99.99%
- Current HPI
- 259.7117
- Rent YoY
- —
- Metro
- —
- State GDP YoY
- ▲ 2.97%
- F500 in state
- 12
Industry mix (Fortune 500 HQ in MD)
| Industry | F500 HQs | Revenue |
|---|---|---|
| Aerospace / Defense | 1 | $71B |
|
||
| Utilities | 1 | $25B |
|
||
| Hotels | 1 | $24B |
|
||
| Consumer Goods | 1 | $7B |
|
||
| Real Estate | 1 | $6B |
|
||
| Chemicals | 1 | $2B |
|
||
Price history
+433.3% since first listed11 events — show timeline
- 2026-04-13 Price Changed $119,999 BRIGHT MLS
- 2026-02-11 Relisted — BRIGHT MLS
- 2026-01-06 Pending — BRIGHT MLS
- 2025-12-30 Price Changed $122,499 BRIGHT MLS
- 2025-12-15 Price Changed $124,999 BRIGHT MLS
- 2025-11-21 Price Changed $129,999 BRIGHT MLS
- 2025-11-07 Price Changed $139,999 BRIGHT MLS
- 2025-10-17 Listed $149,999 BRIGHT MLS
- 2025-10-17 Coming Soon $149,999 BRIGHT MLS
- 2006-09-21 Sold (Public Records) $425,000 Public Records
- 1981-10-01 Sold (Public Records) $22,500 Public Records
Property tax history
+0.8%/yrLatest (2025): $1,916 · +13.0% YoY. Source: county tax records.
Cash-flow waterfall
monthlySold comps — $/sqft
last 12 mo · ≤1 miLoading sold comps…