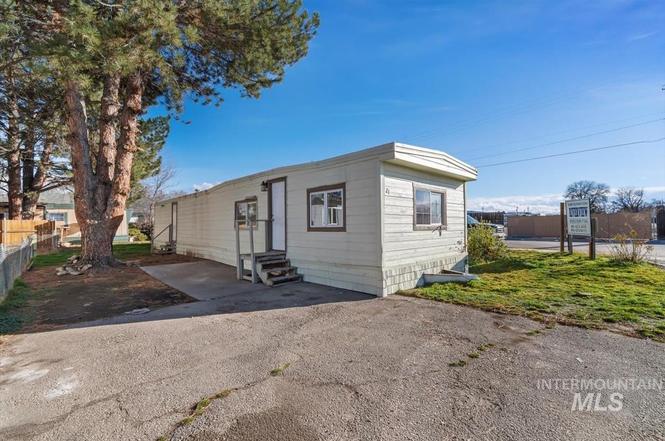
412 E 48th St Trlr 21 · Garden City, ID
Flood risk 2/10 · Minimal
- FEMA flood zone
- AE
- Chance of flooding over 30 yrs
- 0.03%
- Est. flood insurance / yr
- $1,737 – $8,500
Fire risk 4/10 · Minor
- Est. fire insurance / yr
- $584 – $1,086
Heat risk 4/10 · Minor
- Hot days now (above 96°F)
- 7 days/yr
- Hot days in 30 yrs
- 18 days/yr
Wind risk 1/10 · Minimal
- Chance of severe wind over 30 yrs
- —
Air-quality risk 8/10 · Major
- Unhealthy air days now
- 14 days/yr
- Unhealthy air days in 30 yrs
- 19 days/yr
Risk factors via First Street. Map © Google.
Why this score? — see what drove the B- grade
The composite is a weighted blend of 9 inputs, each scored 0–100. Each bar is that input's sub-score; the figure is the points it added to the 100-point composite (weight × sub-score).
- Cash flow +30.0/30.0
- 1% rule +10.0/10.0
- DSCR +10.0/10.0
- ARV discount +4.6/15.0
- Schools +4.2/10.0
- Livability +4.1/5.0
- Rent growth +3.7/5.0
- Condition / age +2.5/5.0
- Appreciation +0.0/10.0
$67,990
🖨 Deal sheet 📄 Offer letter ✓ Due diligence
Listing remarks
Welcome home to this beautifully renovated manufactured home featuring fresh interior and exterior paint, stylish LVP flooring, and a fully remodeled bathroom with a tiled shower and brand-new vanity. The kitchen includes a stainless steel dishwasher and oven range, and the refrigerator, washer, and dryer are included. Situated on a spacious rented lot, this home offers added flexibility as the park allows manufactured homes to be rented—making it a great option for an investment or low-maintenance living. Lot rent is $540/month and includes water, sewer, and trash. Buyer must be approved by River View property management.
Key facts
- Oven range
- Brand-new vanity
- Tiled shower
Tags
Property features AI
Exterior
- Utilities: City water service; Sewer connected
- Home design: Mobile/manufactured home on a rented lot; Single-story
- Construction: Wood siding; Metal roof; Built in 1972
- Exterior features: Located in a mobile home park
Interior
- Kitchen: Dishwasher; Freestanding oven/range; Refrigerator
- Bedrooms: Three bedrooms, all on the main level
- Bathrooms: One bathroom
- Heating & cooling: Forced air heating (natural gas); Wall/window air conditioning units
- Interior features: Main-level living areas
- Laundry & utility: Washer and dryer; Gas water heater
Neighborhood map
What this means for you Summary
Snapshot
- This is a 3-bed/1.0-bath manufactured listed at $68k.
Deal economics
- At list price, monthly cash flow is $674 ($8k/yr) — positive.
- The deal already cash-flows at list — no discount required.
- Meets the 1% rule at list price ($2k rent vs $68k).
- Recommended offer: $60k (12.0% below list) — sets the bar for market timing.
- Cap rate 25.7% vs local median 2.5% in Garden City — top-decile yield for the area; either an underpriced asset or a hidden risk that comps aren't pricing in. Stress-test before assuming the spread holds.
Location & tenants
- Location reads 82/100 on livability (#11 in ID, #1,264 nationally) — a professional / high-income tenant draw. Strengths: commute A+, health & safety A+, housing A; Watch: crime F.
- Boise Independent District (urban): math 42% / reading 56% proficiency, ranked #36 of 92 in ID (top 39%) — families likely to look elsewhere, expect single-tenant / working-renter base with shorter leases.
- Zoned schools: Mountain View Elementary School (math 42% / reading 47%, grade F, #199 of 357 statewide, top 59%, 312 students, 31% FRL); Capital Senior High School (math 34% / reading 57%, grade D-, #59 of 169 statewide, top 35%, 1,220 students, 28% FRL) — zoned schools at 29% FRL track the district average.
- Market conditions: Rents rising fast (+4.9%/yr); 445 active listings in the ZIP; 18 comparable units currently listed for rent nearby; rentals at typical pace (median 19d on market — plan ~3-4 weeks tenant-placement turnaround); solid renter incomes; 5,129 units permitted in Ada County in 2024 (414 in 5+ unit buildings).
Forward outlook
- Local home prices are declining (-3.0%/yr); year-one equity from $470 of loan paydown is wiped out by about $2k of value loss. Plan a longer hold.
- Ada County population projected at +45% by 2050 — long-run rental-demand tailwind backs the buy-and-hold thesis.
- At projected returns (-3.0% appreciation + 4.9% rent growth), your $19k cash investment doubles in ~3 years — after that, you're playing with house money.
Negotiation context
- It's been on market 156 days — a 12% lower offer ($60k) is reasonable based on typical stale-listing flexibility.
Risks & watch-outs
- Watch-outs: flood insurance adds $427/mo.
- Climate carrying-cost: in FEMA flood zone AE (mandatory federal flood insurance) — expect insurance premiums to compound above CPI over the hold.
Questions for the listing agent
- It's been on market 156 days. Have you received any prior offers? Is the seller open to a 12% concession, seller financing, or rate buy-down credit?
- Built in 1972 — when were the roof, HVAC, electrical panel, plumbing, and water heater last replaced?
- What's the actual annual flood-insurance premium (NFIP or private), and is the property in a SFHA with mandatory coverage?
- Why hasn't it sold? Are there any deal-killer items the seller is aware of (foundation, flood, title, zoning, code violations)?
- Is there a deadline driving the sale (1031 exchange, divorce, estate, relocation)? That informs how much negotiation room exists.
- Crime grade is F in this area — have there been break-ins, vandalism, or insurance claims at this property in the last 3 years? What carrier currently insures it and at what premium?
- What's the average days-on-market for RENTAL listings here right now (not sales)? A rising rental-DOM trend means longer vacancies and softer asking-rent achievability than the comps imply.
- What's the recent tenant-quality profile in this submarket — average credit score on applications, eviction rate, late-payment / NSF rate, and stable-employment percentage? A property-management company in the area should have these aggregated.
- How much new for-sale + rental construction is in the pipeline within 1–3 miles? Heavy new supply typically softens prices + rents 12–24 months out; constrained supply supports both.
Investment metrics
- 1% rule
- 2.92% ✓
- Cap rate
- 25.72%
- Cash-on-cash
- 69.39%
- DSCR
- 4.09
- GRM
- 2.8
CMA / ARV
- ARV (on-the-fly)
- $63,840
- Comps found
- 7
Show comp detail 7 sales within ~0.75 mi
| Address | Dist | Beds/Ba | Sqft | Sold | Price | $/sf | Match |
|---|---|---|---|---|---|---|---|
| 4816 Adams St #35 | 0.03mi | 2/1.5 (-1) | 896 (+7%) | 21mo | $65,000 | $73 | 63 |
| 306 E 47th St #14 | 0.22mi | 2/2.0 (-1) | 938 (+12%) | 7mo | $84,000 | $90 | 55 |
| 501 E 44th St #2 | 0.58mi | 2/1.0 (-1) | 840 (0%) | 17mo | $59,900 | $71 | 53 |
| 415 E 44th St #12 | 0.60mi | 3/1.0 | 720 (-14%) | 5mo | $55,000 | $76 | 44 |
| 127 E 44th St. #1 #1 | 0.65mi | 2/2.0 (-1) | 896 (+7%) | 14mo | $99,900 | $111 | 38 |
| 415 E 44th St #14 | 0.60mi | 2/2.0 (-1) | 960 (+14%) | 5mo | $79,900 | $83 | 35 |
| 301 E 45th St #18 | 0.48mi | 2/1.0 (-1) | 728 (-13%) | 24mo | $54,900 | $75 | 30 |
Match score weights: distance 35% · size 25% · config 20% · recency 20%. Top-matched comps best support the ARV.
Projected returns pro-forma
-3.0% appreciation · 4.87% rent growth · sell at horizon
- IRR
- 42.3%
- Equity multiple
- 2.89×
- Total profit
- $36,035
- Equity at exit
- $10,138
- IRR
- 49.7%
- Equity multiple
- 6.47×
- Total profit
- $104,116
- Equity at exit
- $5,879
Cash invested: $19,037 (down + closing). Projections, not guarantees.
Landlord ↔ Tenant lean methodology
- Overall (STATE)
- 91 Strongly Landlord-Friendly
- State Idaho
- 91 Strongly Landlord-Friendly · R+18
- County
- — inherits STATE
- City
- — inherits STATE
ZIP-level market 83714
- Home prices YoY
- -31.5%
- Rents YoY
- 4.9%
- Active inventory
- 445
- Price-to-rent
- 2.8×
Monthly cashflow live
- Estimated rent
- $1,988 high interval (Pro) →
- Mortgage (P&I)
- −$357
- Tax est. 1.5%
- −$85 /mo · $1,020/yr
- Insurance
- −$28
- Flood insurance flood zone
- −$427 /mo · $5,118/yr
- HOA
- −$0
- Vacancy / Maint / Mgmt
- −$418
- Net cashflow
- $674
Break-even live
UW: 25.0% down · 7.5% · 30yr · 1.5% tax · 5.0% vac · 8.0% maint · 8.0% mgmt
Financing live
Cash to close
- Down payment
- $16,998
- Closing costs
- $2,040
- Reserves months
- —
- Total cash needed
- —
Loan-product check · same deal, 3 products live
Conventional
25% down · 7.5% · 30yr
- Down + closing
- —
- Monthly P&I
- —
- Monthly cashflow
- —
- DSCR
- —
- Eligible?
- —
Personal DTI + credit; lowest rate.
DSCR
20% down · 8.5% · 30yr
- Down + closing
- —
- Monthly P&I
- —
- Monthly cashflow
- —
- DSCR
- —
- Eligible?
- —
No personal income docs; deal must DSCR.
Hard money
10% down · 12.0% · 12mo
- Down + closing
- —
- Monthly P&I
- —
- Monthly cashflow
- —
- DSCR
- —
- Eligible?
- —
Short-term bridge; refi at stabilization.
Rent comps 18 comps
| Address | Beds | Baths | Sqft | Rent | $/sqft | DOM | Units | Dist |
|---|---|---|---|---|---|---|---|---|
| 485 E 50th St Garden City, ID | 1.0–2.0 | 1.0–2.0 | 885 | $1,525 | $1.72 | 11d | 1 | 0.30mi |
| 316 E 46th Pl Garden City, ID | 2.0 | 1.0 | 1080 | $2,250 | $2.08 | 23d | 1 | 0.37mi |
| 5216 W Wylie Ln Boise, ID | 3.0 | 1.0 | 915 | $1,995 | $2.18 | 3d | 1 | 0.37mi |
| 3304 N Lakeharbor Ln Boise, ID | 1.0–3.0 | 1.0–2.0 | 1000 | $2,251 | $2.25 | 2d | 16 | 0.61mi |
| 408 E 43rd St Garden City, ID | 2.0–3.0 | 2.0 | 1314 | $3,508 | $2.67 | 3d | 3 | 0.65mi |
| 4315 N Adams St Garden City, ID | 3.0 | 2.0 | 1004 | $2,000 | $1.99 | 23d | 1 | 0.67mi |
| 4220 N Adams St Garden City, ID | 2.0 | 1.0–2.0 | 767 | $2,333 | $3.04 | 2d | 7 | 0.79mi |
| 385 E 42nd St Garden City, ID | 1.0–2.0 | 1.0–2.0 | 832 | $1,495 | $1.80 | 3d | 1 | 0.83mi |
| 3950 N Cambria Way Boise, ID | 2.0 | 1.0 | 863 | $1,695 | $1.96 | 23d | 1 | 0.93mi |
| 521 E 41st St Garden City, ID | 2.0 | 1.0–2.0 | 814 | $5,000 | $6.14 | 23d | 18 | 0.96mi |
| 737 N Stilson Rd Boise, ID | 2.0 | 1.0 | 766 | $1,430 | $1.87 | 3d | 1 | 0.96mi |
| 3894 W Glendale St Boise, ID | 2.0 | 1.0 | 925 | $1,595 | $1.72 | 19d | 1 | 0.96mi |
| 1137 N Arthur Ln Boise, ID | 2.0 | 1.0 | 816 | $1,151 | $1.41 | 23d | 1 | 1.00mi |
| 331 E 40th St Garden City, ID | 2.0 | 2.0 | 678 | $1,875 | $2.77 | 2d | 1 | 1.06mi |
| 6103 W State St Unit 6103-12 Boise, ID | 2.0 | 1.0 | 825 | $1,350 | $1.64 | 23d | 1 | 1.16mi |
| 6043 W Port Pl Unit 104 Boise, ID | 2.0 | 2.0 | 950 | $1,345 | $1.42 | 2d | 1 | 1.20mi |
| 7521 W Tottenham Ln Apt 202 Boise, ID | 3.0 | 2.0 | 1113 | $1,595 | $1.43 | 23d | 1 | 1.23mi |
| 1917 N 33rd St Boise, ID | 2.0 | 1.5 | 988 | $2,600 | $2.63 | 23d | 1 | 1.46mi |
Listing history 8 events
-
2026-06-18days on market $67,990 Active 156 DOM
-
2026-06-17days on market $67,990 Active 155 DOM
-
2026-06-16days on market $67,990 Active 154 DOM
-
2026-06-15days on market $67,990 Active 153 DOM
-
2026-06-13days on market $67,990 Active 151 DOM
-
2026-06-10pricestatusdays on market $67,990 Active 148 DOM
-
2026-03-09price $72,990
-
2025-12-30$79,990 Active
ⓘ Source: listings_history table (triggers on properties + properties_extension) + one-shot
backfill from property_details.listing_events for pre-trigger history.
Climate risk First Street
- Flood 2/10 Low FEMA zone AE · 3% chance over 30 yrs
- Wildfire 4/10 Moderate
- Heat 4/10 Moderate 7 d/yr ≥96°F today · 18 d/yr by 30 yrs out
- Wind 1/10 Low
- Air quality 8/10 Severe 14 unhealthy d/yr today · 19 by 30 yrs out
Nearby sold comps map
Loading sold comps map…
Walkable amenities ~0.75 mi
Loading nearby amenities…
Taxation est. · year 1
- Rental income
- $23,859
- − Mortgage interest
- −$3,808
- − Property taxes
- −$1,020
- − Insurance
- −$5,458
- − Repairs & maintenance
- −$1,909
- − Management
- −$1,909
- − Depreciation
- −$1,978
- Taxable income
- $7,777
- Est. tax owed @ 24.0%
- −$1,867
- After-tax cash flow
- $6,226/yr
For passive investors: Depreciation is non-cash, so a rental often shows a tax loss while cash-flowing — sheltering income. Rental losses are passive: they offset passive income freely, and up to $25,000/yr can offset ordinary (W-2) income if you actively participate and your MAGI is under $100k (phasing out to $0 by $150k); unused losses carry forward. On sale, claimed depreciation is recaptured at up to 25%, and gains may owe capital-gains tax (a 1031 exchange can defer both). Figures are a year-1 estimate at your 24.0% rate — not tax advice; consult a CPA.
Schools (NCES district)
- District
- Boise Independent District
- NCES district ID
- 1600360
- Math proficiency
- 42% ▼ -5.00%
- Reading proficiency
- 56% ▼ -1.00%
- Median HH income
- $49,135
- Composite
- 41.82/100
- National rank
- #3388
- State rank
- #36 of 92 in ID
Livability — Garden City
- Score
- 82/100
- State rank
- #11
- US rank
- #1264
Category grades
Schools grade is shown separately in the Schools card above.
Census & demographics
- Census place
- Garden City, ID
- County
- Ada County · 522,161 people
- Metro
- Boise City, ID
- Population (ZIP)
- 27,564
- Household income
- $87,651
- Rent vs Own
- Severe rent burden
- 557.0
Population outlook (Ada County) Hauer SSP2
- Today (2025)
- 535,818 people
- By 2030
- 585,751 · +9.3%
- By 2040
- 682,435 · +27.4%
- By 2050
- 775,818 · +44.8%
- By 2075
- 994,458 · +85.6%
- By 2100
- 1,148,884 · +114.4%
Race, ethnicity, and origin ACS 2023
- Neighborhood character
- Predominantly White (86%)
- Race & ethnicity
- White 86% Hispanic / Latino 9% Two or more races 7%
- Hispanic origin (detail)
- Mexican 7%
- Common ancestry
- Italian 4% Slovak 4% Portuguese 4%
- Foreign-born
- 5% · Canada
- Languages at home
- 92% English-only · Spanish 5% Russian/Polish/Slavic 2% Other Indo-European 1%
Political lean MEDSL · Ada
- 2024 margin
- R (+10.3) · D 43.4% · R 53.8% · Other 2.8%
- 2008→2024 swing
- -4.2pp toward R · 2008: -6.2pp · 2024: -10.3pp
- All cycles
- 2024: R+10.3 2020: R+3.9 2016: R+9.2 2012: R+11.3 2008: R+6.2
Not yet ingested
- Civics
- —
Market trends
- HPI YoY
- ▼ -155.87%
- Current HPI
- 339.0701
- Rent YoY
- ▲ 4.87%
- Metro
- Boise City, ID
- State GDP YoY
- ▲ 4.51%
- F500 in state
- 6
Industry mix (Fortune 500 HQ in ID)
| Industry | F500 HQs | Revenue |
|---|---|---|
| Retail | 1 | $79B |
|
||
| Technology | 1 | $25B |
|
||
| Food / Agriculture | 1 | $6B |
|
||
Price history
-8.8% since first listed2 events — show timeline
- 2026-03-09 Price Changed $72,990 IMLS
- 2025-12-30 Listed $79,990 IMLS
Cash-flow waterfall
monthlySold comps — $/sqft
last 12 mo · ≤1 miLoading sold comps…