 Duplex
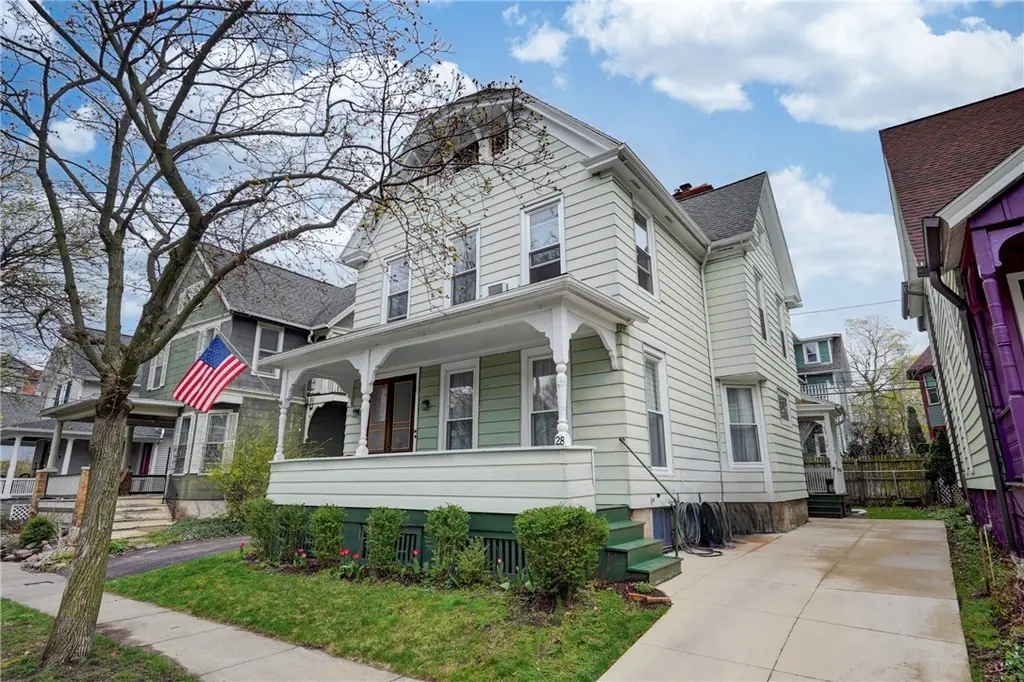
28 Rundel Park · Rochester, NY
Flood risk 1/10 · Minimal
- FEMA flood zone
- X (unshaded)
- Chance of flooding over 30 yrs
- 0.0%
- Est. flood insurance / yr
- $473 – $860
Fire risk 1/10 · Minimal
- Est. fire insurance / yr
- $691 – $1,283
Heat risk 2/10 · Minimal
- Hot days now (above 95°F)
- 7 days/yr
- Hot days in 30 yrs
- 15 days/yr
Wind risk 1/10 · Minimal
- Chance of severe wind over 30 yrs
- —
Air-quality risk 2/10 · Minimal
- Unhealthy air days now
- 1 days/yr
- Unhealthy air days in 30 yrs
- 2 days/yr
Risk factors via First Street. Map © Google.
Why this score? — see what drove the B- grade
The composite is a weighted blend of 9 inputs, each scored 0–100. Each bar is that input's sub-score; the figure is the points it added to the 100-point composite (weight × sub-score).
- Cash flow +28.3/30.0
- DSCR +10.0/10.0
- ARV discount +8.4/15.0
- 1% rule +7.2/10.0
- Livability +3.8/5.0
- Rent growth +3.7/5.0
- Condition / age +2.5/5.0
- Schools +1.9/10.0
- Appreciation +0.0/10.0
$299,900
🖨 Deal sheet 📄 Offer letter ✓ Due diligence
Multi-family units
County records classify this as Multi-Family (2-4 Unit). Listing-text estimate: 2 units. confirmed
Listing remarks
Rarely available two-family in the highly sought-after East Ave/Park Ave area, located on historic Rundell Street with a picturesque, park-like median and green space. This fully rented property offers an excellent opportunity for investors or owner-occupants. Over $50,000 in renovations since 2021 have kept the historic charm of the property while updating living to the modern world. Ideally situated near the George Eastman House, Rochester Museum & Science Center, Strasenburgh Planetarium, and the Strathallan Hotel, all within the vibrant Neighborhood of the Arts. Showings begin Wednesday, April 22nd, 2026, at 10am; All offers due Tuesday, April 28th, 2026, at 12noon.
Key facts
- Green space
- Park-like median
- Renovations
Tags
Property features AI
Finance
- Other: Owner pays snow removal, trash collection, and water; tenants pay all utilities (per lease arrangement); Both units are leased (current rents listed internally)
- Financial info: Property operated as 2-unit building with separate gas and electric meters for each unit; Operating expenses include maintenance (structure), general maintenance, and trash
Exterior
- Parking: One designated parking space
- Utilities: Public water connected; Sewer connected; Electric with circuit breakers
- Home design: Two-story building; Resale property
- Construction: Aluminum siding; Blown-in insulation; Copper plumbing; Block foundation; Shingle roof; Existing (year built details)
- Exterior features: Rectangular residential lot; City street frontage; Lot dimensions approximately 40 x 62
Interior
- Kitchen: Eat-in kitchen(s); Oven/range; Refrigerator
- Bedrooms: One unit with 2 bedrooms; One unit with 1 bedroom
- Flooring: Hardwood; Laminate; Varies
- Bathrooms: Two full bathrooms total (one in each unit)
- Heating & cooling: Gas forced-air heating
- Interior features: Leaded glass windows; Thermal windows; Full basement; Fireplace (1)
- Laundry & utility: Washer; Dryer; Gas water heater
Neighborhood map
What this means for you Summary
Snapshot
- This is a 2 × 3-bed/2.0-bath units multifamily listed at $300k.
Deal economics
- At list price, monthly cash flow is $957 ($11k/yr) — positive. Per door: $479/mo.
- The deal already cash-flows at list — no discount required.
- Meets the 1% rule at list price ($4k rent vs $300k).
Location & tenants
- Location reads 76/100 on livability (#222 in NY, #3,482 nationally) — a middle-class / working-renter tenant base. Strengths: commute A+, cost of living A+, housing A+; Watch: schools D+, crime F, employment F.
- Rochester City School District (urban): math 21% / reading 26% proficiency, ranked #589 of 590 in NY (top 100%) — low school quality limits family demand, transient renter base, plan for 1-2y turnover; 82% free/reduced lunch — lower-income household profile, screen leases tightly.
- Market conditions: Rents rising fast (+4.6%/yr); 56 active listings in the ZIP; 23 comparable units currently listed for rent nearby; rentals at typical pace (median 15d on market — plan ~3-4 weeks tenant-placement turnaround); 1,169 units permitted in Monroe County in 2024 (591 in 5+ unit buildings).
- At $3,651/mo this rent would consume 73% of the median local household income ($60k/yr) (locally 2034% of renters already pay >50% of income on rent) — very limited rent-growth headroom before tenants either downsize or default.
Forward outlook
- Local home prices are declining (-3.0%/yr); year-one equity from $2k of loan paydown is wiped out by about $9k of value loss. Plan a longer hold.
- Monroe County population projected to shrink 6% by 2050 — rents likely to lag national; underwrite the cash flow, not the appreciation.
- At projected returns (-3.0% appreciation + 4.6% rent growth), your $84k cash investment doubles in ~8 years — after that, you're playing with house money.
Negotiation context
- Only 2 days on market — expect competitive offers; lowballing is unlikely to land.
- 2 sale attempts with the ask held roughly flat each time — persistent listings suggest the price (not the market) is what's stuck; bring a comps-based counter.
Risks & watch-outs
- Watch-outs: built in 1900 — expect roof / HVAC / electrical / plumbing capex.
Questions for the listing agent
- Can we see the unit-by-unit rent roll, current vacancy, and any below-market leases? What's the average tenancy length?
- What capital expenditures (roof, boiler, parking lot, exteriors) have been made in the last 5 years, and what's planned in the next 2?
- Built in 1900 — when were the roof, HVAC, electrical panel, plumbing, and water heater last replaced?
- Is there a deadline driving the sale (1031 exchange, divorce, estate, relocation)? That informs how much negotiation room exists.
- Schools are D-rated, which usually means shorter tenancies and higher turnover. Who's the typical renter profile here, and what's been the actual vacancy rate?
- Crime grade is F in this area — have there been break-ins, vandalism, or insurance claims at this property in the last 3 years? What carrier currently insures it and at what premium?
- What's the average days-on-market for RENTAL listings here right now (not sales)? A rising rental-DOM trend means longer vacancies and softer asking-rent achievability than the comps imply.
- What's the recent tenant-quality profile in this submarket — average credit score on applications, eviction rate, late-payment / NSF rate, and stable-employment percentage? A property-management company in the area should have these aggregated.
- How much new apartment / multifamily construction is in the pipeline within 1–3 miles? Heavy new supply (>2% of stock underway) typically softens rents 12–24 months out; light construction supports rent growth.
Investment metrics
- 1% rule
- 1.22% ✓
- Cap rate
- 10.12%
- Cash-on-cash
- 13.68%
- DSCR
- 1.61
- GRM
- 6.8
CMA / ARV
- ARV (on-the-fly)
- $305,808
- Comps found
- 9
Show comp detail 9 sales within ~0.75 mi
| Address | Dist | Beds/Ba | Sqft | Sold | Price | $/sf | Match |
|---|---|---|---|---|---|---|---|
| 646 University Ave | 0.09mi | 3/3.0 | 2,392 (+8%) | 10mo | $455,000 | $190 | 70 |
| 3 Norwood St | 0.23mi | 4/2.0 (+1) | 1,992 (-10%) | 3mo | $392,000 | $197 | 65 |
| 199 Merriman St | 0.14mi | 4/2.0 (+1) | 2,050 (-8%) | 16mo | $282,500 | $138 | 62 |
| 20 Arlington St | 0.15mi | 2/2.0 (-1) | 2,456 (+11%) | 16mo | $285,000 | $116 | 56 |
| 39 Brighton St | 0.55mi | 4/2.0 (+1) | 2,372 (+7%) | 22mo | $350,000 | $148 | 39 |
| 34 Canfield Pl | 0.66mi | 4/3.0 (+1) | 2,250 (+2%) | 23mo | $295,000 | $131 | 38 |
| 23 Richmond St | 0.72mi | 3/3.0 | 2,388 (+8%) | 17mo | $330,000 | $138 | 35 |
| 49 Rowley St | 0.67mi | 4/2.0 (+1) | 2,432 (+10%) | 18mo | $325,000 | $134 | 32 |
| 154 Breck St | 0.62mi | 4/3.0 (+1) | 1,974 (-11%) | 16mo | $210,000 | $106 | 30 |
Match score weights: distance 35% · size 25% · config 20% · recency 20%. Top-matched comps best support the ARV.
Projected returns pro-forma
-3.0% appreciation · 4.6% rent growth · sell at horizon
- IRR
- 5.5%
- Equity multiple
- 1.22×
- Total profit
- $18,321
- Equity at exit
- $44,716
- IRR
- 16.3%
- Equity multiple
- 2.42×
- Total profit
- $119,653
- Equity at exit
- $25,930
Cash invested: $83,972 (down + closing). Projections, not guarantees.
Landlord ↔ Tenant lean methodology
- Overall (STATE)
- 15 Strongly Tenant-Friendly
- State New York
- 15 Strongly Tenant-Friendly · D+10
- County
- — inherits STATE
- City
- — inherits STATE
ZIP-level market 14607
- Home prices YoY
- -10.7%
- Rents YoY
- 4.6%
- Active inventory
- 56
- Price-to-rent
- 13.7×
Monthly cashflow live
- Estimated rent
- $3,651 high interval (Pro) →
- Mortgage (P&I)
- −$1,573
- Tax from tax record
- −$229 /mo · $2,750/yr
- Insurance
- −$125
- HOA
- −$0
- Vacancy / Maint / Mgmt
- −$767
- Net cashflow
- $957
Break-even live
2-unit breakdown (identical units grouped — click to expand)
| Units | Beds | Baths | Est. rent |
|---|---|---|---|
| 2× units | 3 | 2 | $3,650 |
| #1 | 3 | 2 | $1,825 |
| #2 | 3 | 2 | $1,825 |
| Total (2 units) | $3,651 | ||
UW: 25.0% down · 7.5% · 30yr · 1.5% tax · 5.0% vac · 8.0% maint · 8.0% mgmt
Financing live
Cash to close
- Down payment
- $74,975
- Closing costs
- $8,997
- Reserves months
- —
- Total cash needed
- —
Loan-product check · same deal, 3 products live
Conventional
25% down · 7.5% · 30yr
- Down + closing
- —
- Monthly P&I
- —
- Monthly cashflow
- —
- DSCR
- —
- Eligible?
- —
Personal DTI + credit; lowest rate.
DSCR
20% down · 8.5% · 30yr
- Down + closing
- —
- Monthly P&I
- —
- Monthly cashflow
- —
- DSCR
- —
- Eligible?
- —
No personal income docs; deal must DSCR.
Hard money
10% down · 12.0% · 12mo
- Down + closing
- —
- Monthly P&I
- —
- Monthly cashflow
- —
- DSCR
- —
- Eligible?
- —
Short-term bridge; refi at stabilization.
Rent comps 23 comps
| Address | Beds | Baths | Sqft | Rent | $/sqft | DOM | Units | Dist |
|---|---|---|---|---|---|---|---|---|
| 733 University Ave #3 Rochester, NY | 3.0 | 1.5 | 1400 | $1,850 | $1.32 | 43d | 1 | 0.04mi |
| 15 Vick Park B Unit A Rochester, NY | 2.0 | 1.5 | 1616 | $2,350 | $1.45 | 23d | 1 | 0.28mi |
| 933 University Ave Rochester, NY | 1.0–2.0 | 1.0–2.0 | 1295 | $3,815 | $2.94 | 2d | 12 | 0.31mi |
| 256 Oxford St Unit 1 Rochester, NY | 3.0 | 1.0 | 2050 | $3,000 | $1.46 | 14d | 1 | 0.34mi |
| 260 Oxford St Unit UP Rochester, NY | 2.0 | 1.0 | 1850 | $2,600 | $1.41 | 43d | 1 | 0.35mi |
| 209 S Goodman St Rochester, NY | 2.0 | 2.0 | 1500 | $1,700 | $1.13 | 43d | 1 | 0.51mi |
| 500 Oxford St #1 Rochester, NY | 2.0 | 2.0 | 1400 | $1,800 | $1.29 | 43d | 1 | 0.70mi |
| 1 Champeney Ter Rochester, NY | 3.0 | 1.0 | 1936 | $1,650 | $0.85 | 14d | 1 | 0.70mi |
| 36 Morningside Park Rochester, NY | 4.0 | 1.0 | 1446 | $2,400 | $1.66 | 3d | 1 | 0.72mi |
| 214 Culver Rd Apt 2 Rochester, NY | 3.0 | 1.0 | 1700 | $2,400 | $1.41 | 14d | 1 | 0.84mi |
| 126 Parsells Ave Rochester, NY | 3.0 | 1.0 | 1574 | $1,800 | $1.14 | 21d | 1 | 0.86mi |
| 126 Parsells Ave Rochester, NY | 3.0 | 1.0 | 1574 | $1,800 | $1.14 | 43d | 1 | 0.86mi |
| 42 Wilcox St Rochester, NY | 3.0 | 1.0 | 2184 | $1,695 | $0.78 | 44d | 1 | 0.87mi |
| 195 Parsells Ave Rochester, NY | 4.0 | 1.0 | 1413 | $1,265 | $0.90 | 3d | 1 | 0.89mi |
| 57 Calumet St Rochester, NY | 3.0 | 3.0 | 2500 | $2,250 | $0.90 | 14d | 1 | 0.96mi |
| 507 Meigs St Rochester, NY | 3.0 | 1.0 | 1577 | $1,650 | $1.05 | 43d | 1 | 0.97mi |
| 34 Shepard St Rochester, NY | 4.0 | 1.5 | 2347 | $800 | $0.34 | 43d | 1 | 1.05mi |
| 14 Franklin St Rochester, NY | 2.0 | 1.0–2.0 | 1345 | $3,477 | $2.59 | 3d | 8 | 1.06mi |
| 260 E Main St Rochester, NY | 3.0 | 1.0–2.0 | 1144 | $2,999 | $2.62 | 3d | 14 | 1.10mi |
| 183 E Main St Rochester, NY | 1.0–2.0 | 1.0 | 1142 | $2,870 | $2.51 | 10d | 28 | 1.17mi |
| 1600 East Ave Rochester, NY | 3.0 | 1.0–2.0 | 944 | $2,875 | $3.04 | 2d | 1 | 1.28mi |
| 80 St Paul St Rochester, NY | 1.0–2.0 | 1.5–2.5 | 1024 | $1,935 | $1.89 | 3d | 3 | 1.30mi |
| 39 State St Rochester, NY | 1.0–2.0 | 1.0–2.5 | 1154 | $3,500 | $3.03 | 3d | 8 | 1.50mi |
Listing history 6 events
-
2026-06-18days on market $299,900 Active 2 DOM
-
2026-06-16statusdays on market $299,900 Active 1 DOM
-
2026-04-30status Pending
-
2026-04-21$299,900 Active
-
2026-02-11historical
-
2025-12-03$389,900 Active
ⓘ Source: listings_history table (triggers on properties + properties_extension) + one-shot
backfill from property_details.listing_events for pre-trigger history.
Tax reassessment forecast NY · Partial reset (capped growth)
- Current annual tax
- $2,750 · $229/mo
- Projected year-2 tax
- $3,909 · $326/mo
- Expected delta
- +$1,159/yr (+$97/mo · 42.2%)
ⓘ Screening estimate from a state-policy table — verify with the county assessor before closing.
Climate risk First Street
- Flood 1/10 Low FEMA zone X (unshaded) · 0% chance over 30 yrs
- Wildfire 1/10 Low
- Heat 2/10 Low 7 d/yr ≥95°F today · 15 d/yr by 30 yrs out
- Wind 1/10 Low
- Air quality 2/10 Low 1 unhealthy d/yr today · 2 by 30 yrs out
Nearby sold comps map
Loading sold comps map…
Walkable amenities ~0.75 mi
Loading nearby amenities…
Taxation est. · year 1
- Rental income
- $43,812
- − Mortgage interest
- −$16,799
- − Property taxes
- −$2,750
- − Insurance
- −$1,500
- − Repairs & maintenance
- −$3,505
- − Management
- −$3,505
- − Depreciation
- −$8,724
- Taxable income
- $7,029
- Est. tax owed @ 24.0%
- −$1,687
- After-tax cash flow
- $9,803/yr
For passive investors: Depreciation is non-cash, so a rental often shows a tax loss while cash-flowing — sheltering income. Rental losses are passive: they offset passive income freely, and up to $25,000/yr can offset ordinary (W-2) income if you actively participate and your MAGI is under $100k (phasing out to $0 by $150k); unused losses carry forward. On sale, claimed depreciation is recaptured at up to 25%, and gains may owe capital-gains tax (a 1031 exchange can defer both). Figures are a year-1 estimate at your 24.0% rate — not tax advice; consult a CPA.
Schools (NCES district)
- District
- Rochester City School District
- NCES district ID
- 3624750
- Math proficiency
- 21% ▬ 0.00%
- Reading proficiency
- 26% ▲ 4.00%
- Median HH income
- $30,923
- Composite
- 18.98/100
- National rank
- #8850
- State rank
- #589 of 590 in NY
Livability — Rochester
- Score
- 76/100
- State rank
- #222
- US rank
- #3482
Category grades
Schools grade is shown separately in the Schools card above.
Census & demographics
- Census place
- Rochester, NY
- County
- Monroe County · 674,131 people
- City population
- 432,803
- Metro
- Rochester, NY
- Population (ZIP)
- 17,891
- Household income
- $59,787
- Rent vs Own
- Severe rent burden
- 2034.0
Population outlook (Monroe County) Hauer SSP2
- Today (2025)
- 759,460 people
- By 2030
- 757,154 · -0.3%
- By 2040
- 740,644 · -2.5%
- By 2050
- 714,443 · -5.9%
- By 2075
- 645,883 · -15.0%
- By 2100
- 547,084 · -28.0%
Race, ethnicity, and origin ACS 2023
- Neighborhood character
- Predominantly White (78%)
- Race & ethnicity
- White 78% Black 8% Two or more races 7% Hispanic / Latino 6% Asian 2%
- Hispanic origin (detail)
- Puerto Rican 2%
- Common ancestry
- Romanian 5% Slovak 4% Scotch-Irish 2%
- Foreign-born
- 7% · Canada, South Korea
- Languages at home
- 90% English-only · Spanish 5% Other Indo-European 1% Russian/Polish/Slavic 1%
Political lean MEDSL · Monroe
- 2024 margin
- D (+19.1) · D 59.5% · R 40.5%
- 2008→2024 swing
- +1.4pp toward D · 2008: 17.7pp · 2024: 19.1pp
- All cycles
- 2024: D+19.1 2020: D+21.0 2016: D+14.1 2012: D+17.4 2008: D+17.7
Not yet ingested
- Civics
- —
Market trends
- HPI YoY
- ▼ -35.72%
- Current HPI
- 297.8107
- Rent YoY
- ▲ 4.60%
- Metro
- Rochester, NY
- State GDP YoY
- ▲ 2.60%
- F500 in state
- 92
Industry mix (Fortune 500 HQ in NY)
| Industry | F500 HQs | Revenue |
|---|---|---|
| Financial Services | 10 | $950B |
|
||
| Consumer Goods | 9 | $162B |
|
||
| Insurance | 4 | $225B |
|
||
| Telecommunications | 2 | $144B |
|
||
| Pharmaceuticals | 2 | $112B |
|
||
| Media / Entertainment | 2 | $69B |
|
||
Price history
-23.1% since first listed4 events — show timeline
- 2026-04-30 Pending — UNYREIS
- 2026-04-21 Listed $299,900 UNYREIS
- 2026-02-11 Listing Removed — UNYREIS
- 2025-12-03 Listed $389,900 UNYREIS
Property tax history
+3.8%/yrLatest (2025): $2,750 · +0.0% YoY. Source: county tax records.
Cash-flow waterfall
monthlySold comps — $/sqft
last 12 mo · ≤1 miLoading sold comps…