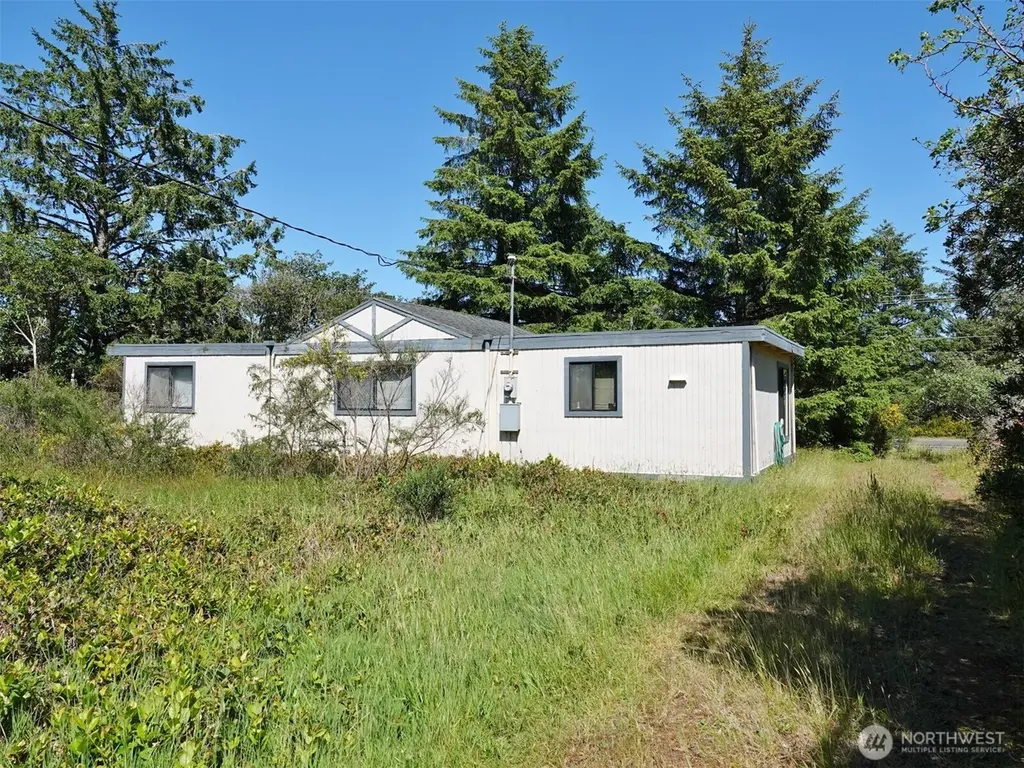
307 Pt Brown Ave SW · Ocean Shores, WA
Flood risk 1/10 · Minimal
- FEMA flood zone
- X (unshaded)
- Chance of flooding over 30 yrs
- 0.0%
- Est. flood insurance / yr
- $507 – $1,088
Fire risk 3/10 · Minor
- Est. fire insurance / yr
- $604 – $1,122
Heat risk 1/10 · Minimal
- Hot days now (above 72°F)
- 7 days/yr
- Hot days in 30 yrs
- 17 days/yr
Wind risk 1/10 · Minimal
- Chance of severe wind over 30 yrs
- —
Air-quality risk 5/10 · Moderate
- Unhealthy air days now
- 6 days/yr
- Unhealthy air days in 30 yrs
- 6 days/yr
Risk factors via First Street. Map © Google.
Why this score? — see what drove the C+ grade
The composite is a weighted blend of 9 inputs, each scored 0–100. Each bar is that input's sub-score; the figure is the points it added to the 100-point composite (weight × sub-score).
- Cash flow +28.4/30.0
- DSCR +10.0/10.0
- ARV discount +7.5/15.0
- 1% rule +7.2/10.0
- Schools +3.4/10.0
- Livability +3.1/5.0
- Rent growth +2.5/5.0
- Condition / age +2.5/5.0
- Appreciation +0.0/10.0
$149,000
🖨 Deal sheet 📄 Offer letter ✓ Due diligence
Listing remarks
FIXER INVESTMENT OPPORTUNITY! Classic Wood Ceilings through-out this 2 BD, 1 BA, 928 sq. ft. 1-story home. Enter into the Bonus Room with vaulted ceiling. Separate Living Room and Kitchen area. This property fronts both Pt Brown Ave and Dorado St, and has a pull-thru driveway from both streets. Fix-up this home and enjoy living by the Beach. City water and sewer. In the Community Club. Estate Sale ~ No Form 17. SOLD "AS IS" ~ CASH ONLY. Buyer to verify all information. Offer Review Date is June 10th (or sooner).
Key facts
- Pull-thru driveway
- Vaulted ceiling
- Bonus room
Tags
Property features AI
Finance
- Financial info: Listing terms: Cash
- HOA & community: Has HOA: Ocean Shores Community Club; Annual association fee $215 (includes: see remarks)
Exterior
- Parking: Driveway
- Utilities: Public water (City of Ocean Shores); Sewer connected (City of Ocean Shores); Electric power (GH PUD); Electric energy source; Electric water heater
- Home design: Single-family residence; One story; Main level entry; Built on lot; Has view; Fixer condition
- Construction: Wood construction; Composition and flat roof; Pillar/Post/Pier foundation; Effective year built 1968; House structure
- Exterior features: Wood exterior; Wood products; Deck; Level topography; Brush vegetation; Paved lot features
Interior
- Kitchen: Refrigerator; Stove/Range
- Bedrooms: 2 bedrooms (both on the main level)
- Flooring: See remarks
- Bathrooms: 1 full bathroom with bathtub and shower
- Heating & cooling: Baseboard heating; Wall furnace; No cooling
- Interior features: Ceiling fan(s); Vaulted ceiling(s); Water heater located in kitchen
- Laundry & utility: Water heater (electric) in kitchen
Neighborhood map
What this means for you Summary
Snapshot
- This is a 2-bed/1.0-bath single-family listed at $149k.
Deal economics
- At list price, monthly cash flow is $483 ($6k/yr) — positive.
- The deal already cash-flows at list — no discount required.
- Meets the 1% rule at list price ($2k rent vs $149k).
- Recommended offer: $147k (1.5% below list) — sets the bar for market timing.
- Cap rate 10.2% vs local median 3.1% in Ocean Shores — top-decile yield for the area; either an underpriced asset or a hidden risk that comps aren't pricing in. Stress-test before assuming the spread holds.
Location & tenants
- Location reads 62/100 on livability (#424 in WA) — a middle-class / working-renter tenant base. Strengths: housing A; Watch: schools C-, crime C-, health & safety C-.
- North Beach School District (rural): math 32% / reading 44% proficiency, ranked #236 of 291 in WA (top 81%) — families likely to look elsewhere, expect single-tenant / working-renter base with shorter leases; 63% free/reduced lunch — lower-income household profile, screen leases tightly.
- Market conditions: 653 active listings in the ZIP; 2 comparable units currently listed for rent nearby; 297 units permitted in Grays Harbor County in 2024 (17 in 5+ unit buildings).
- This rent runs 38% of the median local income ($58k/yr) — at the standard rent-burdened threshold; future hikes will face affordability resistance.
Forward outlook
- Local home prices are declining (-3.0%/yr); year-one equity from $1k of loan paydown is wiped out by about $4k of value loss. Plan a longer hold.
- Grays Harbor County population projected at -24% by 2050 — secular population decline; favor cash flow + early exit over multi-decade hold.
- At projected returns (-3.0% appreciation + 3.0% rent growth), your $42k cash investment doubles in ~9 years — after that, you're playing with house money.
Negotiation context
- It's been on market 16 days — a 2% lower offer ($147k) is reasonable based on typical stale-listing flexibility.
Questions for the listing agent
- Built in 1968 — when were the roof, HVAC, electrical panel, plumbing, and water heater last replaced?
- What does the HOA fee cover, when was the last increase, and are there any pending special assessments or reserve-fund shortfalls?
- Is there a deadline driving the sale (1031 exchange, divorce, estate, relocation)? That informs how much negotiation room exists.
- What's the average days-on-market for RENTAL listings here right now (not sales)? A rising rental-DOM trend means longer vacancies and softer asking-rent achievability than the comps imply.
- What's the recent tenant-quality profile in this submarket — average credit score on applications, eviction rate, late-payment / NSF rate, and stable-employment percentage? A property-management company in the area should have these aggregated.
- How much new for-sale + rental construction is in the pipeline within 1–3 miles? Heavy new supply typically softens prices + rents 12–24 months out; constrained supply supports both.
Investment metrics
- 1% rule
- 1.22% ✓
- Cap rate
- 10.19%
- Cash-on-cash
- 13.90%
- DSCR
- 1.62
- GRM
- 6.8
CMA / ARV
- ARV (on-the-fly)
- $309,024
- Comps found
- 12
Show comp detail 12 sales within ~0.75 mi
| Address | Dist | Beds/Ba | Sqft | Sold | Price | $/sf | Match |
|---|---|---|---|---|---|---|---|
| 167 Polaris Blvd SW | 0.18mi | 2/1.0 | 962 (+4%) | 2mo | $300,000 | $312 | 84 |
| 335 Dorado Ave SW | 0.06mi | 2/1.0 | 880 (-5%) | 12mo | $300,000 | $341 | 79 |
| 406 SW Ocean Shores Blvd | 0.37mi | 2/1.0 | 952 (+3%) | 7mo | $150,001 | $158 | 73 |
| 345 Mount Olympus Ave SE | 0.25mi | 2/1.0 | 834 (-10%) | 4mo | $265,000 | $318 | 68 |
| 120 Auriga Ave SW | 0.36mi | 2/2.0 | 962 (+4%) | 8mo | $319,900 | $333 | 66 |
| 435 Lotloh St SE | 0.39mi | 1/1.0 (-1) | 996 (+7%) | 10mo | $255,000 | $256 | 56 |
| 125 Ocean Shores Blvd SW | 0.41mi | 2/2.0 | 1,008 (+9%) | 9mo | $329,000 | $326 | 55 |
| 121 Tahola St SE | 0.66mi | 2/1.0 | 960 (+3%) | 10mo | $330,000 | $344 | 55 |
| 127 Point Brown Ave NW | 0.46mi | 2/1.0 | 813 (-12%) | 10mo | $312,000 | $384 | 49 |
| 156 Dolphin Ave NE | 0.69mi | 2/1.0 | 821 (-12%) | 6mo | $389,000 | $474 | 44 |
| 254 Wishkah St SW | 0.62mi | 3/2.0 (+1) | 1,008 (+9%) | 10mo | $315,000 | $313 | 40 |
| 542 Ocean Shores Blvd SW | 0.68mi | 2/1.0 | 816 (-12%) | 15mo | $425,000 | $521 | 35 |
Match score weights: distance 35% · size 25% · config 20% · recency 20%. Top-matched comps best support the ARV.
Projected returns pro-forma
-3.0% appreciation · 3.0% rent growth · sell at horizon
- IRR
- 4.1%
- Equity multiple
- 1.16×
- Total profit
- $6,621
- Equity at exit
- $22,216
- IRR
- 13.6%
- Equity multiple
- 2.09×
- Total profit
- $45,334
- Equity at exit
- $12,883
Cash invested: $41,720 (down + closing). Projections, not guarantees.
Landlord ↔ Tenant lean methodology
- Overall (STATE)
- 28 Tenant-Leaning
- State Washington
- 28 Tenant-Leaning · D+8
- County
- — inherits STATE
- City
- — inherits STATE
ZIP-level market 98569
- Home prices YoY
- -3.4%
- Active inventory
- 653
- Price-to-rent
- 6.8×
Monthly cashflow live
- Estimated rent
- $1,825 medium interval (Pro) →
- Mortgage (P&I)
- −$781
- Tax from tax record
- −$97 /mo · $1,159/yr
- Insurance
- −$62
- HOA
- −$18
- Vacancy / Maint / Mgmt
- −$383
- Net cashflow
- $483
Break-even live
UW: 25.0% down · 7.5% · 30yr · 1.5% tax · 5.0% vac · 8.0% maint · 8.0% mgmt
Financing live
Cash to close
- Down payment
- $37,250
- Closing costs
- $4,470
- Reserves months
- —
- Total cash needed
- —
Loan-product check · same deal, 3 products live
Conventional
25% down · 7.5% · 30yr
- Down + closing
- —
- Monthly P&I
- —
- Monthly cashflow
- —
- DSCR
- —
- Eligible?
- —
Personal DTI + credit; lowest rate.
DSCR
20% down · 8.5% · 30yr
- Down + closing
- —
- Monthly P&I
- —
- Monthly cashflow
- —
- DSCR
- —
- Eligible?
- —
No personal income docs; deal must DSCR.
Hard money
10% down · 12.0% · 12mo
- Down + closing
- —
- Monthly P&I
- —
- Monthly cashflow
- —
- DSCR
- —
- Eligible?
- —
Short-term bridge; refi at stabilization.
Rent comps 2 comps
| Address | Beds | Baths | Sqft | Rent | $/sqft | DOM | Units | Dist |
|---|---|---|---|---|---|---|---|---|
| 230 Point Brown Ave SE Ocean Shores, WA | 2.0 | 1.0 | 840 | $2,100 | $2.50 | 43d | 1 | 0.13mi |
| 569 Sunset Ave NE Unit A Ocean Shores, WA | 2.0 | 1.5 | 1001 | $1,500 | $1.50 | 43d | 1 | 1.47mi |
HOA detail
- Monthly dues
- $18 · $216/yr
- Likely covers
- watersewer
Listing history 12 events
-
2026-06-19days on market $149,000 Active 16 DOM
-
2026-06-18days on market $149,000 Active 15 DOM
-
2026-06-17days on market $149,000 Active 14 DOM
-
2026-06-16days on market $149,000 Active 13 DOM
-
2026-06-15days on market $149,000 Active 12 DOM
-
2026-06-14days on market $149,000 Active 10 DOM
-
2026-06-12days on market $149,000 Active 9 DOM
-
2026-06-09days on market $149,000 Active 6 DOM
-
2026-06-08days on market $149,000 Active 5 DOM
-
2026-06-07days on market $149,000 Active 4 DOM
-
2026-06-05remarks 517-char remark
-
2026-06-05$149,000 Active 1 DOM
ⓘ Source: listings_history table (triggers on properties + properties_extension) + one-shot
backfill from property_details.listing_events for pre-trigger history.
Tax reassessment forecast WA · Resets to sale price
- Current annual tax
- $1,159 · $97/mo
- Projected year-2 tax
- $1,460 · $122/mo
- Expected delta
- +$301/yr (+$25/mo · 25.9%)
ⓘ Screening estimate from a state-policy table — verify with the county assessor before closing.
Climate risk First Street
- Flood 1/10 Low FEMA zone X (unshaded) · 0% chance over 30 yrs
- Wildfire 3/10 Moderate
- Heat 1/10 Low 7 d/yr ≥72°F today · 17 d/yr by 30 yrs out
- Wind 1/10 Low
- Air quality 5/10 Major 6 unhealthy d/yr today · 6 by 30 yrs out
Nearby sold comps map
Loading sold comps map…
Walkable amenities ~0.75 mi
Loading nearby amenities…
Taxation est. · year 1
- Rental income
- $21,894
- − Mortgage interest
- −$8,346
- − Property taxes
- −$1,159
- − Insurance
- −$745
- − Repairs & maintenance
- −$1,752
- − Management
- −$1,752
- − HOA
- −$216
- − Depreciation
- −$4,335
- Taxable income
- $3,590
- Est. tax owed @ 24.0%
- −$862
- After-tax cash flow
- $4,938/yr
For passive investors: Depreciation is non-cash, so a rental often shows a tax loss while cash-flowing — sheltering income. Rental losses are passive: they offset passive income freely, and up to $25,000/yr can offset ordinary (W-2) income if you actively participate and your MAGI is under $100k (phasing out to $0 by $150k); unused losses carry forward. On sale, claimed depreciation is recaptured at up to 25%, and gains may owe capital-gains tax (a 1031 exchange can defer both). Figures are a year-1 estimate at your 24.0% rate — not tax advice; consult a CPA.
Schools (NCES district)
- District
- North Beach School District
- NCES district ID
- 5305700
- Math proficiency
- 32% ▼ -4.00%
- Reading proficiency
- 44% ▬ 0.00%
- Median HH income
- $40,966
- Composite
- 34.46/100
- National rank
- #10153
- State rank
- #236 of 291 in WA
Livability — Ocean Shores
- Score
- 62/100
- State rank
- #424
- US rank
- #16852
Category grades
Schools grade is shown separately in the Schools card above.
Census & demographics
- Census place
- Ocean Shores, WA
- County
- Grays Harbor County · 44,693 people
- City population
- 7,187
- Metro
- Aberdeen, WA
- Population (ZIP)
- 7,489
- Household income
- $58,378
- Rent vs Own
- Severe rent burden
- 172.0
Population outlook (Grays Harbor County) Hauer SSP2
- Today (2025)
- 66,443 people
- By 2030
- 63,255 · -4.8%
- By 2040
- 56,466 · -15.0%
- By 2050
- 50,516 · -24.0%
- By 2075
- 39,296 · -40.9%
- By 2100
- 31,142 · -53.1%
Race, ethnicity, and origin ACS 2023
- Neighborhood character
- Predominantly White (86%)
- Race & ethnicity
- White 86% Two or more races 5% Hispanic / Latino 4% Asian 3% Native American 3%
- Common ancestry
- Portuguese 8% Iranian 5% Lithuanian 4%
- Foreign-born
- 5% · Canada
- Languages at home
- 92% English-only · Spanish 3% Tagalog/Filipino 2% German/W. Germanic 2%
Political lean MEDSL · Grays Harbor
- 2024 margin
- Lean R (+6.0) · D 45.6% · R 51.6% · Other 2.8%
- 2008→2024 swing
- -20.6pp toward R · 2008: 14.6pp · 2024: -6.0pp
- All cycles
- 2024: R+6.0 2020: R+6.6 2016: R+7.1 2012: D+14.0 2008: D+14.6
Not yet ingested
- Civics
- —
Market trends
- HPI YoY
- ▼ -13.33%
- Current HPI
- 380.05
- Rent YoY
- —
- Metro
- Aberdeen, WA
- State GDP YoY
- ▲ 4.65%
- F500 in state
- 22
Industry mix (Fortune 500 HQ in WA)
| Industry | F500 HQs | Revenue |
|---|---|---|
| Retail | 2 | $269B |
|
||
| Technology / Retail | 1 | $638B |
|
||
| Technology | 1 | $245B |
|
||
| Telecommunications | 1 | $38B |
|
||
| Food / Beverage | 1 | $36B |
|
||
| Automotive / Trucks | 1 | $34B |
|
||
Price history
1 event — show timeline
- 2026-06-03 Listed $149,000 NWMLS as Distributed by MLS Grid
Property tax history
+2.4%/yrLatest (2026): $1,159 · +2.3% YoY. Source: county tax records.
Cash-flow waterfall
monthlySold comps — $/sqft
last 12 mo · ≤1 miLoading sold comps…