 Duplex
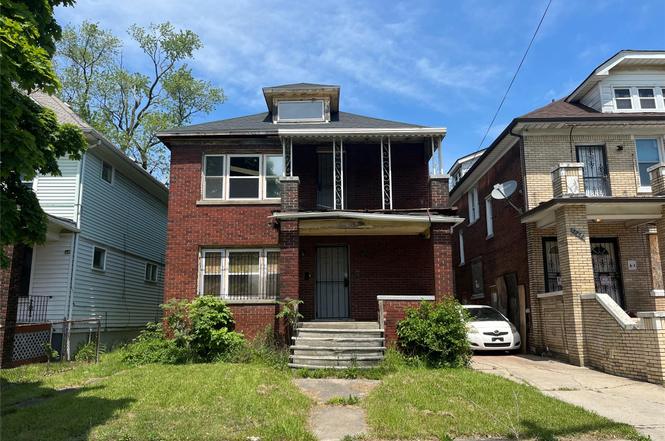
3272 W Euclid St · Detroit, MI
Flood risk 1/10 · Minimal
- FEMA flood zone
- X (unshaded)
- Chance of flooding over 30 yrs
- 0.0%
- Est. flood insurance / yr
- $473 – $860
Fire risk 1/10 · Minimal
- Est. fire insurance / yr
- $784 – $1,456
Heat risk 3/10 · Minor
- Hot days now (above 97°F)
- 7 days/yr
- Hot days in 30 yrs
- 15 days/yr
Wind risk 2/10 · Minimal
- Chance of severe wind over 30 yrs
- —
Air-quality risk 4/10 · Minor
- Unhealthy air days now
- 4 days/yr
- Unhealthy air days in 30 yrs
- 6 days/yr
Risk factors via First Street. Map © Google.
Why this score? — see what drove the D+ grade
The composite is a weighted blend of 9 inputs, each scored 0–100. Each bar is that input's sub-score; the figure is the points it added to the 100-point composite (weight × sub-score).
- Cash flow +15.0/30.0
- ARV discount +13.3/15.0
- 1% rule +5.0/10.0
- DSCR +5.0/10.0
- Rent growth +3.8/5.0
- Livability +3.7/5.0
- Condition / age +2.5/5.0
- Schools +1.3/10.0
- Appreciation +0.0/10.0
$45,000
🖨 Deal sheet (PDF) 📄 Offer letter ✓ Due diligence
Multi-family units
County records classify this as Multi-Family (2-4 Unit). Listing-text estimate: 2 units. confirmed
Listing remarks MLS
Investor Special – Duplex Opportunity! Attention investors and rehabbers! This brick duplex offers strong income potential and is ready for your vision. The property has been gutted down to the studs, providing a blank slate for a complete renovation. Features include two separate units, each offering 2 bedrooms and 1 bathroom, making it an attractive option for future rental income or owner-occupancy with supplemental income. Property needs full renovation. Recent improvements include a new roof and vinyl replacement windows, helping reduce major exterior capital expenses. Additional features include a full basement, durable brick exterior, and separate living spaces ideal for long-term tenants. Property is being sold as-is. Buyer to verify all information and perform their own due diligence. Great opportunity to add value and build equity through a full renovation. Cash or renovation financing preferred. Bring your contractor and imagination! Agent owned. Sold as-is.
Key facts
- Complete renovation
- Duplex opportunity
- New roof
Tags
Neighborhood map
What this means for you Summary
Snapshot
- This is a 2 × 2-bed/1.5-bath units multifamily listed at $45k.
Deal economics
- At list price, monthly cash flow is $2k ($21k/yr) — positive. Per door: $882/mo.
- The deal already cash-flows at list — no discount required.
- Meets the 1% rule at list price ($3k rent vs $45k).
- Cap rate 53.3% vs local median 10.0% in Detroit — top-decile yield for the area; either an underpriced asset or a hidden risk that comps aren't pricing in. Stress-test before assuming the spread holds.
Location & tenants
- Location reads 73/100 on livability (#218 in MI) — a middle-class / working-renter tenant base. Strengths: amenities A+, commute A+, cost of living A+; Watch: schools F, crime F, employment F.
- Detroit Public Schools Community District (urban): math 10% / reading 24% proficiency, ranked #499 of 540 in MI (top 92%) — low school quality limits family demand, transient renter base, plan for 1-2y turnover; 90% free/reduced lunch — lower-income household profile, screen leases tightly.
- Market conditions: Rents rising fast (+5.2%/yr); 273 active listings in the ZIP; 27 comparable units currently listed for rent nearby; rentals at typical pace (median 19d on market — plan ~3-4 weeks tenant-placement turnaround); 2,639 units permitted in Wayne County in 2024 (1,216 in 5+ unit buildings).
- At $2,626/mo this rent would consume 70% of the median local household income ($45k/yr) (locally 646% of renters already pay >50% of income on rent) — very limited rent-growth headroom before tenants either downsize or default.
Forward outlook
- Local home prices are declining (-3.0%/yr); year-one equity from $311 of loan paydown is wiped out by about $1k of value loss. Plan a longer hold.
- Wayne County population projected at -17% by 2050 — secular population decline; favor cash flow + early exit over multi-decade hold.
- At projected returns (-3.0% appreciation + 5.2% rent growth), your $13k cash investment doubles in ~1 year — after that, you're playing with house money.
Negotiation context
- Only 5 days on market — expect competitive offers; lowballing is unlikely to land.
- 7 sale attempts since 22y ago with the ask held roughly flat each time — persistent listings suggest the price (not the market) is what's stuck; bring a comps-based counter.
Risks & watch-outs
- Watch-outs: built in 1924 — expect roof / HVAC / electrical / plumbing capex.
Questions for the listing agent
- Can we see the unit-by-unit rent roll, current vacancy, and any below-market leases? What's the average tenancy length?
- What capital expenditures (roof, boiler, parking lot, exteriors) have been made in the last 5 years, and what's planned in the next 2?
- Built in 1924 — when were the roof, HVAC, electrical panel, plumbing, and water heater last replaced?
- Is there a deadline driving the sale (1031 exchange, divorce, estate, relocation)? That informs how much negotiation room exists.
- Schools are F-rated, which usually means shorter tenancies and higher turnover. Who's the typical renter profile here, and what's been the actual vacancy rate?
- Crime grade is F in this area — have there been break-ins, vandalism, or insurance claims at this property in the last 3 years? What carrier currently insures it and at what premium?
- The area grade is low — what's the realistic commute time and amenity access for the typical tenant pool here? Any planned neighborhood developments (good or bad) we should know about?
- What's the average days-on-market for RENTAL listings here right now (not sales)? A rising rental-DOM trend means longer vacancies and softer asking-rent achievability than the comps imply.
- What's the recent tenant-quality profile in this submarket — average credit score on applications, eviction rate, late-payment / NSF rate, and stable-employment percentage? A property-management company in the area should have these aggregated.
- How much new apartment / multifamily construction is in the pipeline within 1–3 miles? Heavy new supply (>2% of stock underway) typically softens rents 12–24 months out; light construction supports rent growth.
Investment metrics
- 1% rule
- 5.84% ✓
- Cap rate
- 53.32%
- Cash-on-cash
- 167.96%
- DSCR
- 8.47
- GRM
- 1.4
CMA / ARV
- ARV (on-the-fly)
- $51,600
- Comps found
- 12
Show comp detail 12 sales within ~0.75 mi
| Address | Dist | Beds/Ba | Sqft | Sold | Price | $/sf | Match |
|---|---|---|---|---|---|---|---|
| 3308 W Euclid St | 0.03mi | 4/2.5 | 2,256 (+5%) | 12mo | $20,000 | $9 | 78 |
| 3791 Blaine St | 0.24mi | 4/2.0 | 2,306 (+7%) | 8mo | $55,000 | $24 | 70 |
| 3309 Lothrop St | 0.48mi | 4/2.5 | 2,250 (+5%) | 2mo | $40,000 | $18 | 66 |
| 4044 Clairmount St | 0.51mi | 4/3.0 | 2,208 (+3%) | 3mo | $37,000 | $17 | 65 |
| 3744 Blaine St | 0.23mi | 4/2.5 | 2,372 (+10%) | 6mo | $50,000 | $21 | 65 |
| 2657 Northwestern St | 0.54mi | 4/2.0 | 2,134 (-1%) | 13mo | $184,500 | $86 | 62 |
| 3808 Gladstone St | 0.35mi | 4/2.0 | 2,312 (+8%) | 13mo | $25,000 | $11 | 61 |
| 3284 Northwestern St | 0.39mi | 4/2.0 | 2,380 (+11%) | 11mo | $45,000 | $19 | 55 |
| 9051 N Martindale St | 0.74mi | 4/2.0 | 2,160 (+0%) | 13mo | $80,000 | $37 | 54 |
| 3219-23 Lothrop St | 0.48mi | 4/2.0 | 2,300 (+7%) | 18mo | $95,000 | $41 | 51 |
| 8810-8808 Quincy St | 0.42mi | 4/2.5 | 2,352 (+9%) | 16mo | $68,000 | $29 | 49 |
| 4571-4573 Vancouver St | 0.63mi | 4/2.0 | 2,470 (+15%) | 3mo | $76,000 | $31 | 44 |
Match score weights: distance 35% · size 25% · config 20% · recency 20%. Top-matched comps best support the ARV.
Projected returns pro-forma
-3.0% appreciation · 5.2% rent growth · sell at horizon
- IRR
- —
- Equity multiple
- 9.81×
- Total profit
- $111,010
- Equity at exit
- $6,710
- IRR
- —
- Equity multiple
- 22.19×
- Total profit
- $266,957
- Equity at exit
- $3,891
Cash invested: $12,600 (down + closing). Projections, not guarantees.
Landlord ↔ Tenant lean methodology
- Overall (STATE)
- 62 Landlord-Friendly
- State Michigan
- 62 Landlord-Friendly · EVEN
- County
- — inherits STATE
- City
- — inherits STATE
ZIP-level market 48206
- Rents YoY
- 5.2%
- Active inventory
- 273
- Price-to-rent
- 2.9×
Monthly cashflow live
- Estimated rent
- $2,626 high interval (Pro) →
- Mortgage (P&I)
- −$236
- Tax est. 1.5%
- −$56 /mo · $675/yr
- Insurance
- −$19
- HOA
- −$0
- Vacancy / Maint / Mgmt
- −$551
- Net cashflow
- $1,764
Break-even live
Sensitivity live
| Price | -10% $1,795 | -5% $1,779 | +0% $1,764 | +5% $1,748 | +10% $1,732 |
|---|---|---|---|---|---|
| Rent | -10% $1,556 | -5% $1,660 | +0% $1,764 | +5% $1,867 | +10% $1,971 |
| Rate | -1.0pp $1,786 | -0.5pp $1,775 | base $1,764 | +0.5pp $1,752 | +1.0pp $1,740 |
2-unit breakdown (identical units grouped — click to expand)
| Units | Beds | Baths | Est. rent |
|---|---|---|---|
| 2× units | 2 | 1.5 | $2,626 |
| #1 | 2 | 1.5 | $1,313 |
| #2 | 2 | 1.5 | $1,313 |
| Total (2 units) | $2,626 | ||
UW: 25.0% down · 7.5% · 30yr · 1.5% tax · 5.0% vac · 8.0% maint · 8.0% mgmt
Financing live
Cash to close
- Down payment
- $11,250
- Closing costs
- $1,350
- Reserves months
- —
- Total cash needed
- —
Loan-product check · same deal, 3 products live
Conventional
25% down · 7.5% · 30yr
- Down + closing
- —
- Monthly P&I
- —
- Monthly cashflow
- —
- DSCR
- —
- Eligible?
- —
Personal DTI + credit; lowest rate.
DSCR
20% down · 8.5% · 30yr
- Down + closing
- —
- Monthly P&I
- —
- Monthly cashflow
- —
- DSCR
- —
- Eligible?
- —
No personal income docs; deal must DSCR.
Hard money
10% down · 12.0% · 12mo
- Down + closing
- —
- Monthly P&I
- —
- Monthly cashflow
- —
- DSCR
- —
- Eligible?
- —
Short-term bridge; refi at stabilization.
Rent comps 27 comps
| Address | Beds | Baths | Sqft | Rent | $/sqft | DOM | Units | Dist |
|---|---|---|---|---|---|---|---|---|
| 3799 W Philadelphia St Detroit, MI | 5.0 | 2.0 | 2200 | $1,650 | $0.75 | 18d | 1 | 0.20mi |
| 3786 Carter St Unit 2 Detroit, MI | 3.0 | 1.0 | 1400 | $1,100 | $0.79 | 26d | 1 | 0.28mi |
| 2506 W Euclid St Detroit, MI | 3.0 | 1.0 | 1475 | $1,675 | $1.14 | 45d | 1 | 0.47mi |
| 2504 W Euclid St Unit 2504 Detroit, MI | 3.0 | 1.0 | 1475 | $1,650 | $1.12 | 45d | 1 | 0.47mi |
| 2504 W Euclid St Unit 2506 Detroit, MI | 3.0 | 1.0 | 1475 | $1,675 | $1.14 | 45d | 1 | 0.47mi |
| 2509 Gladstone St Unit 1 Detroit, MI | 3.0 | 2.0 | 3000 | $2,650 | $0.88 | 0d | 1 | 0.51mi |
| 8951 La Salle Blvd Unit NA Detroit, MI | 4.0 | 2.5 | 2440 | $2,500 | $1.02 | 0d | 1 | 0.65mi |
| 8951 La Salle Blvd Detroit, MI | 5.0 | 2.5 | 2440 | $2,500 | $1.02 | 16d | 1 | 0.65mi |
| 8951 La Salle Blvd Detroit, MI | 4.0 | 2.5 | 2440 | $2,500 | $1.02 | 3d | 1 | 0.65mi |
| 2302 Hazelwood St Unit 1 Detroit, MI | 3.0 | 1.0 | 1550 | $1,273 | $0.82 | 26d | 1 | 0.70mi |
| 2080 Gladstone St #1 Detroit, MI | 4.0 | 2.0 | 2426 | $3,000 | $1.24 | 0d | 1 | 0.78mi |
| 2047 Seward St Detroit, MI | 3.0 | 1.0 | 1421 | $1,453 | $1.02 | 0d | 1 | 0.79mi |
| 2028 Gladstone St Unit 1 Detroit, MI | 5.0 | 2.0 | 2500 | $2,850 | $1.14 | 4d | 1 | 0.83mi |
| 2925 Calvert St Detroit, MI | 3.0 | 1.0 | 1400 | $1,300 | $0.93 | 18d | 1 | 0.93mi |
| 5315 Spokane St Detroit, MI | 3.0 | 1.0 | 2110 | $1,200 | $0.57 | 18d | 1 | 0.94mi |
| 2655 Collingwood St Detroit, MI | 4.0 | 1.5 | 1881 | $2,700 | $1.44 | 0d | 1 | 1.03mi |
| 3241 Lawrence St Detroit, MI | 4.0 | 2.0 | 2636 | $1,800 | $0.68 | 18d | 1 | 1.03mi |
| 3031 Lawrence St Detroit, MI | 4.0 | 1.0 | 1700 | $1,600 | $0.94 | 18d | 1 | 1.04mi |
| 3322 Webb St Unit 2 Detroit, MI | 3.0 | 1.0 | 1656 | $1,350 | $0.82 | 45d | 1 | 1.18mi |
| 3322 Webb St Unit 1 Detroit, MI | 3.0 | 1.0 | 1656 | $1,350 | $0.82 | 45d | 1 | 1.18mi |
| 3322 Webb St Detroit, MI | 3.0 | 1.0 | 1600 | $1,250 | $0.78 | 18d | 1 | 1.19mi |
| 1441 W Euclid St Detroit, MI | 3.0 | 1.0 | 2380 | $2,600 | $1.09 | 26d | 1 | 1.21mi |
| 1418 W Euclid St Detroit, MI | 3.0 | 1.0 | 2264 | $1,200 | $0.53 | 45d | 1 | 1.23mi |
| 1929 Calvert Ave Unit 2 Detroit, MI | 3.0 | 1.0 | 1414 | $1,199 | $0.85 | 16d | 1 | 1.27mi |
| 1699 Glynn Ct Detroit, MI | 5.0 | 3.5 | 2542 | $2,500 | $0.98 | 23d | 1 | 1.30mi |
| 4426 McGraw Ave Unit 1 Detroit, MI | 3.0 | 1.0 | 1400 | $1,200 | $0.86 | 45d | 1 | 1.32mi |
| 2986 Richton St Detroit, MI | 3.0 | 1.0 | 2600 | $1,200 | $0.46 | 18d | 1 | 1.45mi |
Listing history 4 events
-
2026-06-21days on market $45,000 Active 5 DOM
-
2026-06-18days on market $45,000 Active 2 DOM
-
2026-06-17remarks 693-char remark
Show marketing remark (989 chars)
Investor Special – Duplex Opportunity! Attention investors and rehabbers! This brick duplex offers strong income potential and is ready for your vision. The property has been gutted down to the studs, providing a blank slate for a complete renovation. Features include two separate units, each offering 2 bedrooms and 1 bathroom, making it an attractive option for future rental income or owner-occupancy with supplemental income. Property needs full renovation. Recent improvements include a new roof and vinyl replacement windows, helping reduce major exterior capital expenses. Additional features include a full basement, durable brick exterior, and separate living spaces ideal for long-term tenants. Property is being sold as-is. Buyer to verify all information and perform their own due diligence. Great opportunity to add value and build equity through a full renovation. Cash or renovation financing preferred. Bring your contractor and imagination! Agent owned. Sold as-is.
-
2026-06-17$45,000 Active 1 DOM
Show marketing remark (989 chars)
Investor Special – Duplex Opportunity! Attention investors and rehabbers! This brick duplex offers strong income potential and is ready for your vision. The property has been gutted down to the studs, providing a blank slate for a complete renovation. Features include two separate units, each offering 2 bedrooms and 1 bathroom, making it an attractive option for future rental income or owner-occupancy with supplemental income. Property needs full renovation. Recent improvements include a new roof and vinyl replacement windows, helping reduce major exterior capital expenses. Additional features include a full basement, durable brick exterior, and separate living spaces ideal for long-term tenants. Property is being sold as-is. Buyer to verify all information and perform their own due diligence. Great opportunity to add value and build equity through a full renovation. Cash or renovation financing preferred. Bring your contractor and imagination! Agent owned. Sold as-is.
ⓘ Source: listings_history table (triggers on properties + properties_extension) + one-shot
backfill from property_details.listing_events for pre-trigger history.
Climate risk First Street
- Flood 1/10 Low FEMA zone X (unshaded) · 0% chance over 30 yrs
- Wildfire 1/10 Low
- Heat 3/10 Moderate 7 d/yr ≥97°F today · 15 d/yr by 30 yrs out
- Wind 2/10 Low
- Air quality 4/10 Moderate 4 unhealthy d/yr today · 6 by 30 yrs out
Nearby sold comps map
Loading sold comps map…
Walkable amenities ~0.75 mi
Loading nearby amenities…
Taxation est. · year 1
- Rental income
- $31,512
- − Mortgage interest
- −$2,521
- − Property taxes
- −$675
- − Insurance
- −$225
- − Repairs & maintenance
- −$2,521
- − Management
- −$2,521
- − Depreciation
- −$1,309
- Taxable income
- $21,740
- Est. tax owed @ 24.0%
- −$5,218
- After-tax cash flow
- $15,945/yr
For passive investors: Depreciation is non-cash, so a rental often shows a tax loss while cash-flowing — sheltering income. Rental losses are passive: they offset passive income freely, and up to $25,000/yr can offset ordinary (W-2) income if you actively participate and your MAGI is under $100k (phasing out to $0 by $150k); unused losses carry forward. On sale, claimed depreciation is recaptured at up to 25%, and gains may owe capital-gains tax (a 1031 exchange can defer both). Figures are a year-1 estimate at your 24.0% rate — not tax advice; consult a CPA.
Schools (NCES district)
- District
- Detroit Public Schools Community District
- NCES district ID
- 2601103
- Math proficiency
- 10% ▼ -2.00%
- Reading proficiency
- 24% ▲ 6.00%
- Median HH income
- $25,815
- Composite
- 13.06/100
- National rank
- #9564
- State rank
- #499 of 540 in MI
Livability — Detroit
- Score
- 73/100
- State rank
- #218
- US rank
- #5427
Category grades
Schools grade is shown separately in the Schools card above.
Census & demographics
- Census place
- Detroit, MI
- County
- Wayne County · 1,562,939 people
- City population
- 572,865
- Metro
- Detroit-Warren-Dearborn, MI
- Population (ZIP)
- 15,227
- Household income
- $45,046
- Rent vs Own
- Severe rent burden
- 646.0
Population outlook (Wayne County) Hauer SSP2
- Today (2025)
- 1,675,273 people
- By 2030
- 1,620,300 · -3.3%
- By 2040
- 1,502,341 · -10.3%
- By 2050
- 1,384,039 · -17.4%
- By 2075
- 1,124,592 · -32.9%
- By 2100
- 881,193 · -47.4%
Race, ethnicity, and origin ACS 2023
- Neighborhood character
- Predominantly Black (81%)
- Race & ethnicity
- Black 81% White 12% Two or more races 5% Hispanic / Latino 3%
- Common ancestry
- Iranian 3% Romanian 1% Slovak 1%
- Foreign-born
- 4% · Canada
- Languages at home
- 94% English-only · Spanish 4% Other Indo-European 1%
Political lean MEDSL · Wayne
- 2024 margin
- Strong D (+29.0) · D 62.7% · R 33.7% · Other 3.6%
- 2008→2024 swing
- -20.5pp toward R · 2008: 49.5pp · 2024: 29.0pp
- All cycles
- 2024: D+29.0 2020: D+38.1 2016: D+37.3 2012: D+46.9 2008: D+49.5
Not yet ingested
- Civics
- —
Market trends
- HPI YoY
- ▼ -139.60%
- Current HPI
- 130.9545
- Rent YoY
- ▲ 5.20%
- Metro
- Detroit-Warren-Dearborn, MI
- State GDP YoY
- ▲ 1.37%
- F500 in state
- 28
Industry mix (Fortune 500 HQ in MI)
| Industry | F500 HQs | Revenue |
|---|---|---|
| Automotive Parts | 3 | $48B |
|
||
| Automotive | 2 | $372B |
|
||
| Chemicals | 1 | $45B |
|
||
| Automotive Retail | 1 | $29B |
|
||
| Healthcare / Medical Devices | 1 | $23B |
|
||
| Automotive Technology | 1 | $20B |
|
||
Price history
-5.3% since first listed32 events — show timeline
- 2026-06-17 Listed $45,000 REALCOMP
- 2026-06-16 Listed $45,000 MiRealSource-MiMLS
- 2026-01-01 Listing Removed — MiRealSource-MiMLS
- 2025-12-31 Listing Removed — REALCOMP
- 2025-11-10 Price Changed $29,999 MiRealSource-MiMLS
- 2025-11-10 Price Changed $29,999 REALCOMP
- 2025-11-07 Price Changed $31,999 MiRealSource-MiMLS
- 2025-11-06 Price Changed $31,999 REALCOMP
- 2025-10-21 Price Changed $32,999 MiRealSource-MiMLS
- 2025-10-20 Price Changed $32,999 REALCOMP
- 2025-10-18 Price Changed $34,999 MiRealSource-MiMLS
- 2025-10-18 Price Changed $34,999 REALCOMP
- 2025-09-12 Price Changed $37,999 MiRealSource-MiMLS
- 2025-09-12 Price Changed $37,999 REALCOMP
- 2025-07-13 Price Changed $39,999 MiRealSource-MiMLS
- 2025-07-13 Price Changed $39,999 REALCOMP
- 2025-05-14 Price Changed $44,999 MiRealSource-MiMLS
- 2025-05-13 Price Changed $44,999 REALCOMP
- 2025-04-22 Price Changed $49,999 MiRealSource-MiMLS
- 2025-04-21 Price Changed $49,999 REALCOMP
- 2025-04-17 Relisted — REALCOMP
- 2025-04-17 Listing Removed — REALCOMP
- 2025-02-12 Price Changed $54,999 MiRealSource-MiMLS
- 2025-02-12 Price Changed $54,999 REALCOMP
- 2024-12-13 Listed $59,999 REALCOMP
- 2024-12-13 Listed $59,999 MiRealSource-MiMLS
- 2007-05-01 Listing Removed — MiRealSource-MiMLS
- 2006-10-26 Listed $3,250 MiRealSource-MiMLS
- 2005-02-03 Sold (Public Records) $80,000 Public Records
- 2004-10-01 Sold (MLS) $42,700 MiRealSource-MiMLS
- 2004-09-09 Listing Removed — MiRealSource-MiMLS
- 2004-06-10 Listed $47,500 MiRealSource-MiMLS
Property tax history
+8.8%/yrLatest (2025): $3,903 · +56.5% YoY. Source: county tax records.
Cash-flow waterfall
monthlySold comps — $/sqft
last 12 mo · ≤1 miLoading sold comps…