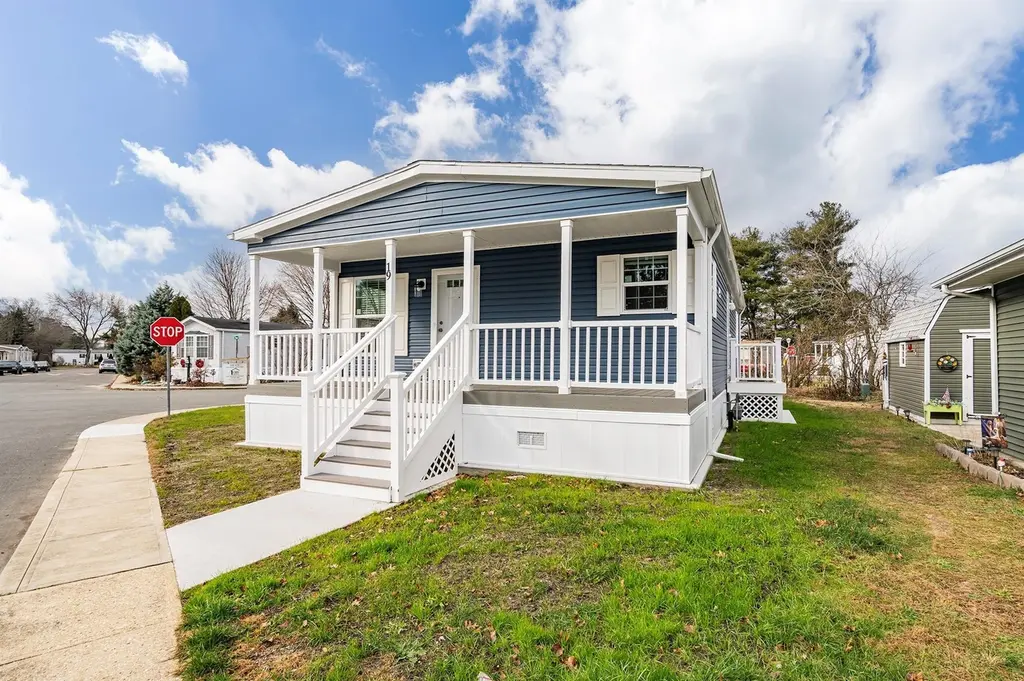
19 Southwind Cir · Vista Center, NJ
Flood risk No data
- FEMA flood zone
- —
- Chance of flooding over 30 yrs
- —
- Est. flood insurance / yr
- —
Fire risk No data
- Est. fire insurance / yr
- —
Heat risk No data
- Hot days now (above threshold)
- —
- Hot days in 30 yrs
- —
Wind risk No data
- Chance of severe wind over 30 yrs
- —
Air-quality risk No data
- Unhealthy air days now
- —
- Unhealthy air days in 30 yrs
- —
Risk factors via First Street. Map © Google.
Why this score? — see what drove the C+ grade
The composite is a weighted blend of 9 inputs, each scored 0–100. Each bar is that input's sub-score; the figure is the points it added to the 100-point composite (weight × sub-score).
- Cash flow +26.2/30.0
- DSCR +8.8/10.0
- ARV discount +7.5/15.0
- 1% rule +7.0/10.0
- Condition / age +4.0/5.0
- Schools +3.5/10.0
- Livability +2.9/5.0
- Rent growth +2.1/5.0
- Appreciation +0.0/10.0
$225,000
🖨 Deal sheet 📄 Offer letter ✓ Due diligence
Listing remarks MLS
This brand new, 2 bedroom home is available for sale! Call the office to schedule a tour.
Key facts
- Built 2026
- Listed 128 days
Neighborhood map
What this means for you Summary
Snapshot
- This is a 2-bed/2.0-bath manufactured listed at $225k. Condition is rated good.
Deal economics
- At list price, monthly cash flow is $571 ($7k/yr) — positive.
- The deal already cash-flows at list — no discount required.
- Meets the 1% rule at list price ($3k rent vs $225k).
- Recommended offer: $198k (12.0% below list) — sets the bar for market timing.
- Cap rate 9.3% vs local median 3.3% in Vista Center — top-decile yield for the area; either an underpriced asset or a hidden risk that comps aren't pricing in. Stress-test before assuming the spread holds.
Location & tenants
- Location reads 58/100 on livability (#507 in NJ) — a working-class tenant base; expect higher turnover. Strengths: crime A+, employment A+, housing A+; Watch: schools D-, amenities F, commute F.
- Jackson Township School District (suburban): math 26% / reading 48% proficiency, ranked #228 of 472 in NJ (top 48%) — families likely to look elsewhere, expect single-tenant / working-renter base with shorter leases; only 15% free/reduced lunch — higher-income household profile.
- Market conditions: Rents soft (-1.7%/yr); 564 active listings in the ZIP; high-income renter base; 4,434 units permitted in Ocean County in 2024 (868 in 5+ unit buildings).
Forward outlook
- Local home prices are declining (-3.0%/yr); year-one equity from $2k of loan paydown is wiped out by about $7k of value loss. Plan a longer hold.
- Ocean County population projected to shrink 8% by 2050 — rents likely to lag national; underwrite the cash flow, not the appreciation.
Negotiation context
- It's been on market 128 days — a 12% lower offer ($198k) is reasonable based on typical stale-listing flexibility.
Questions for the listing agent
- It's been on market 128 days. Have you received any prior offers? Is the seller open to a 12% concession, seller financing, or rate buy-down credit?
- Why hasn't it sold? Are there any deal-killer items the seller is aware of (foundation, flood, title, zoning, code violations)?
- Is there a deadline driving the sale (1031 exchange, divorce, estate, relocation)? That informs how much negotiation room exists.
- Schools are D-rated, which usually means shorter tenancies and higher turnover. Who's the typical renter profile here, and what's been the actual vacancy rate?
- What's the average days-on-market for RENTAL listings here right now (not sales)? A rising rental-DOM trend means longer vacancies and softer asking-rent achievability than the comps imply.
- What's the recent tenant-quality profile in this submarket — average credit score on applications, eviction rate, late-payment / NSF rate, and stable-employment percentage? A property-management company in the area should have these aggregated.
- How much new for-sale + rental construction is in the pipeline within 1–3 miles? Heavy new supply typically softens prices + rents 12–24 months out; constrained supply supports both.
Investment metrics
- 1% rule
- 1.20% ✓
- Cap rate
- 9.34%
- Cash-on-cash
- 10.87%
- DSCR
- 1.48
- GRM
- 7.0
CMA / ARV
No comps found within radius.
Projected returns pro-forma
-3.0% appreciation · 0.0% rent growth · sell at horizon
- IRR
- -3.5%
- Equity multiple
- 0.87×
- Total profit
- $-7,947
- Equity at exit
- $33,548
- IRR
- 2.5%
- Equity multiple
- 1.15×
- Total profit
- $9,586
- Equity at exit
- $19,454
Cash invested: $63,000 (down + closing). Projections, not guarantees.
Landlord ↔ Tenant lean methodology
- Overall (STATE)
- 21 Tenant-Leaning
- State New Jersey
- 21 Tenant-Leaning · D+6
- County
- — inherits STATE
- City
- — inherits STATE
ZIP-level market 08527
- Rents YoY
- -1.7%
- Active inventory
- 564
- Price-to-rent
- 7.0×
Monthly cashflow live
- Estimated rent
- $2,691 medium interval (Pro) →
- Mortgage (P&I)
- −$1,180
- Tax est. 1.5%
- −$281 /mo · $3,375/yr
- Insurance
- −$94
- HOA
- −$0
- Vacancy / Maint / Mgmt
- −$565
- Net cashflow
- $571
Break-even live
UW: 25.0% down · 7.5% · 30yr · 1.5% tax · 5.0% vac · 8.0% maint · 8.0% mgmt
Financing live
Cash to close
- Down payment
- $56,250
- Closing costs
- $6,750
- Reserves months
- —
- Total cash needed
- —
Loan-product check · same deal, 3 products live
Conventional
25% down · 7.5% · 30yr
- Down + closing
- —
- Monthly P&I
- —
- Monthly cashflow
- —
- DSCR
- —
- Eligible?
- —
Personal DTI + credit; lowest rate.
DSCR
20% down · 8.5% · 30yr
- Down + closing
- —
- Monthly P&I
- —
- Monthly cashflow
- —
- DSCR
- —
- Eligible?
- —
No personal income docs; deal must DSCR.
Hard money
10% down · 12.0% · 12mo
- Down + closing
- —
- Monthly P&I
- —
- Monthly cashflow
- —
- DSCR
- —
- Eligible?
- —
Short-term bridge; refi at stabilization.
Listing history 15 events
-
2026-06-18days on market $225,000 Active 128 DOM
-
2026-06-17days on market $225,000 Active 127 DOM
-
2026-06-16days on market $225,000 Active 126 DOM
-
2026-06-15days on market $225,000 Active 125 DOM
-
2026-06-13days on market $225,000 Active 123 DOM
-
2026-06-13days on market $225,000 Active 122 DOM
-
2026-06-09days on market $225,000 Active 119 DOM
-
2026-06-08days on market $225,000 Active 118 DOM
-
2026-06-07days on market $225,000 Active 117 DOM
-
2026-06-04days on market $225,000 Active 114 DOM
-
2026-06-03days on market $225,000 Active 113 DOM
-
2026-06-02days on market $225,000 Active 112 DOM
-
2026-06-01days on market $225,000 Active 111 DOM
-
2026-05-31days on market $225,000 Active 110 DOM
-
2026-02-10$225,000 Active 89-char remark
Show marketing remark (89 chars)
This brand new, 2 bedroom home is available for sale! Call the office to schedule a tour.
ⓘ Source: listings_history table (triggers on properties + properties_extension) + one-shot
backfill from property_details.listing_events for pre-trigger history.
Nearby sold comps map
Loading sold comps map…
Walkable amenities ~0.75 mi
Loading nearby amenities…
Taxation est. · year 1
- Rental income
- $32,290
- − Mortgage interest
- −$12,603
- − Property taxes
- −$3,375
- − Insurance
- −$1,125
- − Repairs & maintenance
- −$2,583
- − Management
- −$2,583
- − Depreciation
- −$6,545
- Taxable income
- $3,475
- Est. tax owed @ 24.0%
- −$834
- After-tax cash flow
- $6,016/yr
For passive investors: Depreciation is non-cash, so a rental often shows a tax loss while cash-flowing — sheltering income. Rental losses are passive: they offset passive income freely, and up to $25,000/yr can offset ordinary (W-2) income if you actively participate and your MAGI is under $100k (phasing out to $0 by $150k); unused losses carry forward. On sale, claimed depreciation is recaptured at up to 25%, and gains may owe capital-gains tax (a 1031 exchange can defer both). Figures are a year-1 estimate at your 24.0% rate — not tax advice; consult a CPA.
Condition & rehab AI · 12 photos
This brand new, 2-bedroom home is move-in ready with good condition and minimal maintenance required. Upgrades in paint, kitchen, and landscaping would significantly increase its value.
Value-add opportunities
- Both Painting exterior and interior walls — Enhances curb appeal and interior aesthetics
- Both Upgrading kitchen appliances — Modernizes kitchen and attracts more buyers
- Both Adding smart home features — Improves energy efficiency and adds value
- Both Landscaping improvements — Enhances curb appeal and adds value
Renovation cost estimate screening
Value-add ROI direction
- Both Painting exterior and interior walls — Enhances curb appeal and interior aesthetics ↑
- Both Upgrading kitchen appliances — Modernizes kitchen and attracts more buyers ↑
- Both Adding smart home features — Improves energy efficiency and adds value ↑
- Both Landscaping improvements — Enhances curb appeal and adds value ↑
ⓘ Cost ranges are severity-bucket heuristics (US national rule-of-thumb). Get contractor quotes + a written scope before underwriting a rehab budget.
Schools (NCES district)
- District
- Jackson Township School District
- NCES district ID
- 3407740
- Math proficiency
- 26% ▼ -22.00%
- Reading proficiency
- 48% ▼ -8.00%
- Median HH income
- $86,012
- Composite
- 35.36/100
- National rank
- #4956
- State rank
- #228 of 472 in NJ
Livability — Vista Center
- Score
- 58/100
- State rank
- #507
- US rank
- #21522
Category grades
Schools grade is shown separately in the Schools card above.
Census & demographics
- County
- Ocean County · 439,426 people
- Metro
- New York-Newark-Jersey City, NY-NJ-PA
- Population (ZIP)
- 58,991
- Household income
- $115,487
- Rent vs Own
- Severe rent burden
- 1031.0
Population outlook (Ocean County) Hauer SSP2
- Today (2025)
- 586,991 people
- By 2030
- 581,403 · -1.0%
- By 2040
- 564,913 · -3.8%
- By 2050
- 538,149 · -8.3%
- By 2075
- 468,845 · -20.1%
- By 2100
- 350,297 · -40.3%
Race, ethnicity, and origin ACS 2023
- Neighborhood character
- Predominantly White (76%)
- Race & ethnicity
- White 76% Hispanic / Latino 14% Two or more races 8% Black 4% Asian 3%
- Hispanic origin (detail)
- Mexican 1% Puerto Rican 6%
- Common ancestry
- Romanian 9% Scotch-Irish 2% Italian 2%
- Foreign-born
- 9% · Canada, China, Jamaica
- Languages at home
- 88% English-only · Spanish 6% Other Indo-European 2% German/W. Germanic 1%
Political lean MEDSL · Ocean
- 2024 margin
- Solid R (+36.0) · D 31.4% · R 67.4% · Other 1.2%
- 2008→2024 swing
- -17.6pp toward R · 2008: -18.4pp · 2024: -36.0pp
- All cycles
- 2024: R+36.0 2020: R+28.7 2016: R+34.0 2012: R+17.7 2008: R+18.4
Not yet ingested
- Civics
- —
Market trends
- HPI YoY
- ▼ -349.94%
- Current HPI
- 338.3328
- Rent YoY
- ▼ -1.71%
- Metro
- New York-Newark-Jersey City, NY-NJ-PA
- State GDP YoY
- ▲ 2.05%
- F500 in state
- 34
Industry mix (Fortune 500 HQ in NJ)
| Industry | F500 HQs | Revenue |
|---|---|---|
| Consumer Goods | 3 | $31B |
|
||
| Pharmaceuticals | 2 | $153B |
|
||
| Technology | 2 | $21B |
|
||
| Insurance | 2 | $20B |
|
||
| Healthcare | 2 | $19B |
|
||
| Financial Services | 1 | $70B |
|
||
Price history
1 event — show timeline
- 2026-02-10 Listed $225,000 Zillow
Cash-flow waterfall
monthlySold comps — $/sqft
last 12 mo · ≤1 miLoading sold comps…