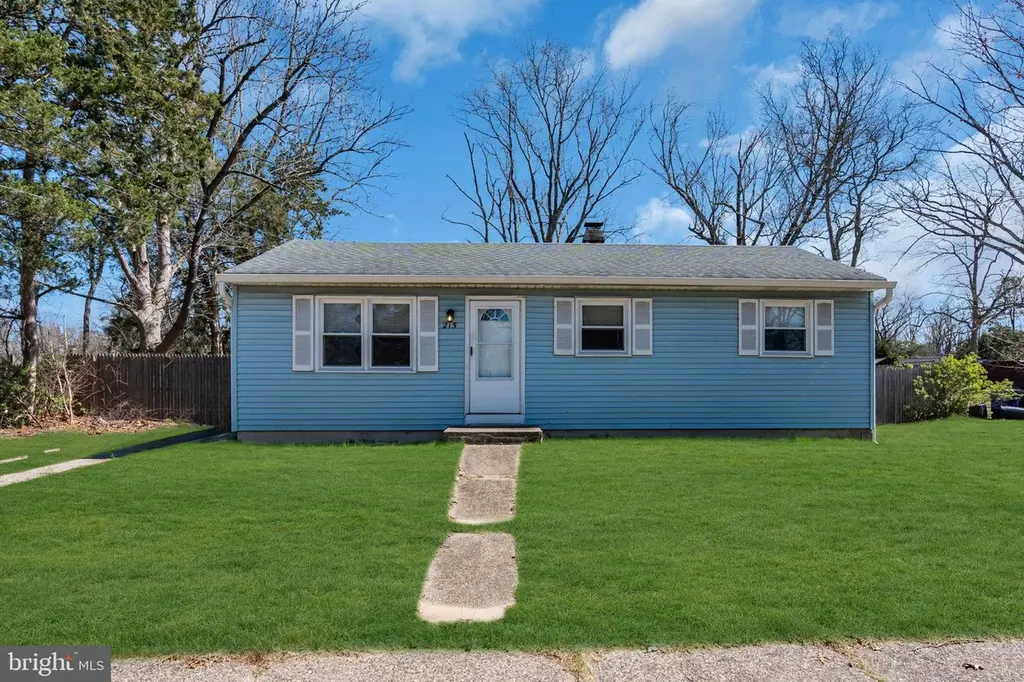
215 Scammell Dr · Browns Mills, NJ
Flood risk 1/10 · Minimal
- FEMA flood zone
- X (unshaded)
- Chance of flooding over 30 yrs
- 0.0%
- Est. flood insurance / yr
- $507 – $1,088
Fire risk 4/10 · Minor
- Est. fire insurance / yr
- $526 – $976
Heat risk 6/10 · Moderate
- Hot days now (above 103°F)
- 7 days/yr
- Hot days in 30 yrs
- 15 days/yr
Wind risk 6/10 · Moderate
- Chance of severe wind over 30 yrs
- 56.0%
Air-quality risk 4/10 · Minor
- Unhealthy air days now
- 4 days/yr
- Unhealthy air days in 30 yrs
- 5 days/yr
Risk factors via First Street. Map © Google.
Why this score? — see what drove the C grade
The composite is a weighted blend of 9 inputs, each scored 0–100. Each bar is that input's sub-score; the figure is the points it added to the 100-point composite (weight × sub-score).
- Cash flow +20.7/30.0
- ARV discount +15.0/15.0
- DSCR +6.6/10.0
- 1% rule +5.4/10.0
- Livability +3.2/5.0
- Rent growth +2.5/5.0
- Condition / age +2.5/5.0
- Schools +2.3/10.0
- Appreciation +0.0/10.0
$229,900
🖨 Deal sheet 📄 Offer letter ✓ Due diligence
Listing remarks MLS
Get your tools ready! 3 bedroom and 1 bath home ready for a new vision. Fully fenced in backyard.
Key facts
- 9,600 sq ft lot
- Built 1974
- Listed 41 days
Tags
Neighborhood map
What this means for you Summary
Snapshot
- This is a 3-bed/1.0-bath single-family listed at $230k.
Deal economics
- At list price, monthly cash flow is $310 ($4k/yr) — positive.
- The deal already cash-flows at list — no discount required.
- Meets the 1% rule at list price ($2k rent vs $230k).
- Recommended offer: $223k (3.0% below list) — sets the bar for market timing.
- Cap rate 7.9% vs local median 5.2% in Browns Mills — top-decile yield for the area; either an underpriced asset or a hidden risk that comps aren't pricing in. Stress-test before assuming the spread holds.
Location & tenants
- Location reads 63/100 on livability (#436 in NJ) — a middle-class / working-renter tenant base. Strengths: housing A+, health & safety B+, cost of living B; Watch: schools F, amenities F, commute F.
- Pemberton Township School District (rural): math 12% / reading 38% proficiency, ranked #382 of 472 in NJ (top 81%) — low school quality limits family demand, transient renter base, plan for 1-2y turnover.
- Market conditions: 116 active listings in the ZIP; 1 comparable units currently listed for rent nearby; 2,161 units permitted in Burlington County in 2024 (988 in 5+ unit buildings).
Forward outlook
- Local home prices are declining (-3.0%/yr); year-one equity from $2k of loan paydown is wiped out by about $7k of value loss. Plan a longer hold.
- Burlington County population projected to shrink 5% by 2050 — rents likely to lag national; underwrite the cash flow, not the appreciation.
Negotiation context
- It's been on market 41 days — a 3% lower offer ($223k) is reasonable based on typical stale-listing flexibility.
- 2 sale attempts; this cycle's ask has dropped $15k (6%) from the opening price — seller is motivated, your offer sets the floor, not the list.
- Current owner paid $143k; list at $230k implies a 61% gain — meaningful room to come down on a strong offer.
Risks & watch-outs
- Climate carrying-cost: major wind risk, 56% chance of damaging wind over 30y; extreme-heat days projected 7→15/yr by 2055 (HVAC capex compounding) — expect insurance premiums to compound above CPI over the hold.
Questions for the listing agent
- It's been on market 41 days. Have you received any prior offers? Is the seller open to a 3% concession, seller financing, or rate buy-down credit?
- Built in 1974 — when were the roof, HVAC, electrical panel, plumbing, and water heater last replaced?
- Is there a deadline driving the sale (1031 exchange, divorce, estate, relocation)? That informs how much negotiation room exists.
- Schools are F-rated, which usually means shorter tenancies and higher turnover. Who's the typical renter profile here, and what's been the actual vacancy rate?
- What's the average days-on-market for RENTAL listings here right now (not sales)? A rising rental-DOM trend means longer vacancies and softer asking-rent achievability than the comps imply.
- What's the recent tenant-quality profile in this submarket — average credit score on applications, eviction rate, late-payment / NSF rate, and stable-employment percentage? A property-management company in the area should have these aggregated.
- How much new for-sale + rental construction is in the pipeline within 1–3 miles? Heavy new supply typically softens prices + rents 12–24 months out; constrained supply supports both.
Investment metrics
- 1% rule
- 1.04% ✓
- Cap rate
- 7.91%
- Cash-on-cash
- 5.78%
- DSCR
- 1.26
- GRM
- 8.0
CMA / ARV
- ARV (median comp)
- $278,006
- List price
- $229,900
- Delta
- -17.30%
- Verdict
- UNDERPRICED
- Comps
- 20 within 1.0 mi
Show comp detail 12 sales within ~0.75 mi
| Address | Dist | Beds/Ba | Sqft | Sold | Price | $/sf | Match |
|---|---|---|---|---|---|---|---|
| 214 Scammell Dr | 0.03mi | 3/1.0 | 883 (+2%) | 4mo | $290,000 | $328 | 92 |
| 204 Scammell Dr | 0.08mi | 2/1.0 (-1) | 863 (0%) | 5mo | $255,000 | $295 | 87 |
| 612 Weymouth Rd | 0.16mi | 3/1.0 | 863 (0%) | 10mo | $275,000 | $319 | 84 |
| 15 Coville Dr | 0.17mi | 3/1.0 | 863 (0%) | 10mo | $275,000 | $319 | 84 |
| 3394 Liberty St | 0.21mi | 3/2.0 | 900 (+4%) | 5mo | $111,500 | $124 | 75 |
| 511 Laurel Blvd | 0.27mi | 3/1.5 | 921 (+7%) | 6mo | $275,000 | $299 | 69 |
| 3449 New Moon St | 0.29mi | 2/2.0 (-1) | 800 (-7%) | 1mo | $45,000 | $56 | 65 |
| 610 Berkeley Dr | 0.16mi | 3/1.0 | 972 (+13%) | 11mo | $313,000 | $322 | 63 |
| 3361 Liberty St | 0.21mi | 3/2.0 | 924 (+7%) | 15mo | $124,000 | $134 | 62 |
| 14 Rancocas Ln | 0.74mi | 3/1.0 | 864 (+0%) | 13mo | $265,000 | $307 | 54 |
| 3620 Weymouth Rd | 0.53mi | 2/2.0 (-1) | 800 (-7%) | 1mo | $138,000 | $173 | 53 |
| 16 Rancocas Ln | 0.73mi | 2/1.5 (-1) | 816 (-5%) | 10mo | $310,000 | $380 | 42 |
Match score weights: distance 35% · size 25% · config 20% · recency 20%. Top-matched comps best support the ARV.
Projected returns pro-forma
-3.0% appreciation · 3.0% rent growth · sell at horizon
- IRR
- -7.4%
- Equity multiple
- 0.73×
- Total profit
- $-17,478
- Equity at exit
- $34,279
- IRR
- 2.2%
- Equity multiple
- 1.16×
- Total profit
- $10,340
- Equity at exit
- $19,878
Cash invested: $64,372 (down + closing). Projections, not guarantees.
Landlord ↔ Tenant lean methodology
- Overall (STATE)
- 21 Tenant-Leaning
- State New Jersey
- 21 Tenant-Leaning · D+6
- County
- — inherits STATE
- City
- — inherits STATE
ZIP-level market 08015
- Home prices YoY
- -23.1%
- Active inventory
- 116
- Price-to-rent
- 8.0×
Monthly cashflow live
- Estimated rent
- $2,400 medium interval (Pro) →
- Mortgage (P&I)
- −$1,206
- Tax from tax record
- −$285 /mo · $3,416/yr
- Insurance
- −$96
- HOA
- −$0
- Vacancy / Maint / Mgmt
- −$504
- Net cashflow
- $310
Break-even live
UW: 25.0% down · 7.5% · 30yr · 1.5% tax · 5.0% vac · 8.0% maint · 8.0% mgmt
Financing live
Cash to close
- Down payment
- $57,475
- Closing costs
- $6,897
- Reserves months
- —
- Total cash needed
- —
Loan-product check · same deal, 3 products live
Conventional
25% down · 7.5% · 30yr
- Down + closing
- —
- Monthly P&I
- —
- Monthly cashflow
- —
- DSCR
- —
- Eligible?
- —
Personal DTI + credit; lowest rate.
DSCR
20% down · 8.5% · 30yr
- Down + closing
- —
- Monthly P&I
- —
- Monthly cashflow
- —
- DSCR
- —
- Eligible?
- —
No personal income docs; deal must DSCR.
Hard money
10% down · 12.0% · 12mo
- Down + closing
- —
- Monthly P&I
- —
- Monthly cashflow
- —
- DSCR
- —
- Eligible?
- —
Short-term bridge; refi at stabilization.
Rent comps 1 comps
| Address | Beds | Baths | Sqft | Rent | $/sqft | DOM | Units | Dist |
|---|---|---|---|---|---|---|---|---|
| 4 Coville Dr Browns Mills, NJ | 4.0 | 1.0 | 863 | $2,400 | $2.78 | 15d | 1 | 0.15mi |
Listing history 8 events
-
2026-05-08price $229,900 98-char remark
Show marketing remark (99 chars)
Get your tools ready! 3 bedroom and 1 bath home ready for a new vision. Fully fenced in backyard.
-
2026-05-08price $229,900 99-char remark
Show marketing remark (99 chars)
Get your tools ready! 3 bedroom and 1 bath home ready for a new vision. Fully fenced in backyard.
-
2026-04-09$244,900 Active 98-char remark
Show marketing remark (98 chars)
Get your tools ready! 3 bedroom and 1 bath home ready for a new vision. Fully fenced in backyard.
-
2026-04-08$244,900 Active 99-char remark
Show marketing remark (99 chars)
Get your tools ready! 3 bedroom and 1 bath home ready for a new vision. Fully fenced in backyard.
-
2005-08-05soldstatus $143,000
-
2005-06-15soldstatus $135,000
-
2003-08-26soldstatus $64,900
-
1978-02-01soldstatus $24,500
ⓘ Source: listings_history table (triggers on properties + properties_extension) + one-shot
backfill from property_details.listing_events for pre-trigger history.
Tax reassessment forecast NJ · Partial reset (capped growth)
- Current annual tax
- $3,416 · $285/mo
- Projected year-2 tax
- $4,570 · $381/mo
- Expected delta
- +$1,154/yr (+$96/mo · 33.8%)
ⓘ Screening estimate from a state-policy table — verify with the county assessor before closing.
Climate risk First Street
- Flood 1/10 Low FEMA zone X (unshaded) · 0% chance over 30 yrs
- Wildfire 4/10 Moderate
- Heat 6/10 Major 7 d/yr ≥103°F today · 15 d/yr by 30 yrs out
- Wind 6/10 Major 56% chance of damaging wind over 30 yrs
- Air quality 4/10 Moderate 4 unhealthy d/yr today · 5 by 30 yrs out
Nearby sold comps map
Loading sold comps map…
Walkable amenities ~0.75 mi
Loading nearby amenities…
Taxation est. · year 1
- Rental income
- $28,800
- − Mortgage interest
- −$12,878
- − Property taxes
- −$3,416
- − Insurance
- −$1,150
- − Repairs & maintenance
- −$2,304
- − Management
- −$2,304
- − Depreciation
- −$6,688
- Taxable income
- $61
- Est. tax owed @ 24.0%
- −$15
- After-tax cash flow
- $3,705/yr
For passive investors: Depreciation is non-cash, so a rental often shows a tax loss while cash-flowing — sheltering income. Rental losses are passive: they offset passive income freely, and up to $25,000/yr can offset ordinary (W-2) income if you actively participate and your MAGI is under $100k (phasing out to $0 by $150k); unused losses carry forward. On sale, claimed depreciation is recaptured at up to 25%, and gains may owe capital-gains tax (a 1031 exchange can defer both). Figures are a year-1 estimate at your 24.0% rate — not tax advice; consult a CPA.
Schools (NCES district)
- District
- Pemberton Township School District
- NCES district ID
- 3412810
- Math proficiency
- 12% ▼ -14.00%
- Reading proficiency
- 38% ▼ -5.00%
- Median HH income
- $60,951
- Composite
- 23.0/100
- National rank
- #7979
- State rank
- #382 of 472 in NJ
Livability — Browns Mills
- Score
- 63/100
- State rank
- #436
- US rank
- #15864
Category grades
Schools grade is shown separately in the Schools card above.
Census & demographics
- Census place
- Browns Mills, NJ
- Population (ZIP)
- 19,143
Population outlook (Burlington County) Hauer SSP2
- Today (2025)
- 453,425 people
- By 2030
- 452,359 · -0.2%
- By 2040
- 445,033 · -1.9%
- By 2050
- 431,760 · -4.8%
- By 2075
- 406,277 · -10.4%
- By 2100
- 364,732 · -19.6%
Race, ethnicity, and origin ACS 2023
- Neighborhood character
- Diverse neighborhood (Simpson 0.56)
- Race & ethnicity
- White 63% Hispanic / Latino 14% Black 13% Two or more races 10% Asian 3%
- Hispanic origin (detail)
- Mexican 2% Puerto Rican 10%
- Common ancestry
- Romanian 3% Slovak 2% Serbian 2%
- Foreign-born
- 6% · Canada, Jamaica, South Korea
- Languages at home
- 87% English-only · Spanish 7% French/Haitian/Cajun 3% Tagalog/Filipino 1%
Political lean MEDSL · Burlington
- 2024 margin
- D (+16.6) · D 57.6% · R 41.0% · Other 1.3%
- 2008→2024 swing
- -2.0pp toward R · 2008: 18.6pp · 2024: 16.6pp
- All cycles
- 2024: D+16.6 2020: D+19.5 2016: D+14.8 2012: D+18.7 2008: D+18.6
Not yet ingested
- Civics
- —
Market trends
- HPI YoY
- ▼ -98.84%
- Current HPI
- 329.1731
- Rent YoY
- —
- Metro
- —
- State GDP YoY
- ▲ 2.05%
- F500 in state
- 34
Industry mix (Fortune 500 HQ in NJ)
| Industry | F500 HQs | Revenue |
|---|---|---|
| Consumer Goods | 3 | $31B |
|
||
| Pharmaceuticals | 2 | $153B |
|
||
| Technology | 2 | $21B |
|
||
| Insurance | 2 | $20B |
|
||
| Healthcare | 2 | $19B |
|
||
| Financial Services | 1 | $70B |
|
||
Price history
+838.4% since first listed8 events — show timeline
- 2026-05-08 Price Changed $229,900 BRIGHT MLS
- 2026-05-08 Price Changed $229,900 MOMLS
- 2026-04-09 Listed $244,900 BRIGHT MLS
- 2026-04-08 Listed $244,900 MOMLS
- 2005-08-05 Sold (Public Records) $143,000 Public Records
- 2005-06-15 Sold (Public Records) $135,000 Public Records
- 2003-08-26 Sold (Public Records) $64,900 Public Records
- 1978-02-01 Sold (Public Records) $24,500 Public Records
Property tax history
+2.0%/yrLatest (2025): $3,416 · +6.1% YoY. Source: county tax records.
Cash-flow waterfall
monthlySold comps — $/sqft
last 12 mo · ≤1 miLoading sold comps…