 🏗️ New Construction
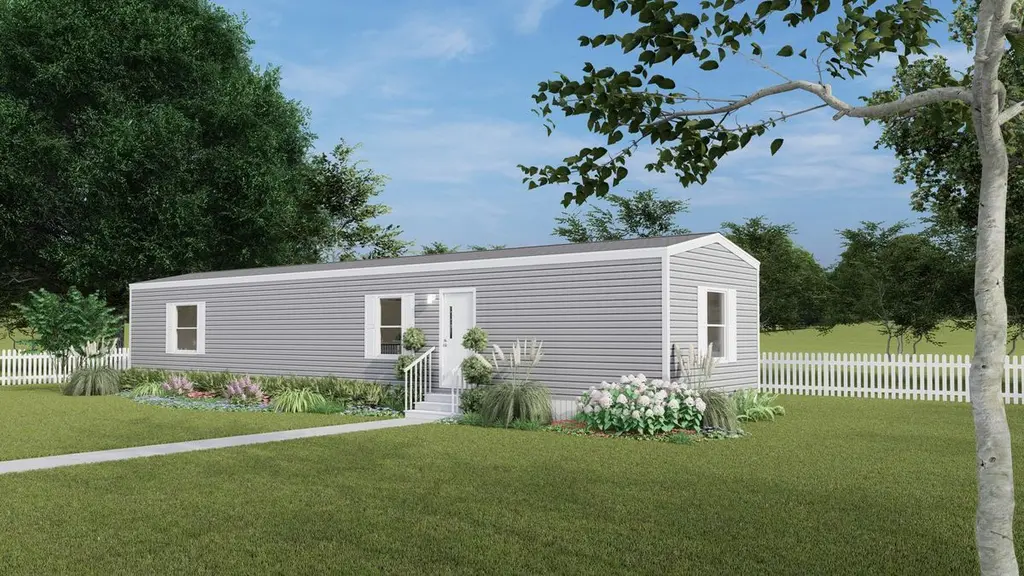
TRU Delight Plan · Chattanooga, TN
Flood risk 9/10 · Severe
- FEMA flood zone
- AE
- Chance of flooding over 30 yrs
- 0.99%
- Est. flood insurance / yr
- $1,737 – $8,500
Fire risk 5/10 · Moderate
- Est. fire insurance / yr
- $963 – $1,789
Heat risk 6/10 · Moderate
- Hot days now (above 104°F)
- 7 days/yr
- Hot days in 30 yrs
- 21 days/yr
Wind risk 4/10 · Minor
- Chance of severe wind over 30 yrs
- 12.0%
Air-quality risk 3/10 · Minor
- Unhealthy air days now
- 2 days/yr
- Unhealthy air days in 30 yrs
- 2 days/yr
Risk factors via First Street. Map © Google.
Why this score? — see what drove the D- grade
The composite is a weighted blend of 9 inputs, each scored 0–100. Each bar is that input's sub-score; the figure is the points it added to the 100-point composite (weight × sub-score).
- Cash flow +7.9/30.0
- ARV discount +7.5/15.0
- Condition / age +4.8/5.0
- Rent growth +4.4/5.0
- Livability +3.9/5.0
- 1% rule +2.4/10.0
- Schools +2.3/10.0
- DSCR +2.0/10.0
- Appreciation +0.0/10.0
$52,000
🖨 Deal sheet 📄 Offer letter ✓ Due diligence
Listing remarks MLS
The Glentana manufactured housing community is in Rossville, GA, a revitalizing mill town 5 miles south of Chattanooga across the state line. Glentana offers residents close access to the Chattanooga job market but the affordability of a small town. The community is in the Chattanooga Valley at the base of Lookout Mountain. Glentana residents enjoy beautiful mountain views and all the natural beauty that the area has to offer. Glentana is served with a full-time, onsite property and sales manager. DRE# 8642853181
Key facts
- Listed 605 days
Tags
Neighborhood map
What this means for you Summary
Snapshot
- This is a 2-bed/2.0-bath single-family listed at $52k. Condition is rated excellent.
Deal economics
- At list price, monthly cash flow is $-601 ($-7k/yr) — negative.
- The deal already cash-flows at list — no discount required.
- Meets the 1% rule at list price ($1k rent vs $52k).
- Recommended offer: $46k (12.0% below list) — sets the bar for market timing.
- Cap rate 5.0% vs local median 3.4% in Chattanooga — top-decile yield for the area; either an underpriced asset or a hidden risk that comps aren't pricing in. Stress-test before assuming the spread holds.
Location & tenants
- Location reads 78/100 on livability (#3 in TN, #2,582 nationally) — a middle-class / working-renter tenant base. Strengths: amenities A+, commute A+, cost of living A+; Watch: employment D+, schools F, crime F.
- Walker County (rural): math 25% / reading 29% proficiency, ranked #114 of 174 in GA (top 66%) — low school quality limits family demand, transient renter base, plan for 1-2y turnover; 61% free/reduced lunch — lower-income household profile, screen leases tightly.
- Market conditions: Rents rising fast (+7.4%/yr); 21 comparable units currently listed for rent nearby; rentals at typical pace (median 23d on market — plan ~3-4 weeks tenant-placement turnaround); 347 units permitted in Walker County in 2024 (24 in 5+ unit buildings).
Forward outlook
- Local home prices are declining (-3.0%/yr); year-one equity from $1k of loan paydown is wiped out by about $5k of value loss. Plan a longer hold.
- Walker County population projected at -16% by 2050 — secular population decline; favor cash flow + early exit over multi-decade hold.
Negotiation context
- It's been on market 605 days — a 12% lower offer ($46k) is reasonable based on typical stale-listing flexibility.
Risks & watch-outs
- Watch-outs: property tax is 4.8% of price; flood insurance adds $427/mo.
- Climate carrying-cost: in FEMA flood zone AE (mandatory federal flood insurance); moderate wildfire risk; extreme-heat days projected 7→21/yr by 2055 (HVAC capex compounding) — expect insurance premiums to compound above CPI over the hold.
Questions for the listing agent
- What do current leases actually rent for vs. the listed asking? Can we see a recent rent roll and the last 12 months of T-12 income?
- It's been on market 605 days. Have you received any prior offers? Is the seller open to a 12% concession, seller financing, or rate buy-down credit?
- Property tax is high relative to price — has the assessment been appealed recently, and will the sale trigger a re-assessment?
- What's the actual annual flood-insurance premium (NFIP or private), and is the property in a SFHA with mandatory coverage?
- Why hasn't it sold? Are there any deal-killer items the seller is aware of (foundation, flood, title, zoning, code violations)?
- Is there a deadline driving the sale (1031 exchange, divorce, estate, relocation)? That informs how much negotiation room exists.
- Schools are F-rated, which usually means shorter tenancies and higher turnover. Who's the typical renter profile here, and what's been the actual vacancy rate?
- Crime grade is F in this area — have there been break-ins, vandalism, or insurance claims at this property in the last 3 years? What carrier currently insures it and at what premium?
- The area grade is low — what's the realistic commute time and amenity access for the typical tenant pool here? Any planned neighborhood developments (good or bad) we should know about?
- What's the average days-on-market for RENTAL listings here right now (not sales)? A rising rental-DOM trend means longer vacancies and softer asking-rent achievability than the comps imply.
- What's the recent tenant-quality profile in this submarket — average credit score on applications, eviction rate, late-payment / NSF rate, and stable-employment percentage? A property-management company in the area should have these aggregated.
- How much new for-sale + rental construction is in the pipeline within 1–3 miles? Heavy new supply typically softens prices + rents 12–24 months out; constrained supply supports both.
Investment metrics
- 1% rule
- 0.74% ✗
- Cap rate
- 5.02%
- Cash-on-cash
- -4.54%
- DSCR
- 0.80
- GRM
- 11.3
CMA / ARV
- ARV (median comp)
- $164,983
- List price
- $52,000
- Delta
- -68.48%
- Verdict
- UNDERPRICED
- Comps
- 20 within 1.0 mi
Show comp detail 7 sales within ~0.75 mi
| Address | Dist | Beds/Ba | Sqft | Sold | Price | $/sf | Match |
|---|---|---|---|---|---|---|---|
| 803 Lee Ave | 0.72mi | 2/1.5 | 815 (-1%) | 11mo | $149,000 | $183 | 54 |
| 801 Lee Ave | 0.72mi | 2/1.0 | 856 (+4%) | 2mo | $160,000 | $187 | 53 |
| 519 W Gordon Ave | 0.72mi | 2/1.0 | 841 (+3%) | 12mo | $165,000 | $196 | 48 |
| 712 Henderson Ave | 0.61mi | 2/1.0 | 928 (+13%) | 2mo | $135,000 | $145 | 44 |
| 602 Carden Ave | 0.63mi | 2/1.0 | 880 (+7%) | 16mo | $193,000 | $219 | 41 |
| 215 Spruce St | 0.74mi | 2/1.0 | 776 (-5%) | 17mo | $77,000 | $99 | 38 |
| 824 Henderson Ave | 0.70mi | 2/1.0 | 750 (-8%) | 20mo | $155,000 | $207 | 32 |
Match score weights: distance 35% · size 25% · config 20% · recency 20%. Top-matched comps best support the ARV.
Projected returns pro-forma
-3.0% appreciation · 7.44% rent growth · sell at horizon
- IRR
- -38.7%
- Equity multiple
- -0.28×
- Total profit
- $-59,056
- Equity at exit
- $24,600
- IRR
- -26.5%
- Equity multiple
- -0.60×
- Total profit
- $-73,960
- Equity at exit
- $14,265
Cash invested: $46,195 (down + closing). Projections, not guarantees.
Landlord ↔ Tenant lean methodology
- Overall (STATE)
- 87 Strongly Landlord-Friendly
- State Tennessee
- 87 Strongly Landlord-Friendly · R+13
- County
- — inherits STATE
- City
- — inherits STATE
ZIP-level market 30741
- Home prices YoY
- -30.7%
- Rents YoY
- 7.4%
- Price-to-rent
- 3.5×
Monthly cashflow live
- Estimated rent
- $1,222 high interval (Pro) →
- Mortgage (P&I)
- −$865
- Tax est. 1.5%
- −$206 /mo · $2,475/yr
- Insurance
- −$69
- Flood insurance flood zone
- −$427 /mo · $5,118/yr
- HOA
- −$0
- Vacancy / Maint / Mgmt
- −$257
- Net cashflow
- $-601
Break-even live
UW: 25.0% down · 7.5% · 30yr · 1.5% tax · 5.0% vac · 8.0% maint · 8.0% mgmt
Financing live
Cash to close
- Down payment
- $41,246
- Closing costs
- $4,950
- Reserves months
- —
- Total cash needed
- —
Loan-product check · same deal, 3 products live
Conventional
25% down · 7.5% · 30yr
- Down + closing
- —
- Monthly P&I
- —
- Monthly cashflow
- —
- DSCR
- —
- Eligible?
- —
Personal DTI + credit; lowest rate.
DSCR
20% down · 8.5% · 30yr
- Down + closing
- —
- Monthly P&I
- —
- Monthly cashflow
- —
- DSCR
- —
- Eligible?
- —
No personal income docs; deal must DSCR.
Hard money
10% down · 12.0% · 12mo
- Down + closing
- —
- Monthly P&I
- —
- Monthly cashflow
- —
- DSCR
- —
- Eligible?
- —
Short-term bridge; refi at stabilization.
Rent comps 21 comps
| Address | Beds | Baths | Sqft | Rent | $/sqft | DOM | Units | Dist |
|---|---|---|---|---|---|---|---|---|
| 1007 Glentana St Lot 62 Rossville, GA | 2.0 | 2.0 | 840 | $35,995 | $42.85 | 43d | 1 | 0.04mi |
| 817 Henderson Ave Rossville, GA | 2.0 | 1.0 | 844 | $1,150 | $1.36 | 13d | 1 | 0.63mi |
| 804 Henderson Ave Rossville, GA | 2.0 | 1.0 | 948 | $1,025 | $1.08 | 13d | 1 | 0.63mi |
| 505 Flegal Ave Rossville, GA | 2.0 | 1.0 | 768 | $1,050 | $1.37 | 23d | 1 | 0.63mi |
| 304 Cherry St Rossville, GA | 2.0 | 1.0 | 982 | $1,675 | $1.71 | 43d | 1 | 0.72mi |
| 515 W Gordon Ave Rossville, GA | 2.0 | 1.0 | 906 | $999 | $1.10 | 43d | 1 | 0.72mi |
| 1422 Wilson Rd Rossville, GA | 2.0 | 1.0 | 885 | $1,050 | $1.19 | 43d | 1 | 0.81mi |
| 1422 Wilson Rd Rossville, GA | 2.0 | 1.0 | 885 | $1,050 | $1.19 | 23d | 1 | 0.81mi |
| 5200 Fagan St Chattanooga, TN | 3.0 | 1.0 | 816 | $1,350 | $1.65 | 23d | 1 | 0.81mi |
| 5238 Dorsey St Unit A Chattanooga, TN | 2.0 | 1.0 | 839 | $950 | $1.13 | 23d | 1 | 0.88mi |
| 5505 Central Ave Chattanooga, TN | 3.0 | 2.0 | 1050 | $1,725 | $1.64 | 21d | 1 | 0.92mi |
| 108 Suggs St Rossville, GA | 2.0 | 1.0 | 900 | $1,525 | $1.69 | 13d | 1 | 0.95mi |
| 706 Roberta Dr Unit D Rossville, GA | 2.0 | 1.0 | 950 | $1,099 | $1.16 | 23d | 1 | 1.00mi |
| 1512 Wilson Rd Rossville, GA | 3.0 | 1.5 | 1100 | $1,295 | $1.18 | 23d | 1 | 1.05mi |
| 1512 Wilson Rd Rossville, GA | 3.0 | 1.5 | 1100 | $1,250 | $1.14 | 13d | 1 | 1.05mi |
| 4905 Central Ave Chattanooga, TN | 2.0–3.0 | 2.0 | 1169 | $556 | $0.48 | 13d | 2 | 1.21mi |
| 107 Stegall St Rossville, GA | 2.0 | 1.5 | 986 | $1,149 | $1.17 | 13d | 1 | 1.27mi |
| 1205 W 50th St Unit 2 Chattanooga, TN | 1.0 | 1.0 | 600 | $1,025 | $1.71 | 13d | 1 | 1.37mi |
| 5113 Tennessee Ave Unit 58 Chattanooga, TN | 1.0 | 1.0 | 700 | $950 | $1.36 | 23d | 1 | 1.40mi |
| 1591 Park City Rd Apt E15 Rossville, GA | 2.0 | 1.0 | 1050 | $1,145 | $1.09 | 23d | 1 | 1.44mi |
| 4129 Quinn Adams St Unit 2 Chattanooga, TN | 2.0 | 1.0 | 856 | $1,050 | $1.23 | 23d | 1 | 1.48mi |
Listing history 17 events
-
2026-06-18days on market $52,000 Active 605 DOM
-
2026-06-17days on market $52,000 Active 604 DOM
-
2026-06-16days on market $52,000 Active 603 DOM
-
2026-06-15days on market $52,000 Active 602 DOM
-
2026-06-14days on market $52,000 Active 600 DOM
-
2026-06-13days on market $52,000 Active 599 DOM
-
2026-06-10days on market $52,000 Active 597 DOM
-
2026-06-09days on market $52,000 Active 596 DOM
-
2026-06-08days on market $52,000 Active 595 DOM
-
2026-06-07days on market $52,000 Active 594 DOM
-
2026-06-05days on market $52,000 Active 591 DOM
-
2026-06-03days on market $52,000 Active 590 DOM
-
2026-06-02days on market $52,000 Active 589 DOM
-
2026-06-01days on market $52,000 Active 588 DOM
-
2026-05-31days on market $52,000 Active 587 DOM
-
2026-05-30days on market $52,000 Active 586 DOM
-
2024-10-21$52,000 Active 518-char remark
Show marketing remark (518 chars)
The Glentana manufactured housing community is in Rossville, GA, a revitalizing mill town 5 miles south of Chattanooga across the state line. Glentana offers residents close access to the Chattanooga job market but the affordability of a small town. The community is in the Chattanooga Valley at the base of Lookout Mountain. Glentana residents enjoy beautiful mountain views and all the natural beauty that the area has to offer. Glentana is served with a full-time, onsite property and sales manager. DRE# 8642853181
ⓘ Source: listings_history table (triggers on properties + properties_extension) + one-shot
backfill from property_details.listing_events for pre-trigger history.
Climate risk First Street
- Flood 9/10 Extreme FEMA zone AE · 99% chance over 30 yrs
- Wildfire 5/10 Major
- Heat 6/10 Major 7 d/yr ≥104°F today · 21 d/yr by 30 yrs out
- Wind 4/10 Moderate 12% chance of damaging wind over 30 yrs
- Air quality 3/10 Moderate 2 unhealthy d/yr today · 2 by 30 yrs out
Nearby sold comps map
Loading sold comps map…
Walkable amenities ~0.75 mi
Loading nearby amenities…
Taxation est. · year 1
- Rental income
- $14,662
- − Mortgage interest
- −$9,242
- − Property taxes
- −$2,475
- − Insurance
- −$5,943
- − Repairs & maintenance
- −$1,173
- − Management
- −$1,173
- − Depreciation
- −$4,800
- Taxable loss
- −$10,143
- Est. tax savings @ 24.0%
- +$2,434
- After-tax cash flow
- $-4,783/yr
For passive investors: Depreciation is non-cash, so a rental often shows a tax loss while cash-flowing — sheltering income. Rental losses are passive: they offset passive income freely, and up to $25,000/yr can offset ordinary (W-2) income if you actively participate and your MAGI is under $100k (phasing out to $0 by $150k); unused losses carry forward. On sale, claimed depreciation is recaptured at up to 25%, and gains may owe capital-gains tax (a 1031 exchange can defer both). Figures are a year-1 estimate at your 24.0% rate — not tax advice; consult a CPA.
Condition & rehab AI · 12 photos
This home is in excellent condition with a modern and well-maintained interior and exterior. It is move-in ready and has the potential for further value increases through minor updates.
Value-add opportunities
- Both Painting the exterior and interior walls — Fresh paint can enhance curb appeal and interior aesthetics.
- Both Landscaping improvements — Enhanced landscaping can improve curb appeal and attract potential buyers/tenants.
- Both Adding smart home features — Smart home features can increase the home's value and appeal to tech-savvy buyers/tenants.
- Both Upgrading the kitchen appliances — Modern appliances can make the kitchen more functional and appealing to potential buyers/tenants.
Renovation cost estimate screening
Value-add ROI direction
- Both Painting the exterior and interior walls — Fresh paint can enhance curb appeal and interior aesthetics. ↑
- Both Landscaping improvements — Enhanced landscaping can improve curb appeal and attract potential buyers/tenants. ↑
- Both Adding smart home features — Smart home features can increase the home's value and appeal to tech-savvy buyers/tenants. ↑
- Both Upgrading the kitchen appliances — Modern appliances can make the kitchen more functional and appealing to potential buyers/tenants. ↑
ⓘ Cost ranges are severity-bucket heuristics (US national rule-of-thumb). Get contractor quotes + a written scope before underwriting a rehab budget.
Schools (NCES district)
- District
- Walker County
- NCES district ID
- 1305370
- Math proficiency
- 25% ▼ -10.00%
- Reading proficiency
- 29% ▼ -10.00%
- Median HH income
- $39,889
- Composite
- 22.74/100
- National rank
- #8035
- State rank
- #114 of 174 in GA
Livability — Chattanooga
- Score
- 78/100
- State rank
- #3
- US rank
- #2582
Category grades
Schools grade is shown separately in the Schools card above.
Census & demographics
- County
- Walker County
- City population
- 131,999
- Metro
- Chattanooga, TN-GA
- Population (ZIP)
- 30,041
- Household income
- $58,834
- Rent vs Own
- Severe rent burden
- 834.0
Population outlook (Walker County) Hauer SSP2
- Today (2025)
- 66,050 people
- By 2030
- 64,305 · -2.6%
- By 2040
- 60,127 · -9.0%
- By 2050
- 55,551 · -15.9%
- By 2075
- 44,886 · -32.0%
- By 2100
- 34,015 · -48.5%
Race, ethnicity, and origin ACS 2023
- Neighborhood character
- Predominantly White (86%)
- Race & ethnicity
- White 86% Black 5% Two or more races 5% Hispanic / Latino 5%
- Common ancestry
- Slovak 3% Iranian 2% Italian 1%
- Foreign-born
- 2% · Canada
- Languages at home
- 96% English-only · Spanish 3%
Political lean MEDSL · Walker
- 2024 margin
- Solid R (+59.3) · D 20.1% · R 79.4%
- 2008→2024 swing
- -12.5pp toward R · 2008: -46.8pp · 2024: -59.3pp
- All cycles
- 2024: R+59.3 2020: R+59.3 2016: R+61.5 2012: R+50.2 2008: R+46.8
Not yet ingested
- Civics
- —
Market trends
- HPI YoY
- ▼ -118.05%
- Current HPI
- 267.0047
- Rent YoY
- ▲ 7.44%
- Metro
- Chattanooga, TN-GA
- State GDP YoY
- ▲ 2.78%
- F500 in state
- 22
Industry mix (Fortune 500 HQ in TN)
| Industry | F500 HQs | Revenue |
|---|---|---|
| Healthcare | 3 | $91B |
|
||
| Retail | 3 | $72B |
|
||
| Transportation / Logistics | 1 | $88B |
|
||
| Paper / Packaging | 1 | $19B |
|
||
| Insurance | 1 | $13B |
|
||
| Energy | 1 | $12B |
|
||
Price history
1 event — show timeline
- 2024-10-21 Listed $52,000 Zillow
Cash-flow waterfall
monthlySold comps — $/sqft
last 12 mo · ≤1 miLoading sold comps…