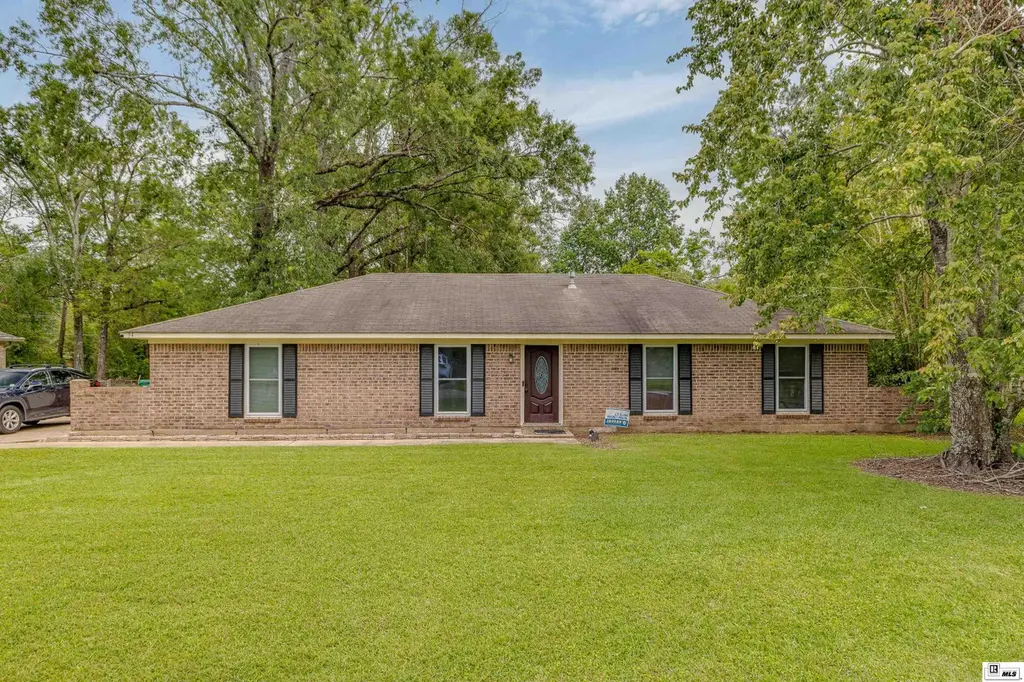
34 Forest Dr · Swartz, LA
Flood risk 6/10 · Moderate
- FEMA flood zone
- X (shaded)
- Chance of flooding over 30 yrs
- 0.75%
- Est. flood insurance / yr
- $507 – $1,088
Fire risk 3/10 · Minor
- Est. fire insurance / yr
- $1,269 – $2,357
Heat risk 7/10 · Major
- Hot days now (above 111°F)
- 7 days/yr
- Hot days in 30 yrs
- 20 days/yr
Wind risk 6/10 · Moderate
- Chance of severe wind over 30 yrs
- 74.0%
Air-quality risk 1/10 · Minimal
- Unhealthy air days now
- 0 days/yr
- Unhealthy air days in 30 yrs
- 0 days/yr
Risk factors via First Street. Map © Google.
Why this score? — see what drove the D grade
The composite is a weighted blend of 9 inputs, each scored 0–100. Each bar is that input's sub-score; the figure is the points it added to the 100-point composite (weight × sub-score).
- Cash flow +15.8/30.0
- ARV discount +6.6/15.0
- DSCR +4.9/10.0
- 1% rule +3.9/10.0
- Schools +3.2/10.0
- Livability +3.2/5.0
- Rent growth +2.5/5.0
- Condition / age +2.5/5.0
- Appreciation +0.0/10.0
$200,000
🖨 Deal sheet (PDF) 📄 Offer letter ✓ Due diligence
Listing remarks
Charming 3-bedroom, 2 bath home featuring a spacious living area with beautiful wood beams and a high arched ceiling that adds warmth and character. The kitchen offers granite countertops and great functionality for everyday living and entertaining. Enjoy the enclosed patio overlooking the large, fenced backyard — perfect for relaxing, gatherings, or pets. Property also includes a convenient storage shed for extra space and organization.
Key facts
- Spacious living area
- Storage shed
- Granite countertops
Tags
Property features AI
Finance
- HOA & community: No association amenities
Exterior
- Parking: Attached 2-car garage; Additional open parking
- Utilities: Public water; Public sewer; Natural gas available and connected
- Home design: Single-family residence; Site-built home; One story; Entry at level 1
- Construction: Brick veneer construction; Asphalt roof; Slab foundation; Built on a 0.88-acre lot
- Exterior features: Covered patio/porch; Chain link fencing; Landscaped, cleared lot; Paved road access
Interior
- Kitchen: Disposal; Gas water heater
- Bedrooms: 3 main-level bedrooms
- Bathrooms: 2 full bathrooms (both on the main level)
- Heating & cooling: Central heating (natural gas); Central air conditioning; Ceiling fans
- Interior features: Ceiling fans; Double-pane windows; Disposal; Gas water heater
Neighborhood map
What this means for you Summary
Snapshot
- This is a 3-bed/2.0-bath single-family listed at $200k.
Deal economics
- At list price, monthly cash flow is $92 ($1k/yr) — positive.
- The deal already cash-flows at list — no discount required.
- To meet the 1% rule (rent ≥ 1% of price), the offer needs to be $178k (11.1% below list).
- Recommended offer: $178k (11.1% below list) — sets the bar for 1% rule.
Location & tenants
- Location reads 64/100 on livability (#184 in LA) — a middle-class / working-renter tenant base. Strengths: cost of living A+, housing A+; Watch: crime C-, health & safety D, amenities F.
- Ouachita Parish (suburban): math 31% / reading 45% proficiency, ranked #26 of 98 in LA (top 26%) — families likely to look elsewhere, expect single-tenant / working-renter base with shorter leases.
- Zoned schools: Swartz Lower Elementary School (392 students, 67% FRL); Ouachita Junior High School (math 12% / reading 25%, grade F, #169 of 218 statewide, top 78%, 422 students, 80% FRL); Ouachita Parish High School (math 23% / reading 31%, grade F, #136 of 265 statewide, top 55%, 1,191 students, 66% FRL) — zoned schools average 71% FRL vs 52% district-wide (20 pts higher); higher-poverty schools than district average — tighter screening recommended.
- Zoned-school proficiency averages 23% at this address vs 38% district-wide (-15 pts) — the specific schools serving this property underperform the Ouachita Parish average; the district grade overstates school quality for this exact location.
- Market conditions: 440 active listings in the ZIP; 1 comparable units currently listed for rent nearby; 345 units permitted in Ouachita Parish in 2024 (0 in 5+ unit buildings).
- This rent runs 41% of the median local income ($52k/yr) — at the standard rent-burdened threshold; future hikes will face affordability resistance.
Forward outlook
- Local home prices are declining (-3.0%/yr); year-one equity from $1k of loan paydown is wiped out by about $6k of value loss. Plan a longer hold.
Negotiation context
- Only 2 days on market — expect competitive offers; lowballing is unlikely to land.
- Current owner paid $160k; 25% above their basis — modest negotiation headroom, anchor on the comps not their cost.
Risks & watch-outs
- Climate carrying-cost: major flood risk; major wind risk, 74% chance of damaging wind over 30y; extreme-heat days projected 7→20/yr by 2055 (HVAC capex compounding) — expect insurance premiums to compound above CPI over the hold.
Questions for the listing agent
- Built in 1972 — when were the roof, HVAC, electrical panel, plumbing, and water heater last replaced?
- Is there a deadline driving the sale (1031 exchange, divorce, estate, relocation)? That informs how much negotiation room exists.
- The area grade is low — what's the realistic commute time and amenity access for the typical tenant pool here? Any planned neighborhood developments (good or bad) we should know about?
- What's the average days-on-market for RENTAL listings here right now (not sales)? A rising rental-DOM trend means longer vacancies and softer asking-rent achievability than the comps imply.
- What's the recent tenant-quality profile in this submarket — average credit score on applications, eviction rate, late-payment / NSF rate, and stable-employment percentage? A property-management company in the area should have these aggregated.
- How much new for-sale + rental construction is in the pipeline within 1–3 miles? Heavy new supply typically softens prices + rents 12–24 months out; constrained supply supports both.
Investment metrics
- 1% rule
- 0.89% ✗
- Cap rate
- 6.85%
- Cash-on-cash
- 1.98%
- DSCR
- 1.09
- GRM
- 9.4
CMA / ARV
- ARV (median comp)
- $195,932
- List price
- $200,000
- Delta
- 2.08%
- Verdict
- FAIR
- Comps
- 20 within 1.0 mi
Show comp detail 10 sales within ~0.75 mi
| Address | Dist | Beds/Ba | Sqft | Sold | Price | $/sf | Match |
|---|---|---|---|---|---|---|---|
| 26 Forest Dr | 0.07mi | 3/2.0 | 1,708 (-0%) | 6mo | $180,000 | $105 | 91 |
| 15 Chauvin Dr | 0.17mi | 4/2.0 (+1) | 1,769 (+4%) | 7mo | $135,000 | $76 | 75 |
| 213 Timber Ln | 0.19mi | 3/2.0 | 1,456 (-15%) | 5mo | $181,300 | $125 | 62 |
| 36 Winchester Cir | 0.61mi | 3/2.0 | 1,663 (-3%) | 9mo | $189,900 | $114 | 59 |
| 57 Chauvin Dr | 0.17mi | 4/2.0 (+1) | 1,917 (+12%) | 9mo | $192,000 | $100 | 59 |
| 42 Winchester Cir | 0.56mi | 3/2.0 | 1,670 (-2%) | 14mo | $200,000 | $120 | 59 |
| 102 Arapaho Dr | 0.75mi | 3/2.0 | 1,662 (-3%) | 12mo | $199,999 | $120 | 50 |
| 158 Timberlane Dr | 0.69mi | 4/3.5 (+1) | 1,770 (+4%) | 8mo | $198,000 | $112 | 44 |
| 14 Luray Dr | 0.62mi | 3/2.0 | 1,906 (+12%) | 11mo | $192,000 | $101 | 43 |
| 212 Vail Dr | 0.68mi | 3/2.0 | 1,612 (-6%) | 23mo | $215,000 | $133 | 40 |
Match score weights: distance 35% · size 25% · config 20% · recency 20%. Top-matched comps best support the ARV.
Projected returns pro-forma
-3.0% appreciation · 3.0% rent growth · sell at horizon
- IRR
- -13.2%
- Equity multiple
- 0.53×
- Total profit
- $-26,541
- Equity at exit
- $29,821
- IRR
- -4.2%
- Equity multiple
- 0.72×
- Total profit
- $-15,600
- Equity at exit
- $17,292
Cash invested: $56,000 (down + closing). Projections, not guarantees.
Landlord ↔ Tenant lean methodology
- Overall (STATE)
- 90 Strongly Landlord-Friendly
- State Louisiana
- 90 Strongly Landlord-Friendly · R+12
- County
- — inherits STATE
- City
- — inherits STATE
ZIP-level market 71203
- Home prices YoY
- -32.4%
- Active inventory
- 440
- Price-to-rent
- 9.4×
Monthly cashflow live
- Estimated rent
- $1,778 medium interval (Pro) →
- Mortgage (P&I)
- −$1,049
- Tax from tax record
- −$180 /mo · $2,162/yr
- Insurance
- −$83
- HOA
- −$0
- Vacancy / Maint / Mgmt
- −$373
- Net cashflow
- $92
Break-even live
Sensitivity live
| Price | -10% $206 | -5% $149 | +0% $92 | +5% $36 | +10% $-21 |
|---|---|---|---|---|---|
| Rent | -10% $-48 | -5% $22 | +0% $92 | +5% $163 | +10% $233 |
| Rate | -1.0pp $193 | -0.5pp $143 | base $92 | +0.5pp $41 | +1.0pp $-12 |
UW: 25.0% down · 7.5% · 30yr · 1.5% tax · 5.0% vac · 8.0% maint · 8.0% mgmt
Financing live
Cash to close
- Down payment
- $50,000
- Closing costs
- $6,000
- Reserves months
- —
- Total cash needed
- —
Loan-product check · same deal, 3 products live
Conventional
25% down · 7.5% · 30yr
- Down + closing
- —
- Monthly P&I
- —
- Monthly cashflow
- —
- DSCR
- —
- Eligible?
- —
Personal DTI + credit; lowest rate.
DSCR
20% down · 8.5% · 30yr
- Down + closing
- —
- Monthly P&I
- —
- Monthly cashflow
- —
- DSCR
- —
- Eligible?
- —
No personal income docs; deal must DSCR.
Hard money
10% down · 12.0% · 12mo
- Down + closing
- —
- Monthly P&I
- —
- Monthly cashflow
- —
- DSCR
- —
- Eligible?
- —
Short-term bridge; refi at stabilization.
Rent comps 1 comps
| Address | Beds | Baths | Sqft | Rent | $/sqft | DOM | Units | Dist |
|---|---|---|---|---|---|---|---|---|
| 396 Rowland Rd Monroe, LA | 4.0 | 2.5 | 2226 | $2,500 | $1.12 | 45d | 1 | 0.48mi |
Listing history 6 events
-
2026-05-16status Pending 447-char remark
-
2026-05-14$200,000 Active 447-char remark
-
2026-03-06soldstatus $160,000
-
2008-05-05soldstatus
-
2005-08-01soldstatus
-
2003-09-01soldstatus
ⓘ Source: listings_history table (triggers on properties + properties_extension) + one-shot
backfill from property_details.listing_events for pre-trigger history.
Tax reassessment forecast LA · Resets to sale price
- Current annual tax
- $2,162 · $180/mo
- Projected year-2 tax
- $2,162 · $180/mo
- Expected delta
- $0/yr ($0/mo · 0.0%)
ⓘ Screening estimate from a state-policy table — verify with the county assessor before closing.
Climate risk First Street
- Flood 6/10 Major FEMA zone X (shaded) · 75% chance over 30 yrs
- Wildfire 3/10 Moderate
- Heat 7/10 Severe 7 d/yr ≥111°F today · 20 d/yr by 30 yrs out
- Wind 6/10 Major 74% chance of damaging wind over 30 yrs
- Air quality 1/10 Low 0 unhealthy d/yr today · 0 by 30 yrs out
Nearby sold comps map
Loading sold comps map…
Walkable amenities ~0.75 mi
Loading nearby amenities…
Taxation est. · year 1
- Rental income
- $21,338
- − Mortgage interest
- −$11,203
- − Property taxes
- −$2,162
- − Insurance
- −$1,000
- − Repairs & maintenance
- −$1,707
- − Management
- −$1,707
- − Depreciation
- −$5,818
- Taxable loss
- −$2,260
- Est. tax savings @ 24.0%
- +$542
- After-tax cash flow
- $1,651/yr
For passive investors: Depreciation is non-cash, so a rental often shows a tax loss while cash-flowing — sheltering income. Rental losses are passive: they offset passive income freely, and up to $25,000/yr can offset ordinary (W-2) income if you actively participate and your MAGI is under $100k (phasing out to $0 by $150k); unused losses carry forward. On sale, claimed depreciation is recaptured at up to 25%, and gains may owe capital-gains tax (a 1031 exchange can defer both). Figures are a year-1 estimate at your 24.0% rate — not tax advice; consult a CPA.
Schools (NCES district)
- District
- Ouachita Parish
- NCES district ID
- 2201200
- Math proficiency
- 31% ▼ -38.00%
- Reading proficiency
- 45% ▼ -31.00%
- Median HH income
- $43,316
- Composite
- 32.14/100
- National rank
- #5791
- State rank
- #26 of 98 in LA
Livability — Swartz
- Score
- 64/100
- State rank
- #184
- US rank
- #14862
Category grades
Schools grade is shown separately in the Schools card above.
Census & demographics
- Census place
- Swartz, LA
- County
- Ouachita Parish · 118,340 people
- Metro
- Monroe, LA
- Population (ZIP)
- 38,354
- Household income
- $52,326
- Rent vs Own
- Severe rent burden
- 2085.0
Population outlook (Ouachita County) Hauer SSP2
- Today (2025)
- 163,370 people
- By 2030
- 165,520 · +1.3%
- By 2040
- 167,652 · +2.6%
- By 2050
- 166,699 · +2.0%
- By 2075
- 156,348 · -4.3%
- By 2100
- 134,102 · -17.9%
Race, ethnicity, and origin ACS 2023
- Neighborhood character
- Diverse neighborhood (Simpson 0.57)
- Race & ethnicity
- Black 48% White 45% Two or more races 4% Hispanic / Latino 3% Asian 1%
- Common ancestry
- Lithuanian 3% Slovak 1% Serbian 1%
- Foreign-born
- 3% · Canada
- Languages at home
- 96% English-only · Spanish 2% Other Indo-European 1%
Political lean MEDSL · Ouachita
- 2024 margin
- Strong R (+27.9) · D 35.5% · R 63.3% · Other 1.2%
- 2008→2024 swing
- -2.7pp toward R · 2008: -25.2pp · 2024: -27.9pp
- All cycles
- 2024: R+27.9 2020: R+23.6 2016: R+25.4 2012: R+20.9 2008: R+25.2
Not yet ingested
- Civics
- —
Market trends
- HPI YoY
- ▼ -99.01%
- Current HPI
- 206.1948
- Rent YoY
- —
- Metro
- Monroe, LA
- State GDP YoY
- ▲ 3.29%
- F500 in state
- 10
Industry mix (Fortune 500 HQ in LA)
| Industry | F500 HQs | Revenue |
|---|---|---|
| Telecommunications | 2 | $23B |
|
||
| Utilities | 1 | $12B |
|
||
| Wholesale / Distribution | 1 | $5B |
|
||
| Advertising | 1 | $2B |
|
||
Price history
+25.0% since first listed6 events — show timeline
- 2026-05-16 Pending — NELABOR
- 2026-05-14 Listed $200,000 NELABOR
- 2026-03-06 Sold (Public Records) $160,000 Public Records
- 2008-05-05 Sold (Public Records) — Public Records
- 2005-08-01 Sold (Public Records) — Public Records
- 2003-09-01 Sold (Public Records) — Public Records
Property tax history
+4.1%/yrLatest (2025): $2,162 · -0.7% YoY. Source: county tax records.
Cash-flow waterfall
monthlySold comps — $/sqft
last 12 mo · ≤1 miLoading sold comps…