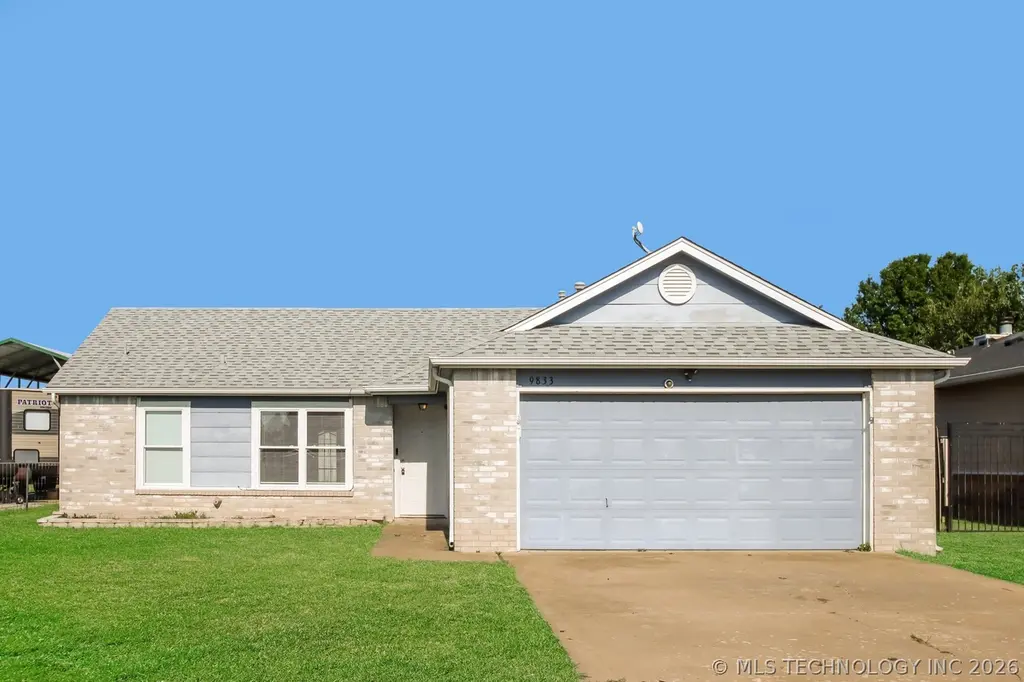
9833 N 43rd East Ave · Tulsa, OK
Flood risk 4/10 · Minor
- FEMA flood zone
- X (unshaded)
- Chance of flooding over 30 yrs
- 0.22%
- Est. flood insurance / yr
- $473 – $860
Fire risk 7/10 · Major
- Est. fire insurance / yr
- $2,463 – $4,575
Heat risk 7/10 · Major
- Hot days now (above 110°F)
- 7 days/yr
- Hot days in 30 yrs
- 20 days/yr
Wind risk 2/10 · Minimal
- Chance of severe wind over 30 yrs
- 4.0%
Air-quality risk 3/10 · Minor
- Unhealthy air days now
- 2 days/yr
- Unhealthy air days in 30 yrs
- 3 days/yr
Risk factors via First Street. Map © Google.
Why this score? — see what drove the D grade
The composite is a weighted blend of 9 inputs, each scored 0–100. Each bar is that input's sub-score; the figure is the points it added to the 100-point composite (weight × sub-score).
- Cash flow +11.8/30.0
- Appreciation +9.0/10.0
- Livability +3.8/5.0
- ARV discount +3.6/15.0
- DSCR +3.5/10.0
- 1% rule +3.0/10.0
- Rent growth +2.5/5.0
- Condition / age +2.5/5.0
- Schools +2.1/10.0
$205,000
🖨 Deal sheet (PDF) 📄 Offer letter ✓ Due diligence
Listing remarks MLS
This 3 bedroom/ 2bathroom with garage is move in ready! Built in 2018, this home has been well maintained and is ready for new owners. Cosmetically appealing as well as functional with open floor plan, tile flooring, granite counters in kitchen and newer carpet in bedrooms. Located right off of HWY 75 makes this location an easy commute. Whether you are looking to purchase a personal home, or an investor looking to increase your portfolio with a move in ready property this home is for you. This home does qualify for a rural development loan.
Key facts
- Welcoming patio
- Updated residence
- Fenced backyard
Tags
Property features AI
Finance
- HOA & community: Homeowners association with an annual fee of $436
Exterior
- Parking: Attached garage; 2-car garage
- Security: No safety shelter
- Utilities: Electricity available; Natural gas available; Public water; Public sewer
- Home design: Single-story; Faces north; Slab foundation
- Construction: Built with brick veneer and wood frame; Asphalt/fiberglass roof; Year built source: Appraiser
- Exterior features: No additional exterior features listed; Smoke detector(s)
Interior
- Kitchen: Dishwasher; Oven; Range; Stove; Electric water heater
- Flooring: Carpet; Tile
- Bathrooms: 2 full bathrooms
- Heating & cooling: Central heating; Gas heating
- Interior features: Granite counters; Ceiling fan(s); Vinyl windows
- Laundry & utility: Washer hookup; Gas dryer hookup
Neighborhood map
What this means for you Summary
Snapshot
- This is a 3-bed/2.0-bath single-family listed at $205k.
Deal economics
- At list price, monthly cash flow is $-58 ($-697/yr) — negative.
- To cash-flow at today's rent, offer at most $195k (5.0% below list).
- To meet the 1% rule (rent ≥ 1% of price), the offer needs to be $164k (19.9% below list).
- Recommended offer: $164k (19.9% below list) — sets the bar for 1% rule.
- Cap rate 6.0% vs local median 3.8% in Tulsa — top-decile yield for the area; either an underpriced asset or a hidden risk that comps aren't pricing in. Stress-test before assuming the spread holds.
Location & tenants
- Location reads 75/100 on livability (#13 in OK, #4,058 nationally) — a middle-class / working-renter tenant base. Strengths: amenities A+, commute A+, cost of living A+; Watch: crime F, employment D-.
- Sperry (rural): math 21% / reading 26% proficiency, ranked #114 of 270 in OK (top 42%) — low school quality limits family demand, transient renter base, plan for 1-2y turnover.
- Zoned schools: Sperry Es (math 30% / reading 31%, grade F, #247 of 845 statewide, top 30%, 520 students, 0% FRL); Sperry Ms (math 13% / reading 21%, grade F, #193 of 345 statewide, top 60%, 232 students, 0% FRL); Sperry Hs (math 15% / reading 24%, grade F, #274 of 447 statewide, top 66%, 329 students, 0% FRL) — zoned schools average 0% FRL vs 52% district-wide (52 pts lower); this property's tenant base skews higher-income than the district average.
- Market conditions: 62 active listings in the ZIP; 2,818 units permitted in Tulsa County in 2024 (518 in 5+ unit buildings).
Forward outlook
- In year one you build about $18k of equity ($1k loan paydown + $16k appreciation (7.9% local appreciation)).
- Tulsa County population projected at +30% by 2050 — long-run rental-demand tailwind backs the buy-and-hold thesis.
- At projected returns (7.9% appreciation + 3.0% rent growth), your $57k cash investment doubles in ~4 years — after that, you're playing with house money.
- By year 3, paydown + projected appreciation supports a ~$44k cash-out refi (75% LTV) — recoverable capital for the next deal without selling this one.
Negotiation context
- Only 3 days on market — expect competitive offers; lowballing is unlikely to land.
- 10 sale attempts since 26y ago with the ask held roughly flat each time — persistent listings suggest the price (not the market) is what's stuck; bring a comps-based counter.
Risks & watch-outs
- Climate carrying-cost: major wildfire risk; extreme-heat days projected 7→20/yr by 2055 (HVAC capex compounding) — expect insurance premiums to compound above CPI over the hold.
Questions for the listing agent
- What do current leases actually rent for vs. the listed asking? Can we see a recent rent roll and the last 12 months of T-12 income?
- What does the HOA fee cover, when was the last increase, and are there any pending special assessments or reserve-fund shortfalls?
- Is there a deadline driving the sale (1031 exchange, divorce, estate, relocation)? That informs how much negotiation room exists.
- Schools are F-rated, which usually means shorter tenancies and higher turnover. Who's the typical renter profile here, and what's been the actual vacancy rate?
- Crime grade is F in this area — have there been break-ins, vandalism, or insurance claims at this property in the last 3 years? What carrier currently insures it and at what premium?
- The area grade is low — what's the realistic commute time and amenity access for the typical tenant pool here? Any planned neighborhood developments (good or bad) we should know about?
- What's the average days-on-market for RENTAL listings here right now (not sales)? A rising rental-DOM trend means longer vacancies and softer asking-rent achievability than the comps imply.
- What's the recent tenant-quality profile in this submarket — average credit score on applications, eviction rate, late-payment / NSF rate, and stable-employment percentage? A property-management company in the area should have these aggregated.
- How much new for-sale + rental construction is in the pipeline within 1–3 miles? Heavy new supply typically softens prices + rents 12–24 months out; constrained supply supports both.
Investment metrics
- 1% rule
- 0.80% ✗
- Cap rate
- 5.95%
- Cash-on-cash
- -1.21%
- DSCR
- 0.95
- GRM
- 10.4
CMA / ARV
- ARV (on-the-fly)
- $188,760
- Comps found
- 8
Show comp detail 8 sales within ~0.75 mi
| Address | Dist | Beds/Ba | Sqft | Sold | Price | $/sf | Match |
|---|---|---|---|---|---|---|---|
| 9918 N 44th East Ave | 0.06mi | 3/2.0 | 1,134 (-1%) | 7mo | $191,000 | $168 | 90 |
| 9833 N 43rd EastAvenue | 0.00mi | 3/2.0 | 1,219 (+7%) | 6mo | $199,000 | $163 | 84 |
| 10003 N 43rd EastAvenue | 0.11mi | 3/2.0 | 1,204 (+5%) | 4mo | $203,500 | $169 | 83 |
| 10002 N 43rd EastAvenue | 0.12mi | 3/2.0 | 1,205 (+5%) | 13mo | $185,000 | $154 | 75 |
| 9718 N 44th EastAvenue | 0.13mi | 3/2.0 | 1,100 (-4%) | 18mo | $175,000 | $159 | 72 |
| 4212 E 101st St | 0.18mi | 3/2.0 | 1,121 (-2%) | 22mo | $170,000 | $152 | 70 |
| 10025 N 44th Ave E | 0.20mi | 3/2.0 | 1,195 (+4%) | 19mo | $200,000 | $167 | 68 |
| 4320 E 101st St N | 0.18mi | 3/2.0 | 1,246 (+9%) | 14mo | $206,000 | $165 | 65 |
Match score weights: distance 35% · size 25% · config 20% · recency 20%. Top-matched comps best support the ARV.
Projected returns pro-forma
7.92% appreciation · 3.0% rent growth · sell at horizon
- IRR
- 18.9%
- Equity multiple
- 2.39×
- Total profit
- $79,738
- Equity at exit
- $154,682
- IRR
- 17.7%
- Equity multiple
- 5.08×
- Total profit
- $234,038
- Equity at exit
- $306,036
Cash invested: $57,400 (down + closing). Projections, not guarantees.
Landlord ↔ Tenant lean methodology
- Overall (STATE)
- 83 Strongly Landlord-Friendly
- State Oklahoma
- 83 Strongly Landlord-Friendly · R+20
- County
- — inherits STATE
- City
- — inherits STATE
ZIP-level market 74073
- Home prices YoY
- 3.0%
- Active inventory
- 62
- Price-to-rent
- 10.4×
Monthly cashflow live
- Estimated rent
- $1,643 medium interval (Pro) →
- Mortgage (P&I)
- −$1,075
- Tax from tax record
- −$159 /mo · $1,912/yr
- Insurance
- −$85
- HOA
- −$36
- Vacancy / Maint / Mgmt
- −$345
- Net cashflow
- $-58
Break-even live
Sensitivity live
| Price | -10% $58 | -5% $0 | +0% $-58 | +5% $-116 | +10% $-174 |
|---|---|---|---|---|---|
| Rent | -10% $-188 | -5% $-123 | +0% $-58 | +5% $7 | +10% $72 |
| Rate | -1.0pp $45 | -0.5pp $-6 | base $-58 | +0.5pp $-111 | +1.0pp $-165 |
UW: 25.0% down · 7.5% · 30yr · 1.5% tax · 5.0% vac · 8.0% maint · 8.0% mgmt
Financing live
Cash to close
- Down payment
- $51,250
- Closing costs
- $6,150
- Reserves months
- —
- Total cash needed
- —
Loan-product check · same deal, 3 products live
Conventional
25% down · 7.5% · 30yr
- Down + closing
- —
- Monthly P&I
- —
- Monthly cashflow
- —
- DSCR
- —
- Eligible?
- —
Personal DTI + credit; lowest rate.
DSCR
20% down · 8.5% · 30yr
- Down + closing
- —
- Monthly P&I
- —
- Monthly cashflow
- —
- DSCR
- —
- Eligible?
- —
No personal income docs; deal must DSCR.
Hard money
10% down · 12.0% · 12mo
- Down + closing
- —
- Monthly P&I
- —
- Monthly cashflow
- —
- DSCR
- —
- Eligible?
- —
Short-term bridge; refi at stabilization.
HOA detail
- Monthly dues
- $36 · $432/yr
Listing history 3 events
-
2026-06-22days on market $205,000 Active 3 DOM
-
2026-06-18remarks 450-char remark
-
2026-06-18$205,000 Active 1 DOM
ⓘ Source: listings_history table (triggers on properties + properties_extension) + one-shot
backfill from property_details.listing_events for pre-trigger history.
Tax reassessment forecast OK · Resets to sale price
- Current annual tax
- $1,912 · $159/mo
- Projected year-2 tax
- $1,912 · $159/mo
- Expected delta
- $0/yr ($0/mo · 0.0%)
ⓘ Screening estimate from a state-policy table — verify with the county assessor before closing.
Climate risk First Street
- Flood 4/10 Moderate FEMA zone X (unshaded) · 22% chance over 30 yrs
- Wildfire 7/10 Severe
- Heat 7/10 Severe 7 d/yr ≥110°F today · 20 d/yr by 30 yrs out
- Wind 2/10 Low 4% chance of damaging wind over 30 yrs
- Air quality 3/10 Moderate 2 unhealthy d/yr today · 3 by 30 yrs out
Nearby sold comps map
Loading sold comps map…
Walkable amenities ~0.75 mi
Loading nearby amenities…
Taxation est. · year 1
- Rental income
- $19,712
- − Mortgage interest
- −$11,483
- − Property taxes
- −$1,912
- − Insurance
- −$1,025
- − Repairs & maintenance
- −$1,577
- − Management
- −$1,577
- − HOA
- −$432
- − Depreciation
- −$5,964
- Taxable loss
- −$4,258
- Est. tax savings @ 24.0%
- +$1,022
- After-tax cash flow
- $325/yr
For passive investors: Depreciation is non-cash, so a rental often shows a tax loss while cash-flowing — sheltering income. Rental losses are passive: they offset passive income freely, and up to $25,000/yr can offset ordinary (W-2) income if you actively participate and your MAGI is under $100k (phasing out to $0 by $150k); unused losses carry forward. On sale, claimed depreciation is recaptured at up to 25%, and gains may owe capital-gains tax (a 1031 exchange can defer both). Figures are a year-1 estimate at your 24.0% rate — not tax advice; consult a CPA.
Schools (NCES district)
- District
- Sperry
- NCES district ID
- 4028170
- Math proficiency
- 21% ▼ -9.00%
- Reading proficiency
- 26% ▼ -10.00%
- Median HH income
- $52,187
- Composite
- 21.01/100
- National rank
- #8455
- State rank
- #114 of 270 in OK
Livability — Tulsa
- Score
- 75/100
- State rank
- #13
- US rank
- #4058
Category grades
Schools grade is shown separately in the Schools card above.
Census & demographics
- City population
- 389,418
- Population (ZIP)
- 5,610
Population outlook (Tulsa County) Hauer SSP2
- Today (2025)
- 723,846 people
- By 2030
- 766,033 · +5.8%
- By 2040
- 851,386 · +17.6%
- By 2050
- 938,389 · +29.6%
- By 2075
- 1,166,011 · +61.1%
- By 2100
- 1,350,277 · +86.5%
Race, ethnicity, and origin ACS 2023
- Neighborhood character
- Predominantly White (67%)
- Race & ethnicity
- White 67% Two or more races 16% Native American 7% Hispanic / Latino 6% Asian 3% Black 2%
- Hispanic origin (detail)
- Mexican 5%
- Common ancestry
- Lithuanian 2% Slovak 2% Iranian 2%
- Foreign-born
- 2% · Canada
- Languages at home
- 93% English-only · Spanish 4% Other Asian/Pacific 2% Russian/Polish/Slavic 1%
Political lean MEDSL · Tulsa
- 2024 margin
- R (+15.2) · D 41.3% · R 56.5% · Other 2.2%
- 2008→2024 swing
- +9.2pp toward D · 2008: -24.5pp · 2024: -15.2pp
- All cycles
- 2024: R+15.2 2020: R+15.6 2016: R+22.9 2012: R+27.4 2008: R+24.5
Not yet ingested
- Civics
- —
Market trends
- HPI YoY
- ▲ 7.92%
- Current HPI
- 268.133
- Rent YoY
- —
- Metro
- —
- State GDP YoY
- ▲ 1.55%
- F500 in state
- 6
Industry mix (Fortune 500 HQ in OK)
| Industry | F500 HQs | Revenue |
|---|---|---|
| Energy | 3 | $48B |
|
||
Price history
+181.2% since first listed31 events — show timeline
- 2026-06-18 Listed $205,000 MLS Technology, Inc.
- 2026-01-02 Sold (MLS) $199,000 MLS Technology, Inc.
- 2025-11-15 Pending — MLS Technology, Inc.
- 2025-11-07 Listed $199,000 MLS Technology, Inc.
- 2022-03-28 Sold (Public Records) $143,000 Public Records
- 2022-03-11 Sold (MLS) $143,000 MLS Technology, Inc.
- 2022-02-15 Listing Removed — MLS Technology, Inc.
- 2022-02-14 Listed $143,000 MLS Technology, Inc.
- 2019-04-23 Sold (Public Records) $115,000 Public Records
- 2019-04-17 Sold (MLS) $115,000 MLS Technology, Inc.
- 2019-03-05 Pending — MLS Technology, Inc.
- 2019-02-14 Listed $117,500 MLS Technology, Inc.
- 2017-12-21 Listing Removed — MLS Technology, Inc.
- 2017-12-09 Price Changed $105,000 MLS Technology, Inc.
- 2017-12-09 Relisted — MLS Technology, Inc.
- 2017-11-16 Pending — MLS Technology, Inc.
- 2017-11-03 Listed $110,000 MLS Technology, Inc.
- 2013-06-07 Listing Removed — MLS Technology, Inc.
- 2013-02-25 Listed $112,000 MLS Technology, Inc.
- 2009-11-30 Sold (Public Records) $108,000 Public Records
- 2009-11-19 Sold (MLS) $107,900 MLS Technology, Inc.
- 2009-10-20 Listing Removed — MLS Technology, Inc.
- 2009-10-07 Listed $104,900 MLS Technology, Inc.
- 2008-10-02 Sold (Public Records) $89,000 Public Records
- 2008-09-25 Sold (MLS) $88,750 MLS Technology, Inc.
- 2008-08-22 Listing Removed — MLS Technology, Inc.
- 2008-05-24 Listed $92,000 MLS Technology, Inc.
- 2000-06-21 Sold (Public Records) $75,000 Public Records
- 2000-06-20 Sold (MLS) $75,000 MLS Technology, Inc.
- 2000-05-09 Listing Removed — MLS Technology, Inc.
- 2000-05-03 Listed $72,900 MLS Technology, Inc.
Property tax history
+6.6%/yrLatest (2025): $1,912 · +5.1% YoY. Source: county tax records.
Cash-flow waterfall
monthlySold comps — $/sqft
last 12 mo · ≤1 miLoading sold comps…