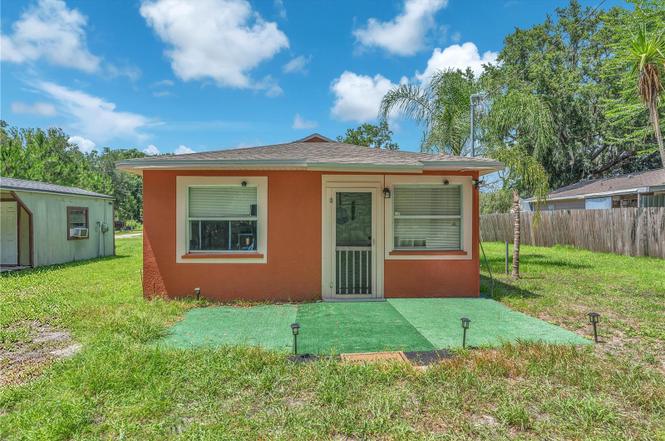
1006 Gray St · Plant City, FL
Flood risk 1/10 · Minimal
- FEMA flood zone
- X (unshaded)
- Chance of flooding over 30 yrs
- 0.0%
- Est. flood insurance / yr
- $507 – $1,088
Fire risk 4/10 · Minor
- Est. fire insurance / yr
- $947 – $1,759
Heat risk 9/10 · Severe
- Hot days now (above 108°F)
- 7 days/yr
- Hot days in 30 yrs
- 22 days/yr
Wind risk 9/10 · Severe
- Chance of severe wind over 30 yrs
- 99.0%
Air-quality risk 3/10 · Minor
- Unhealthy air days now
- 2 days/yr
- Unhealthy air days in 30 yrs
- 3 days/yr
Risk factors via First Street. Map © Google.
Why this score? — see what drove the C- grade
The composite is a weighted blend of 9 inputs, each scored 0–100. Each bar is that input's sub-score; the figure is the points it added to the 100-point composite (weight × sub-score).
- Cash flow +21.3/30.0
- ARV discount +7.5/15.0
- DSCR +6.8/10.0
- 1% rule +4.4/10.0
- Schools +4.2/10.0
- Livability +3.8/5.0
- Condition / age +2.5/5.0
- Rent growth +2.4/5.0
- Appreciation +0.0/10.0
$171,000
🖨 Deal sheet 📄 Offer letter ✓ Due diligence
Listing remarks MLS
Beautiful property in the heart of Plan City!! You won't find any deed restrictions or HOA here so bring your boat, and RV. This home is being used as a 2 Bedroom 1 Bath. Recent upgrades include a new well that was replaced with the required permits. The home has a shed and a good size backyard! Schedule your appointment today and make this house you dreamed home!
Key facts
- Detached space
- 1/4 acre lot
- Tile flooring
Tags
Property features AI
Finance
- Other: Property zoned R-1A; Lot about 0.23 acres
- Financial info: No lease restrictions; Unfurnished
- HOA & community: No HOA
Exterior
- Parking: No parking details provided
- Utilities: Well water; Septic tank sewer; Other utilities
- Home design: Single-family residence, one story; North-facing
- Construction: Stucco and frame construction; Shingle roof; Built on a slab foundation
- Exterior features: Other exterior features; Gravel road access
Interior
- Kitchen: Dishwasher; Microwave; Range; Refrigerator
- Bedrooms: 2 bedrooms (one-level)
- Flooring: Ceramic tile; Slab foundation (interior level noted as one level)
- Bathrooms: 1 full bathroom
- Heating & cooling: Ductless heating; Wall/window cooling units; Other heating and cooling features
- Interior features: Other interior features
- Laundry & utility: Laundry: Other
Neighborhood map
What this means for you Summary
Snapshot
- This is a 2-bed/1.0-bath single-family listed at $171k.
Deal economics
- At list price, monthly cash flow is $250 ($3k/yr) — positive.
- The deal already cash-flows at list — no discount required.
- To meet the 1% rule (rent ≥ 1% of price), the offer needs to be $160k (6.4% below list).
- Recommended offer: $160k (6.4% below list) — sets the bar for 1% rule.
Location & tenants
- Location reads 76/100 on livability (#227 in FL, #3,587 nationally) — a middle-class / working-renter tenant base. Strengths: amenities A+, cost of living A+, housing A+; Watch: employment C-, schools D+, commute F.
- Hillsborough (suburban): math 47% / reading 50% proficiency, ranked #41 of 73 in FL (top 56%) — families likely to look elsewhere, expect single-tenant / working-renter base with shorter leases.
- Market conditions: Rents soft (-0.6%/yr); 181 active listings in the ZIP; 4 comparable units currently listed for rent nearby; rentals at typical pace (median 25d on market — plan ~3-4 weeks tenant-placement turnaround); 9,053 units permitted in Hillsborough County in 2024 (4,555 in 5+ unit buildings).
- This rent runs 32% of the median local income ($60k/yr) — at the standard rent-burdened threshold; future hikes will face affordability resistance.
Forward outlook
- Local home prices are declining (-3.0%/yr); year-one equity from $1k of loan paydown is wiped out by about $5k of value loss. Plan a longer hold.
- Hillsborough County population projected at +37% by 2050 — long-run rental-demand tailwind backs the buy-and-hold thesis.
Negotiation context
- Only 5 days on market — expect competitive offers; lowballing is unlikely to land.
- 16 sale attempts since 17y ago; this cycle's ask is 4% above the opening price — seller raised mid-cycle; expect resistance to lowballs.
- Current owner paid $120k; 42% above their basis — modest negotiation headroom, anchor on the comps not their cost.
Risks & watch-outs
- Watch-outs: built in 1950 — expect roof / HVAC / electrical / plumbing capex.
- Climate carrying-cost: severe wind risk, 99% chance of damaging wind over 30y; extreme-heat days projected 7→22/yr by 2055 (HVAC capex compounding) — expect insurance premiums to compound above CPI over the hold.
Questions for the listing agent
- Built in 1950 — when were the roof, HVAC, electrical panel, plumbing, and water heater last replaced?
- Is there a deadline driving the sale (1031 exchange, divorce, estate, relocation)? That informs how much negotiation room exists.
- Schools are D-rated, which usually means shorter tenancies and higher turnover. Who's the typical renter profile here, and what's been the actual vacancy rate?
- What's the average days-on-market for RENTAL listings here right now (not sales)? A rising rental-DOM trend means longer vacancies and softer asking-rent achievability than the comps imply.
- What's the recent tenant-quality profile in this submarket — average credit score on applications, eviction rate, late-payment / NSF rate, and stable-employment percentage? A property-management company in the area should have these aggregated.
- How much new for-sale + rental construction is in the pipeline within 1–3 miles? Heavy new supply typically softens prices + rents 12–24 months out; constrained supply supports both.
Investment metrics
- 1% rule
- 0.94% ✗
- Cap rate
- 8.05%
- Cash-on-cash
- 6.26%
- DSCR
- 1.28
- GRM
- 8.9
CMA / ARV
No comps found within radius.
Projected returns pro-forma
-3.0% appreciation · 0.0% rent growth · sell at horizon
- IRR
- -9.7%
- Equity multiple
- 0.65×
- Total profit
- $-16,567
- Equity at exit
- $25,497
- IRR
- -4.5%
- Equity multiple
- 0.74×
- Total profit
- $-12,383
- Equity at exit
- $14,785
Cash invested: $47,880 (down + closing). Projections, not guarantees.
Landlord ↔ Tenant lean methodology
- Overall (STATE)
- 87 Strongly Landlord-Friendly
- State Florida
- 87 Strongly Landlord-Friendly · R+3
- County
- — inherits STATE
- City
- — inherits STATE
ZIP-level market 33563
- Home prices YoY
- -23.2%
- Rents YoY
- -0.6%
- Active inventory
- 181
- Price-to-rent
- 8.9×
Monthly cashflow live
- Estimated rent
- $1,600 medium interval (Pro) →
- Mortgage (P&I)
- −$897
- Tax from tax record
- −$46 /mo · $558/yr
- Insurance
- −$71
- HOA
- −$0
- Vacancy / Maint / Mgmt
- −$336
- Net cashflow
- $250
Break-even live
UW: 25.0% down · 7.5% · 30yr · 1.5% tax · 5.0% vac · 8.0% maint · 8.0% mgmt
Financing live
Cash to close
- Down payment
- $42,750
- Closing costs
- $5,130
- Reserves months
- —
- Total cash needed
- —
Loan-product check · same deal, 3 products live
Conventional
25% down · 7.5% · 30yr
- Down + closing
- —
- Monthly P&I
- —
- Monthly cashflow
- —
- DSCR
- —
- Eligible?
- —
Personal DTI + credit; lowest rate.
DSCR
20% down · 8.5% · 30yr
- Down + closing
- —
- Monthly P&I
- —
- Monthly cashflow
- —
- DSCR
- —
- Eligible?
- —
No personal income docs; deal must DSCR.
Hard money
10% down · 12.0% · 12mo
- Down + closing
- —
- Monthly P&I
- —
- Monthly cashflow
- —
- DSCR
- —
- Eligible?
- —
Short-term bridge; refi at stabilization.
Rent comps 4 comps
| Address | Beds | Baths | Sqft | Rent | $/sqft | DOM | Units | Dist |
|---|---|---|---|---|---|---|---|---|
| 501 W Ball St Unit Bal12135 Plant City, FL | 2.0 | 1.0 | 624 | $1,499 | $2.40 | 24d | 1 | 0.76mi |
| 501 W Ball St Unit Hun303 Plant City, FL | 1.0 | 1.0 | 614 | $1,399 | $2.28 | 24d | 1 | 0.76mi |
| 501 W Ball St Unit War814 Plant City, FL | 2.0 | 1.0 | 614 | $1,499 | $2.44 | 11d | 1 | 0.76mi |
| 1001 Fairwinds Cir Plant City, FL | 1.0–3.0 | 1.0–2.0 | 943 | $1,690 | $1.79 | 24d | 11 | 1.39mi |
Listing history 6 events
-
2026-06-17status $171,000 Pending 5 DOM
-
2026-06-16days on market $171,000 Active 5 DOM
-
2026-06-15days on market $171,000 Active 4 DOM
-
2026-06-13days on market $171,000 Active 2 DOM
-
2026-06-13remarks 550-char remark
-
2026-06-13$171,000 Active 1 DOM
ⓘ Source: listings_history table (triggers on properties + properties_extension) + one-shot
backfill from property_details.listing_events for pre-trigger history.
Tax reassessment forecast FL · Resets to sale price
- Current annual tax
- $558 · $46/mo
- Projected year-2 tax
- $1,419 · $118/mo
- Expected delta
- +$862/yr (+$72/mo · 154.6%)
ⓘ Screening estimate from a state-policy table — verify with the county assessor before closing.
Climate risk First Street
- Flood 1/10 Low FEMA zone X (unshaded) · 0% chance over 30 yrs
- Wildfire 4/10 Moderate
- Heat 9/10 Extreme 7 d/yr ≥108°F today · 22 d/yr by 30 yrs out
- Wind 9/10 Extreme 99% chance of damaging wind over 30 yrs
- Air quality 3/10 Moderate 2 unhealthy d/yr today · 3 by 30 yrs out
Nearby sold comps map
Loading sold comps map…
Walkable amenities ~0.75 mi
Loading nearby amenities…
Taxation est. · year 1
- Rental income
- $19,204
- − Mortgage interest
- −$9,579
- − Property taxes
- −$558
- − Insurance
- −$855
- − Repairs & maintenance
- −$1,536
- − Management
- −$1,536
- − Depreciation
- −$4,975
- Taxable income
- $166
- Est. tax owed @ 24.0%
- −$40
- After-tax cash flow
- $2,958/yr
For passive investors: Depreciation is non-cash, so a rental often shows a tax loss while cash-flowing — sheltering income. Rental losses are passive: they offset passive income freely, and up to $25,000/yr can offset ordinary (W-2) income if you actively participate and your MAGI is under $100k (phasing out to $0 by $150k); unused losses carry forward. On sale, claimed depreciation is recaptured at up to 25%, and gains may owe capital-gains tax (a 1031 exchange can defer both). Figures are a year-1 estimate at your 24.0% rate — not tax advice; consult a CPA.
Schools (NCES district)
- District
- Hillsborough
- NCES district ID
- 1200870
- Math proficiency
- 47% ▼ -8.00%
- Reading proficiency
- 50% ▼ -4.00%
- Median HH income
- $50,622
- Composite
- 41.6/100
- National rank
- #3435
- State rank
- #41 of 73 in FL
Livability — Plant City
- Score
- 76/100
- State rank
- #227
- US rank
- #3587
Category grades
Schools grade is shown separately in the Schools card above.
Census & demographics
- Census place
- Plant City, FL
- County
- Hillsborough County · 1,540,968 people
- City population
- 68,525
- Metro
- Tampa-St. Petersburg-Clearwater, FL
- Population (ZIP)
- 25,896
- Household income
- $60,131
- Rent vs Own
- Severe rent burden
- 932.0
Population outlook (Hillsborough County) Hauer SSP2
- Today (2025)
- 1,607,022 people
- By 2030
- 1,733,968 · +7.9%
- By 2040
- 1,979,565 · +23.2%
- By 2050
- 2,203,427 · +37.1%
- By 2075
- 2,667,893 · +66.0%
- By 2100
- 2,891,558 · +79.9%
Race, ethnicity, and origin ACS 2023
- Neighborhood character
- Diverse neighborhood (Simpson 0.64)
- Race & ethnicity
- White 43% Hispanic / Latino 39% Black 15% Two or more races 15% Native American 2%
- Hispanic origin (detail)
- Mexican 24% Puerto Rican 5% Cuban 1%
- Common ancestry
- Lithuanian 2% Italian 1% Slovak 1%
- Foreign-born
- 16% · Canada, Jamaica
- Languages at home
- 66% English-only · Spanish 34%
Political lean MEDSL · Hillsborough
- 2024 margin
- Toss-up / Even · D 47.8% · R 50.9% · Other 1.3%
- 2008→2024 swing
- -10.2pp toward R · 2008: 7.1pp · 2024: -3.1pp
- All cycles
- 2024: R+3.1 2020: D+6.9 2016: D+6.8 2012: D+6.7 2008: D+7.1
Not yet ingested
- Civics
- —
Market trends
- HPI YoY
- ▼ -103.29%
- Current HPI
- 342.5789
- Rent YoY
- ▼ -0.57%
- Metro
- Tampa-St. Petersburg-Clearwater, FL
- State GDP YoY
- ▲ 3.28%
- F500 in state
- 36
Industry mix (Fortune 500 HQ in FL)
| Industry | F500 HQs | Revenue |
|---|---|---|
| Industrial Technology | 2 | $29B |
|
||
| Insurance | 2 | $17B |
|
||
| Retail | 1 | $60B |
|
||
| Technology Distribution | 1 | $58B |
|
||
| Homebuilding | 1 | $35B |
|
||
| Technology Manufacturing | 1 | $35B |
|
||
Price history
+42.5% since first listed48 events — show timeline
- 2026-06-11 Price Changed $171,000 Stellar MLS as Distributed by MLS Grid
- 2026-06-11 Listed $164,990 Stellar MLS as Distributed by MLS Grid
- 2025-06-18 Listed $169,500 Stellar MLS as Distributed by MLS Grid
- 2021-06-14 Sold (Public Records) $120,000 Public Records
- 2021-06-02 Sold (MLS) $120,000 Stellar MLS as Distributed by MLS Grid
- 2021-04-22 Pending — Stellar MLS as Distributed by MLS Grid
- 2021-04-17 Listed $115,000 Stellar MLS as Distributed by MLS Grid
- 2020-12-21 Listing Removed — Stellar MLS as Distributed by MLS Grid
- 2020-12-19 Relisted — Stellar MLS as Distributed by MLS Grid
- 2020-11-20 Pending — Stellar MLS as Distributed by MLS Grid
- 2020-11-11 Relisted — Stellar MLS as Distributed by MLS Grid
- 2020-11-04 Pending — Stellar MLS as Distributed by MLS Grid
- 2020-10-31 Relisted — Stellar MLS as Distributed by MLS Grid
- 2020-06-10 Pending — Stellar MLS as Distributed by MLS Grid
- 2020-06-06 Relisted — Stellar MLS as Distributed by MLS Grid
- 2020-05-22 Pending — Stellar MLS as Distributed by MLS Grid
- 2020-05-06 Price Changed $45,000 Stellar MLS as Distributed by MLS Grid
- 2020-04-09 Price Changed $49,000 Stellar MLS as Distributed by MLS Grid
- 2020-03-10 Price Changed $52,000 Stellar MLS as Distributed by MLS Grid
- 2020-03-03 Price Changed $62,000 Stellar MLS as Distributed by MLS Grid
- 2019-12-30 Price Changed $72,000 Stellar MLS as Distributed by MLS Grid
- 2019-11-29 Price Changed $79,000 Stellar MLS as Distributed by MLS Grid
- 2019-11-12 Price Changed $85,000 Stellar MLS as Distributed by MLS Grid
- 2019-10-31 Relisted — Stellar MLS as Distributed by MLS Grid
- 2019-10-22 Listing Removed — Stellar MLS as Distributed by MLS Grid
- 2019-10-12 Price Changed $88,000 Stellar MLS as Distributed by MLS Grid
- 2019-10-04 Price Changed $94,000 Stellar MLS as Distributed by MLS Grid
- 2019-09-10 Listed $100,000 Stellar MLS as Distributed by MLS Grid
- 2019-01-24 Pending — Stellar MLS as Distributed by MLS Grid
- 2019-01-23 Listing Removed — Stellar MLS as Distributed by MLS Grid
- 2018-12-21 Listed $70,000 Stellar MLS as Distributed by MLS Grid
- 2017-10-09 Sold (Public Records) $65,000 Public Records
- 2017-09-25 Sold (MLS) $65,000 Stellar MLS as Distributed by MLS Grid
- 2017-08-24 Pending — Stellar MLS as Distributed by MLS Grid
- 2017-03-14 Listed $65,000 Stellar MLS as Distributed by MLS Grid
- 2015-12-02 Listing Removed — Stellar MLS as Distributed by MLS Grid
- 2015-10-21 Price Changed $39,900 Stellar MLS as Distributed by MLS Grid
- 2015-09-09 Listed $44,500 Stellar MLS as Distributed by MLS Grid
- 2013-11-25 Sold (MLS) $10,000 Stellar MLS as Distributed by MLS Grid
- 2013-10-22 Listed $14,900 Stellar MLS as Distributed by MLS Grid
- 2013-09-23 Listing Removed — Stellar MLS as Distributed by MLS Grid
- 2012-03-07 Listed $16,103 Stellar MLS as Distributed by MLS Grid
- 2009-10-24 Listing Removed — Stellar MLS as Distributed by MLS Grid
- 2009-10-24 Listed $79,900 Stellar MLS as Distributed by MLS Grid
- 2009-08-27 Listed $89,900 Stellar MLS as Distributed by MLS Grid
- 2007-05-12 Sold (Public Records) $50,000 Public Records
- 1999-01-01 Sold (Public Records) $122,700 Public Records
- 1997-03-01 Sold (Public Records) $120,000 Public Records
Property tax history
+4.5%/yrLatest (2025): $558 · -58.4% YoY. Source: county tax records.
Cash-flow waterfall
monthlySold comps — $/sqft
last 12 mo · ≤1 miLoading sold comps…