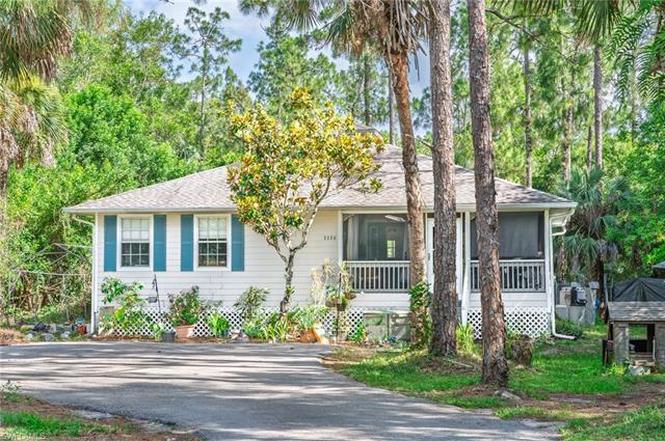
3330 4th Ave SE · Orangetree, FL
Flood risk 1/10 · Minimal
- FEMA flood zone
- X
- Chance of flooding over 30 yrs
- 0.0%
- Est. flood insurance / yr
- $507 – $1,088
Fire risk 4/10 · Minor
- Est. fire insurance / yr
- $947 – $1,759
Heat risk 9/10 · Severe
- Hot days now (above 112°F)
- 3 days/yr
- Hot days in 30 yrs
- 12 days/yr
Wind risk 10/10 · Severe
- Chance of severe wind over 30 yrs
- 99.0%
Air-quality risk 2/10 · Minimal
- Unhealthy air days now
- 1 days/yr
- Unhealthy air days in 30 yrs
- 2 days/yr
Risk factors via First Street. Map © Google.
Why this score? — see what drove the D grade
The composite is a weighted blend of 9 inputs, each scored 0–100. Each bar is that input's sub-score; the figure is the points it added to the 100-point composite (weight × sub-score).
- Cash flow +13.7/30.0
- ARV discount +7.5/15.0
- Schools +5.0/10.0
- DSCR +4.1/10.0
- Livability +3.2/5.0
- 1% rule +2.7/10.0
- Rent growth +2.5/5.0
- Condition / age +2.5/5.0
- Appreciation +0.0/10.0
$349,900
🖨 Deal sheet (PDF) 📄 Offer letter ✓ Due diligence
Listing remarks MLS
Adorable 2 bedroom Cottage on 1.14 acres! This home is priced to sell!! With a Screened in front porch just waiting for your family to relax and enjoy the peaceful estates. When you enter you'll notice the vaulted ceiling in your spacious Family room. In the kitchen new Granite countertops and Backsplash nicely accent the open kitchen. Your private acreage allows plenty of space for your cars and Boats or toys. A new roof was installed in May of 2019 along with gutters and In 2017 a 6 stage reverse osmosis system was installed. Homeowners had the home LOMA Determined so flood insurance is not necessary. You do not want to miss this amazing Opportunity!
Key facts
- Private acres
- Screened front porch
- Vaulted ceiling
Tags
Property features AI
Finance
- Other: Property occupies 1.14 acres; Lot dimensions from survey
- HOA & community: No HOA maintenance or amenities; Community is non-gated
Exterior
- Utilities: Well water; Septic sewer; Cable available
- Home design: Residential single-family (1 story / ranch); Rear exposure facing south; Located in Golden Gate Estates
- Construction: Wood frame construction; Built in 1994
- Exterior features: Vinyl siding; Casement windows; Shingle roof; Wooded area view; Regular lot
Interior
- Kitchen: Cooktop (electric); Self-cleaning oven; Dishwasher; Disposal; Refrigerator/ice maker; Reverse osmosis
- Bedrooms: 2 bedrooms
- Flooring: Tile flooring
- Bathrooms: 2 full bathrooms; Master bathroom with shower only
- Heating & cooling: Central electric heat; Central electric cooling
- Interior features: Eat-in kitchen; Split-bedroom floor plan; See remarks (additional interior details)
- Laundry & utility: Washer; Dryer; Smoke detector
Neighborhood map
What this means for you Summary
Snapshot
- This is a 2-bed/2.0-bath single-family listed at $350k.
Deal economics
- At list price, monthly cash flow is $27 ($322/yr) — positive.
- The deal already cash-flows at list — no discount required.
- To meet the 1% rule (rent ≥ 1% of price), the offer needs to be $270k (22.9% below list).
- Recommended offer: $270k (22.9% below list) — sets the bar for 1% rule.
Location & tenants
- Location reads 65/100 on livability (#636 in FL) — a middle-class / working-renter tenant base. Strengths: crime A+, employment A+, housing A+; Watch: health & safety D, amenities F, commute F.
- Collier (suburban): math 60% / reading 56% proficiency, ranked #16 of 73 in FL (top 22%) — acceptable for families but not a draw, mixed tenant base, ~2y average lease.
- Zoned schools: Palmetto Elementary School (math 63% / reading 58%, grade B-, #664 of 2,144 statewide, top 32%, 569 students, 66% FRL); Cypress Palm Middle School (math 54% / reading 51%, grade C+, #213 of 571 statewide, top 38%, 796 students, 53% FRL); Palmetto Ridge High School (math 43% / reading 51%, grade D-, #207 of 667 statewide, top 32%, 2,347 students, 38% FRL) — zoned schools at 53% FRL track the district average.
- Market conditions: 373 active listings in the ZIP; 2 comparable units currently listed for rent nearby; high-income renter base; 3,520 units permitted in Collier County in 2024 (959 in 5+ unit buildings).
Forward outlook
- Local home prices are declining (-3.0%/yr); year-one equity from $2k of loan paydown is wiped out by about $10k of value loss. Plan a longer hold.
- Collier County population projected at +30% by 2050 — long-run rental-demand tailwind backs the buy-and-hold thesis.
Negotiation context
- Only 10 days on market — expect competitive offers; lowballing is unlikely to land.
- 6 sale attempts since 16y ago with the ask held roughly flat each time — persistent listings suggest the price (not the market) is what's stuck; bring a comps-based counter.
- Current owner paid $232k; list at $350k implies a 51% gain — meaningful room to come down on a strong offer.
Risks & watch-outs
- Climate carrying-cost: severe wind risk, 99% chance of damaging wind over 30y; extreme-heat days projected 3→12/yr by 2055 (HVAC capex compounding) — expect insurance premiums to compound above CPI over the hold.
Questions for the listing agent
- Is there a deadline driving the sale (1031 exchange, divorce, estate, relocation)? That informs how much negotiation room exists.
- Schools are D-rated, which usually means shorter tenancies and higher turnover. Who's the typical renter profile here, and what's been the actual vacancy rate?
- The area grade is low — what's the realistic commute time and amenity access for the typical tenant pool here? Any planned neighborhood developments (good or bad) we should know about?
- What's the average days-on-market for RENTAL listings here right now (not sales)? A rising rental-DOM trend means longer vacancies and softer asking-rent achievability than the comps imply.
- What's the recent tenant-quality profile in this submarket — average credit score on applications, eviction rate, late-payment / NSF rate, and stable-employment percentage? A property-management company in the area should have these aggregated.
- How much new for-sale + rental construction is in the pipeline within 1–3 miles? Heavy new supply typically softens prices + rents 12–24 months out; constrained supply supports both.
Investment metrics
- 1% rule
- 0.77% ✗
- Cap rate
- 6.38%
- Cash-on-cash
- 0.33%
- DSCR
- 1.01
- GRM
- 10.8
CMA / ARV
No comps found within radius.
Projected returns pro-forma
-3.0% appreciation · 3.0% rent growth · sell at horizon
- IRR
- -15.8%
- Equity multiple
- 0.44×
- Total profit
- $-55,145
- Equity at exit
- $52,171
- IRR
- -7.5%
- Equity multiple
- 0.53×
- Total profit
- $-46,441
- Equity at exit
- $30,253
Cash invested: $97,972 (down + closing). Projections, not guarantees.
Landlord ↔ Tenant lean methodology
- Overall (STATE)
- 87 Strongly Landlord-Friendly
- State Florida
- 87 Strongly Landlord-Friendly · R+3
- County
- — inherits STATE
- City
- — inherits STATE
ZIP-level market 34117
- Active inventory
- 373
- Price-to-rent
- 10.8×
Monthly cashflow live
- Estimated rent
- $2,697 medium interval (Pro) →
- Mortgage (P&I)
- −$1,835
- Tax from tax record
- −$123 /mo · $1,477/yr
- Insurance
- −$146
- HOA
- −$0
- Vacancy / Maint / Mgmt
- −$566
- Net cashflow
- $27
Break-even live
Sensitivity live
| Price | -10% $225 | -5% $126 | +0% $27 | +5% $-72 | +10% $-171 |
|---|---|---|---|---|---|
| Rent | -10% $-186 | -5% $-80 | +0% $27 | +5% $133 | +10% $240 |
| Rate | -1.0pp $203 | -0.5pp $116 | base $27 | +0.5pp $-64 | +1.0pp $-156 |
UW: 25.0% down · 7.5% · 30yr · 1.5% tax · 5.0% vac · 8.0% maint · 8.0% mgmt
Financing live
Cash to close
- Down payment
- $87,475
- Closing costs
- $10,497
- Reserves months
- —
- Total cash needed
- —
Loan-product check · same deal, 3 products live
Conventional
25% down · 7.5% · 30yr
- Down + closing
- —
- Monthly P&I
- —
- Monthly cashflow
- —
- DSCR
- —
- Eligible?
- —
Personal DTI + credit; lowest rate.
DSCR
20% down · 8.5% · 30yr
- Down + closing
- —
- Monthly P&I
- —
- Monthly cashflow
- —
- DSCR
- —
- Eligible?
- —
No personal income docs; deal must DSCR.
Hard money
10% down · 12.0% · 12mo
- Down + closing
- —
- Monthly P&I
- —
- Monthly cashflow
- —
- DSCR
- —
- Eligible?
- —
Short-term bridge; refi at stabilization.
Rent comps 2 comps
| Address | Beds | Baths | Sqft | Rent | $/sqft | DOM | Units | Dist |
|---|---|---|---|---|---|---|---|---|
| 3520 2nd Ave NE Naples, FL | 3.0 | 2.0 | 1488 | $3,000 | $2.02 | 25d | 1 | 0.77mi |
| 4121 8th Ave SE Naples, FL | 3.0 | 2.0 | 1200 | $2,400 | $2.00 | 25d | 1 | 1.10mi |
Listing history 7 events
-
2026-06-21days on market $349,900 Active 10 DOM
-
2026-06-18days on market $349,900 Active 7 DOM
-
2026-06-17days on market $349,900 Active 6 DOM
-
2026-06-16days on market $349,900 Active 5 DOM
-
2026-06-15days on market $349,900 Active 4 DOM
-
2026-06-14remarks 699-char remark
-
2026-06-14$349,900 Active 2 DOM
ⓘ Source: listings_history table (triggers on properties + properties_extension) + one-shot
backfill from property_details.listing_events for pre-trigger history.
Tax reassessment forecast FL · Resets to sale price
- Current annual tax
- $1,477 · $123/mo
- Projected year-2 tax
- $2,904 · $242/mo
- Expected delta
- +$1,428/yr (+$119/mo · 96.7%)
ⓘ Screening estimate from a state-policy table — verify with the county assessor before closing.
Climate risk First Street
- Flood 1/10 Low FEMA zone X · 0% chance over 30 yrs
- Wildfire 4/10 Moderate
- Heat 9/10 Extreme 3 d/yr ≥112°F today · 12 d/yr by 30 yrs out
- Wind 10/10 Extreme 99% chance of damaging wind over 30 yrs
- Air quality 2/10 Low 1 unhealthy d/yr today · 2 by 30 yrs out
Nearby sold comps map
Loading sold comps map…
Walkable amenities ~0.75 mi
Loading nearby amenities…
Taxation est. · year 1
- Rental income
- $32,363
- − Mortgage interest
- −$19,600
- − Property taxes
- −$1,477
- − Insurance
- −$1,750
- − Repairs & maintenance
- −$2,589
- − Management
- −$2,589
- − Depreciation
- −$10,179
- Taxable loss
- −$5,820
- Est. tax savings @ 24.0%
- +$1,397
- After-tax cash flow
- $1,718/yr
For passive investors: Depreciation is non-cash, so a rental often shows a tax loss while cash-flowing — sheltering income. Rental losses are passive: they offset passive income freely, and up to $25,000/yr can offset ordinary (W-2) income if you actively participate and your MAGI is under $100k (phasing out to $0 by $150k); unused losses carry forward. On sale, claimed depreciation is recaptured at up to 25%, and gains may owe capital-gains tax (a 1031 exchange can defer both). Figures are a year-1 estimate at your 24.0% rate — not tax advice; consult a CPA.
Schools (NCES district)
- District
- Collier
- NCES district ID
- 1200330
- Math proficiency
- 60% ▼ -4.00%
- Reading proficiency
- 56% ▼ -2.00%
- Median HH income
- $58,275
- Composite
- 50.23/100
- National rank
- #1892
- State rank
- #16 of 73 in FL
Livability — Orangetree
- Score
- 65/100
- State rank
- #636
- US rank
- #12453
Category grades
Schools grade is shown separately in the Schools card above.
Census & demographics
- County
- Collier County · 396,295 people
- Metro
- Naples-Marco Island, FL
- Population (ZIP)
- 19,923
- Household income
- $110,614
- Rent vs Own
- Severe rent burden
- 103.0
Population outlook (Collier County) Hauer SSP2
- Today (2025)
- 420,858 people
- By 2030
- 450,054 · +6.9%
- By 2040
- 502,232 · +19.3%
- By 2050
- 544,932 · +29.5%
- By 2075
- 627,203 · +49.0%
- By 2100
- 659,015 · +56.6%
Race, ethnicity, and origin ACS 2023
- Neighborhood character
- Diverse neighborhood (Simpson 0.55)
- Race & ethnicity
- White 51% Hispanic / Latino 44% Two or more races 22% Black 3%
- Hispanic origin (detail)
- Mexican 13% Puerto Rican 3% Cuban 16% Dominican 1%
- Common ancestry
- Romanian 4% Lithuanian 2% Hispanic 1%
- Foreign-born
- 30% · Canada, Jamaica, China
- Languages at home
- 55% English-only · Spanish 39% French/Haitian/Cajun 2% Russian/Polish/Slavic 1%
Political lean MEDSL · Collier
- 2024 margin
- Solid R (+33.1) · D 33.1% · R 66.2%
- 2008→2024 swing
- -10.6pp toward R · 2008: -22.5pp · 2024: -33.1pp
- All cycles
- 2024: R+33.1 2020: R+24.7 2016: R+26.0 2012: R+30.1 2008: R+22.5
Not yet ingested
- Civics
- —
Market trends
- HPI YoY
- ▼ -205.53%
- Current HPI
- 378.5529
- Rent YoY
- —
- Metro
- Naples-Marco Island, FL
- State GDP YoY
- ▲ 3.28%
- F500 in state
- 36
Industry mix (Fortune 500 HQ in FL)
| Industry | F500 HQs | Revenue |
|---|---|---|
| Industrial Technology | 2 | $29B |
|
||
| Insurance | 2 | $17B |
|
||
| Retail | 1 | $60B |
|
||
| Technology Distribution | 1 | $58B |
|
||
| Homebuilding | 1 | $35B |
|
||
| Technology Manufacturing | 1 | $35B |
|
||
Price history
+4693.2% since first listed19 events — show timeline
- 2026-06-11 Listed $349,900 NAPLESMLS
- 2019-10-04 Sold (Public Records) $232,000 Public Records
- 2019-10-03 Sold (MLS) $232,000 NAPLESMLS
- 2019-08-31 Pending — NAPLESMLS
- 2019-08-28 Listed $229,000 NAPLESMLS
- 2015-11-02 Sold (Public Records) $150,500 Public Records
- 2015-10-29 Price Changed $149,900 NAPLESMLS
- 2015-10-29 Price Changed $150,500 NAPLESMLS
- 2015-10-29 Sold (MLS) $150,500 NAPLESMLS
- 2015-08-25 Listing Removed — NAPLESMLS
- 2015-08-20 Relisted — NAPLESMLS
- 2015-08-05 Listing Removed — NAPLESMLS
- 2015-07-28 Listed $149,900 NAPLESMLS
- 2012-10-04 Listing Removed — NAPLESMLS
- 2012-07-24 Listed $112,000 NAPLESMLS
- 2010-08-03 Sold (MLS) $90,600 NAPLESMLS
- 2010-04-07 Listed $99,000 NAPLESMLS
- 2003-09-08 Sold (Public Records) $129,900 Public Records
- 1992-06-01 Sold (Public Records) $7,300 Public Records
Property tax history
+11.3%/yrLatest (2025): $1,477 · +6.5% YoY. Source: county tax records.
Cash-flow waterfall
monthlySold comps — $/sqft
last 12 mo · ≤1 miLoading sold comps…