16110 Homan Ave · Markham, IL
Flood risk 1/10 · Minimal
- FEMA flood zone
- X (unshaded)
- Chance of flooding over 30 yrs
- 0.0%
- Est. flood insurance / yr
- $473 – $860
Fire risk 1/10 · Minimal
- Est. fire insurance / yr
- $804 – $1,492
Heat risk 3/10 · Minor
- Hot days now (above 101°F)
- 7 days/yr
- Hot days in 30 yrs
- 15 days/yr
Wind risk 2/10 · Minimal
- Chance of severe wind over 30 yrs
- —
Air-quality risk 3/10 · Minor
- Unhealthy air days now
- 4 days/yr
- Unhealthy air days in 30 yrs
- 4 days/yr
Risk factors via First Street. Map © Google.
Why this score? — see what drove the A- grade
The composite is a weighted blend of 9 inputs, each scored 0–100. Each bar is that input's sub-score; the figure is the points it added to the 100-point composite (weight × sub-score).
- Cash flow +29.0/30.0
- ARV discount +15.0/15.0
- DSCR +10.0/10.0
- Appreciation +10.0/10.0
- 1% rule +8.7/10.0
- Livability +3.8/5.0
- Rent growth +2.5/5.0
- Condition / age +2.5/5.0
- Schools +1.5/10.0
$169,000
🖨 Deal sheet 📄 Offer letter ✓ Due diligence
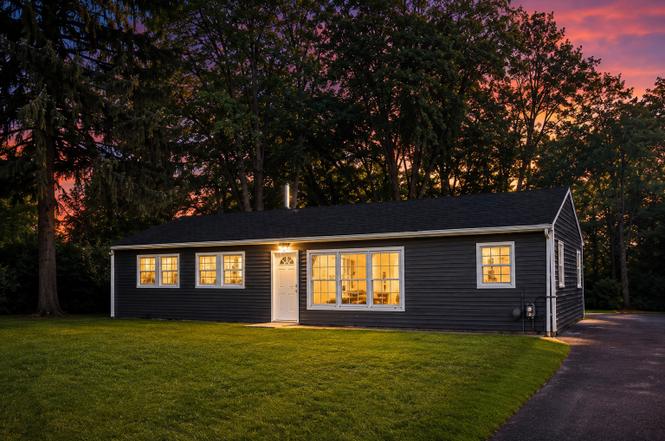
Listing remarks
WELCOME TO THIS FULLY REMODELED IN ITS ENTIRETY RANCH STYLE SINGLE FAMILY HOME. THIS TREMENDOUS HOME CONSISTS OF 4BED 2 BATH, AND HUGE FAMILY ROOM. UPDATED KITCHEN WITH GRANITE COUNTER TOP. NEW ELECTRIC, PLUMBING, ROOF, WINDOWS, SIDING, APPLIANCES, FLOORING, RECESS LIGHTING, AND LIGHT FIXTURES. IN UNIT W/ D. HUGE YARD, AND DRIVEWAY. AS IS SALE! PLEASE DO YOUR DUE DILIGENCE.
Key facts
- Fully remodeled
- New plumbing
- Granite counter top
Tags
Property features AI
Finance
- Other: Parcel numbers on file
- HOA & community: No master association fee required
Exterior
- Parking: Parking for 5 vehicles; Owned parking; Asphalt driveway
- Utilities: Public water; Public sewer
- Home design: Detached single-family home; One-story; Fee simple ownership; Property was rebuilt/rehabbed in 2025; Built before 1978
- Construction: Vinyl siding; Asphalt roof; Concrete perimeter foundation; Estimated age: 61–70 years
- Exterior features: Lot dimensions approximately 130 x 42; Lot smaller than 0.25 acre; Asphalt driveway
Interior
- Kitchen: Kitchen on the main level (10 x 15)
- Bedrooms: 4 bedrooms (all on the main level); Master bedroom on the main level (12 x 10); Bedroom (12 x 10) on the main level; Bedroom (10 x 10) on the main level; Bedroom (11 x 10) on the main level
- Bathrooms: 2 full bathrooms
- Heating & cooling: Forced air heating; Central air conditioning
- Interior features: 8 total rooms
- Laundry & utility: Main-level laundry room (6 x 8)
Neighborhood map
What this means for you Summary
Snapshot
- This is a 4-bed/2.0-bath single-family listed at $169k.
Deal economics
- At list price, monthly cash flow is $578 ($7k/yr) — positive.
- The deal already cash-flows at list — no discount required.
- Meets the 1% rule at list price ($2k rent vs $169k).
- Recommended offer: $149k (12.0% below list) — sets the bar for market timing.
Location & tenants
- Location reads 76/100 on livability (#186 in IL, #3,539 nationally) — a middle-class / working-renter tenant base. Strengths: commute A+, cost of living A+, housing A+; Watch: crime D, amenities D, employment D.
- Bremen Chsd 228 (suburban): math 15% / reading 17% proficiency, ranked #468 of 620 in IL (top 76%) — low school quality limits family demand, transient renter base, plan for 1-2y turnover.
- Market conditions: 65 active listings in the ZIP; 2 comparable units currently listed for rent nearby; 6,272 units permitted in Cook County in 2024 (4,658 in 5+ unit buildings).
Forward outlook
- In year one you build about $18k of equity ($1k loan paydown + $17k appreciation (10.0% local appreciation)).
- At projected returns (10.0% appreciation + 3.0% rent growth), your $47k cash investment doubles in ~2 years — after that, you're playing with house money.
- By year 3, paydown + projected appreciation supports a ~$46k cash-out refi (75% LTV) — recoverable capital for the next deal without selling this one.
Negotiation context
- It's been on market 144 days — a 12% lower offer ($149k) is reasonable based on typical stale-listing flexibility.
- 6 sale attempts since 11y ago; this cycle's ask has dropped $70k (29%) from the opening price — seller is motivated, your offer sets the floor, not the list.
- Current owner paid $15k; list at $169k implies a 1027% gain — meaningful room to come down on a strong offer.
Risks & watch-outs
- Watch-outs: built in 1956 — expect roof / HVAC / electrical / plumbing capex.
Questions for the listing agent
- It's been on market 144 days. Have you received any prior offers? Is the seller open to a 12% concession, seller financing, or rate buy-down credit?
- Built in 1956 — when were the roof, HVAC, electrical panel, plumbing, and water heater last replaced?
- Why hasn't it sold? Are there any deal-killer items the seller is aware of (foundation, flood, title, zoning, code violations)?
- Is there a deadline driving the sale (1031 exchange, divorce, estate, relocation)? That informs how much negotiation room exists.
- Schools are F-rated, which usually means shorter tenancies and higher turnover. Who's the typical renter profile here, and what's been the actual vacancy rate?
- Crime grade is D in this area — have there been break-ins, vandalism, or insurance claims at this property in the last 3 years? What carrier currently insures it and at what premium?
- What's the average days-on-market for RENTAL listings here right now (not sales)? A rising rental-DOM trend means longer vacancies and softer asking-rent achievability than the comps imply.
- What's the recent tenant-quality profile in this submarket — average credit score on applications, eviction rate, late-payment / NSF rate, and stable-employment percentage? A property-management company in the area should have these aggregated.
- How much new for-sale + rental construction is in the pipeline within 1–3 miles? Heavy new supply typically softens prices + rents 12–24 months out; constrained supply supports both.
Investment metrics
- 1% rule
- 1.37% ✓
- Cap rate
- 10.39%
- Cash-on-cash
- 14.65%
- DSCR
- 1.65
- GRM
- 6.1
CMA / ARV
- ARV (on-the-fly)
- $228,020
- Comps found
- 12
Show comp detail 12 sales within ~0.75 mi
| Address | Dist | Beds/Ba | Sqft | Sold | Price | $/sf | Match |
|---|---|---|---|---|---|---|---|
| 16219 Turner Ave | 0.17mi | 4/2.0 | 1,900 (+8%) | 6mo | $230,000 | $121 | 73 |
| 16303 Homan Ave | 0.24mi | 3/2.0 (-1) | 1,694 (-3%) | 7mo | $240,000 | $142 | 73 |
| 16230 Turner Ave | 0.18mi | 3/1.0 (-1) | 1,563 (-11%) | 8mo | $200,000 | $128 | 58 |
| 16445 Turner Ave | 0.47mi | 3/2.0 (-1) | 1,600 (-9%) | 8mo | $230,000 | $144 | 52 |
| 15749 Saint Louis Ave | 0.45mi | 3/2.5 (-1) | 1,575 (-10%) | 4mo | $225,000 | $143 | 52 |
| 16524 Sawyer Ave | 0.55mi | 4/2.0 | 1,501 (-14%) | 0mo | $192,500 | $128 | 50 |
| 15700 Turner Ave | 0.52mi | 4/1.0 | 1,536 (-12%) | 3mo | $199,900 | $130 | 48 |
| 16037 Springfield Ave | 0.62mi | 3/2.0 (-1) | 1,566 (-11%) | 3mo | $206,000 | $132 | 46 |
| 16431 Spaulding Ave | 0.44mi | 3/1.0 (-1) | 1,500 (-14%) | 2mo | $75,000 | $50 | 44 |
| 15622 Millard Ave | 0.73mi | 4/1.5 | 1,538 (-12%) | 2mo | $75,000 | $49 | 41 |
| 16563 Belleplaine Dr | 0.54mi | 3/1.0 (-1) | 1,550 (-12%) | 9mo | $125,000 | $81 | 39 |
| 15535 Homan Ave | 0.71mi | 3/2.0 (-1) | 1,500 (-14%) | 10mo | $242,000 | $161 | 30 |
Match score weights: distance 35% · size 25% · config 20% · recency 20%. Top-matched comps best support the ARV.
Projected returns pro-forma
10.0% appreciation · 3.0% rent growth · sell at horizon
- IRR
- 35.1%
- Equity multiple
- 3.72×
- Total profit
- $128,919
- Equity at exit
- $152,249
- IRR
- 30.3%
- Equity multiple
- 8.42×
- Total profit
- $350,895
- Equity at exit
- $328,330
Cash invested: $47,320 (down + closing). Projections, not guarantees.
Landlord ↔ Tenant lean methodology
- Overall (STATE)
- 43 Moderately Tenant-Leaning
- State Illinois
- 43 Moderately Tenant-Leaning · D+7
- County
- — inherits STATE
- City
- — inherits STATE
ZIP-level market 60428
- Home prices YoY
- 8.5%
- Active inventory
- 65
- Price-to-rent
- 6.1×
Monthly cashflow live
- Estimated rent
- $2,322 medium interval (Pro) →
- Mortgage (P&I)
- −$886
- Tax from tax record
- −$300 /mo · $3,605/yr
- Insurance
- −$70
- HOA
- −$0
- Vacancy / Maint / Mgmt
- −$488
- Net cashflow
- $578
Break-even live
UW: 25.0% down · 7.5% · 30yr · 1.5% tax · 5.0% vac · 8.0% maint · 8.0% mgmt
Financing live
Cash to close
- Down payment
- $42,250
- Closing costs
- $5,070
- Reserves months
- —
- Total cash needed
- —
Loan-product check · same deal, 3 products live
Conventional
25% down · 7.5% · 30yr
- Down + closing
- —
- Monthly P&I
- —
- Monthly cashflow
- —
- DSCR
- —
- Eligible?
- —
Personal DTI + credit; lowest rate.
DSCR
20% down · 8.5% · 30yr
- Down + closing
- —
- Monthly P&I
- —
- Monthly cashflow
- —
- DSCR
- —
- Eligible?
- —
No personal income docs; deal must DSCR.
Hard money
10% down · 12.0% · 12mo
- Down + closing
- —
- Monthly P&I
- —
- Monthly cashflow
- —
- DSCR
- —
- Eligible?
- —
Short-term bridge; refi at stabilization.
Rent comps 2 comps
| Address | Beds | Baths | Sqft | Rent | $/sqft | DOM | Units | Dist |
|---|---|---|---|---|---|---|---|---|
| 3952 153rd St Midlothian, IL | 4.0 | 2.0 | 1677 | $2,396 | $1.43 | 2d | 1 | 1.38mi |
| 3900 171st St Country Club Hills, IL | 3.0 | 1.0 | 1750 | $2,250 | $1.29 | 8d | 1 | 1.41mi |
Listing history 46 events
-
2026-05-04price $169,000
-
2026-04-28price $170,000
-
2026-04-26price $180,000
-
2026-04-20price $185,000
-
2026-04-13price $190,000
-
2026-04-08price $195,000
-
2026-04-01price $200,000
-
2026-03-31price $210,000
-
2026-03-25price $215,000
-
2026-03-16price $219,000
-
2026-03-10price $220,000
-
2026-02-24price $225,000
-
2026-02-12price $235,000
-
2026-01-02$239,000 Active
-
2025-12-15historical
-
2025-12-09price
-
2025-12-01status Active
-
2025-11-30historical
-
2025-11-18price
-
2025-11-11status Active
-
2025-10-28historical Contingent - Continue to Show
-
2025-10-08price
-
2025-10-02price
-
2025-09-25Active
-
2025-09-24historical
-
2025-09-23price
-
2025-09-15price
-
2025-09-08price
-
2025-09-02price
-
2025-08-25price
-
2025-08-18price
-
2025-08-11price
-
2025-08-04price
-
2025-07-30price
-
2025-07-21price
-
2025-07-18price
-
2025-06-30price
-
2025-06-18Active
-
2024-08-06soldstatus $15,000
-
2016-04-13status Pending
-
2016-04-08historical
-
2016-04-08historical
-
2015-12-04price
-
2015-11-14price
-
2015-10-09New
-
1982-11-04soldstatus $9,000
ⓘ Source: listings_history table (triggers on properties + properties_extension) + one-shot
backfill from property_details.listing_events for pre-trigger history.
Tax reassessment forecast IL · Partial reset (capped growth)
- Current annual tax
- $3,605 · $300/mo
- Projected year-2 tax
- $3,721 · $310/mo
- Expected delta
- +$116/yr (+$10/mo · 3.2%)
ⓘ Screening estimate from a state-policy table — verify with the county assessor before closing.
Climate risk First Street
- Flood 1/10 Low FEMA zone X (unshaded) · 0% chance over 30 yrs
- Wildfire 1/10 Low
- Heat 3/10 Moderate 7 d/yr ≥101°F today · 15 d/yr by 30 yrs out
- Wind 2/10 Low
- Air quality 3/10 Moderate 4 unhealthy d/yr today · 4 by 30 yrs out
Nearby sold comps map
Loading sold comps map…
Walkable amenities ~0.75 mi
Loading nearby amenities…
Taxation est. · year 1
- Rental income
- $27,869
- − Mortgage interest
- −$9,467
- − Property taxes
- −$3,605
- − Insurance
- −$845
- − Repairs & maintenance
- −$2,229
- − Management
- −$2,229
- − Depreciation
- −$4,916
- Taxable income
- $4,577
- Est. tax owed @ 24.0%
- −$1,098
- After-tax cash flow
- $5,833/yr
For passive investors: Depreciation is non-cash, so a rental often shows a tax loss while cash-flowing — sheltering income. Rental losses are passive: they offset passive income freely, and up to $25,000/yr can offset ordinary (W-2) income if you actively participate and your MAGI is under $100k (phasing out to $0 by $150k); unused losses carry forward. On sale, claimed depreciation is recaptured at up to 25%, and gains may owe capital-gains tax (a 1031 exchange can defer both). Figures are a year-1 estimate at your 24.0% rate — not tax advice; consult a CPA.
Schools (NCES district)
- District
- Bremen Chsd 228
- NCES district ID
- 1707050
- Math proficiency
- 15% ▼ -4.00%
- Reading proficiency
- 17% ▼ -5.00%
- Median HH income
- $57,625
- Composite
- 15.32/100
- National rank
- #9327
- State rank
- #468 of 620 in IL
Livability — Markham
- Score
- 76/100
- State rank
- #186
- US rank
- #3539
Category grades
Schools grade is shown separately in the Schools card above.
Census & demographics
- Census place
- Markham, IL
- City population
- 10,980
- Population (ZIP)
- 10,980
Population outlook (Cook County) Hauer SSP2
- Today (2025)
- 5,347,519 people
- By 2030
- 5,357,703 · +0.2%
- By 2040
- 5,324,924 · -0.4%
- By 2050
- 5,230,762 · -2.2%
- By 2075
- 4,785,735 · -10.5%
- By 2100
- 4,188,836 · -21.7%
Race, ethnicity, and origin ACS 2023
- Neighborhood character
- Predominantly Black (69%)
- Race & ethnicity
- Black 69% Hispanic / Latino 17% White 11% Two or more races 4%
- Hispanic origin (detail)
- Mexican 16%
- Common ancestry
- Romanian 1% Lithuanian 1% Iranian 1%
- Foreign-born
- 8% · Canada
- Languages at home
- 86% English-only · Spanish 14%
Political lean MEDSL · Cook
- 2024 margin
- Solid D (+42.0) · D 70.4% · R 28.4% · Other 1.2%
- 2008→2024 swing
- -11.4pp toward R · 2008: 53.4pp · 2024: 42.0pp
- All cycles
- 2024: D+42.0 2020: D+50.3 2016: D+53.0 2012: D+49.4 2008: D+53.4
Not yet ingested
- Civics
- —
Market trends
- HPI YoY
- ▲ 23.63%
- Current HPI
- 302.333
- Rent YoY
- —
- Metro
- —
- State GDP YoY
- ▲ 1.59%
- F500 in state
- 60
Industry mix (Fortune 500 HQ in IL)
| Industry | F500 HQs | Revenue |
|---|---|---|
| Insurance | 4 | $201B |
|
||
| Consumer Goods | 4 | $87B |
|
||
| Industrial Machinery | 3 | $64B |
|
||
| Healthcare | 2 | $55B |
|
||
| Retail / Pharmacy | 1 | $148B |
|
||
| Agriculture / Food | 1 | $86B |
|
||
Price history
+1777.8% since first listed46 events — show timeline
- 2026-05-04 Price Changed $169,000 MRED as Distributed by MLS Grid
- 2026-04-28 Price Changed $170,000 MRED as Distributed by MLS Grid
- 2026-04-26 Price Changed $180,000 MRED as Distributed by MLS Grid
- 2026-04-20 Price Changed $185,000 MRED as Distributed by MLS Grid
- 2026-04-13 Price Changed $190,000 MRED as Distributed by MLS Grid
- 2026-04-08 Price Changed $195,000 MRED as Distributed by MLS Grid
- 2026-04-01 Price Changed $200,000 MRED as Distributed by MLS Grid
- 2026-03-31 Price Changed $210,000 MRED as Distributed by MLS Grid
- 2026-03-25 Price Changed $215,000 MRED as Distributed by MLS Grid
- 2026-03-16 Price Changed $219,000 MRED as Distributed by MLS Grid
- 2026-03-10 Price Changed $220,000 MRED as Distributed by MLS Grid
- 2026-02-24 Price Changed $225,000 MRED as Distributed by MLS Grid
- 2026-02-12 Price Changed $235,000 MRED as Distributed by MLS Grid
- 2026-01-02 Listed $239,000 MRED as Distributed by MLS Grid
- 2025-12-15 Listing Removed — MRED as Distributed by MLS Grid
- 2025-12-09 Price Changed — MRED as Distributed by MLS Grid
- 2025-12-01 Relisted — MRED as Distributed by MLS Grid
- 2025-11-30 Listing Removed — MRED as Distributed by MLS Grid
- 2025-11-18 Price Changed — MRED as Distributed by MLS Grid
- 2025-11-11 Relisted — MRED as Distributed by MLS Grid
- 2025-10-28 Contingent — MRED as Distributed by MLS Grid
- 2025-10-08 Price Changed — MRED as Distributed by MLS Grid
- 2025-10-02 Price Changed — MRED as Distributed by MLS Grid
- 2025-09-25 Listed — MRED as Distributed by MLS Grid
- 2025-09-24 Listing Removed — MRED as Distributed by MLS Grid
- 2025-09-23 Price Changed — MRED as Distributed by MLS Grid
- 2025-09-15 Price Changed — MRED as Distributed by MLS Grid
- 2025-09-08 Price Changed — MRED as Distributed by MLS Grid
- 2025-09-02 Price Changed — MRED as Distributed by MLS Grid
- 2025-08-25 Price Changed — MRED as Distributed by MLS Grid
- 2025-08-18 Price Changed — MRED as Distributed by MLS Grid
- 2025-08-11 Price Changed — MRED as Distributed by MLS Grid
- 2025-08-04 Price Changed — MRED as Distributed by MLS Grid
- 2025-07-30 Price Changed — MRED as Distributed by MLS Grid
- 2025-07-21 Price Changed — MRED as Distributed by MLS Grid
- 2025-07-18 Price Changed — MRED as Distributed by MLS Grid
- 2025-06-30 Price Changed — MRED as Distributed by MLS Grid
- 2025-06-18 Listed — MRED as Distributed by MLS Grid
- 2024-08-06 Sold (Public Records) $15,000 Public Records
- 2016-04-13 Pending — MRED as Distributed by MLS Grid
- 2016-04-08 Listing Removed — MRED as Distributed by MLS Grid
- 2016-04-08 Listing Removed — MRED as Distributed by MLS Grid
- 2015-12-04 Price Changed — MRED as Distributed by MLS Grid
- 2015-11-14 Price Changed — MRED as Distributed by MLS Grid
- 2015-10-09 Listed — MRED as Distributed by MLS Grid
- 1982-11-04 Sold (Public Records) $9,000 Public Records
Property tax history
+6.6%/yrLatest (2023): $3,605 · +17.4% YoY. Source: county tax records.
Cash-flow waterfall
monthlySold comps — $/sqft
last 12 mo · ≤1 miLoading sold comps…