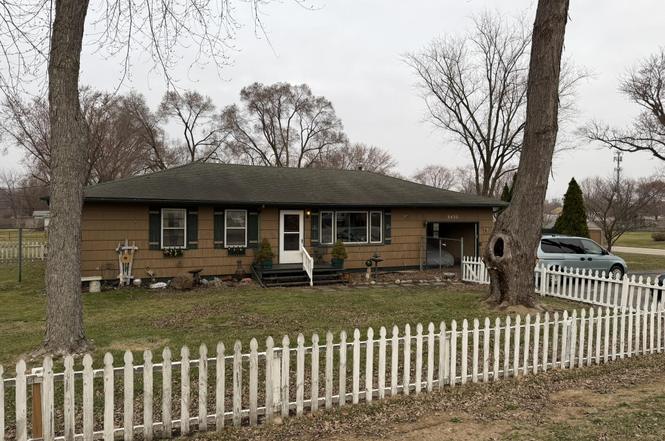
5420 W 45th St · Ross, IN
Flood risk 1/10 · Minimal
- FEMA flood zone
- X (unshaded)
- Chance of flooding over 30 yrs
- 0.0%
- Est. flood insurance / yr
- $507 – $1,088
Fire risk 3/10 · Minor
- Est. fire insurance / yr
- $717 – $1,331
Heat risk 2/10 · Minimal
- Hot days now (above 103°F)
- 7 days/yr
- Hot days in 30 yrs
- 15 days/yr
Wind risk 2/10 · Minimal
- Chance of severe wind over 30 yrs
- 1.0%
Air-quality risk 3/10 · Minor
- Unhealthy air days now
- 2 days/yr
- Unhealthy air days in 30 yrs
- 3 days/yr
Risk factors via First Street. Map © Google.
Why this score? — see what drove the C+ grade
The composite is a weighted blend of 9 inputs, each scored 0–100. Each bar is that input's sub-score; the figure is the points it added to the 100-point composite (weight × sub-score).
- Cash flow +25.8/30.0
- ARV discount +15.0/15.0
- DSCR +8.6/10.0
- 1% rule +5.7/10.0
- Rent growth +2.5/5.0
- Livability +2.5/5.0
- Condition / age +2.5/5.0
- Schools +1.3/10.0
- Appreciation +0.0/10.0
$154,500
🖨 Deal sheet 📄 Offer letter ✓ Due diligence
Listing remarks
Looking for a great ranch just minutes from Cline with easy access to major highways? This charming home offers two driveways--perfect for anyone needing extra space for cars, toys and recreational vehicles. The fenced property features a generous yard ready for your personal touch. Inside, you'll find 3 bedrooms, 2 bathrooms, and a spacious living room. Property being sold "As Is". Low Indiana Taxes!
Key facts
- Two driveways
- Generous yard
- Fenced property
Tags
Property features AI
Finance
- Other: Vacant at time of listing
Exterior
- Parking: Attached garage; 1-car garage; Driveway; On-street parking; Garage faces front; Concrete and asphalt surfaces
- Utilities: Public water; Public sewer
- Home design: One-story home; Built in 1963
- Construction: Year built 1963
- Exterior features: Fenced yard; Neighborhood view
Interior
- Kitchen: Gas cooktop; Microwave; Refrigerator; Dishwasher
- Bedrooms: Primary bedroom; Bedroom 2; Bedroom 3
- Flooring: Hardwood; Other
- Bathrooms: 1 full bathroom; 1 half bathroom
- Heating & cooling: Forced air heating (natural gas); Ceiling fans for cooling
- Interior features: Ceiling fans; Pantry; Eat-in kitchen; Storage
- Laundry & utility: Washer hookup (main level); Gas dryer hookup (main level); Washer and dryer included
Neighborhood map
What this means for you Summary
Snapshot
- This is a 3-bed/1.5-bath single-family listed at $154k.
Deal economics
- At list price, monthly cash flow is $376 ($5k/yr) — positive.
- The deal already cash-flows at list — no discount required.
- Meets the 1% rule at list price ($2k rent vs $154k).
- Recommended offer: $145k (6.0% below list) — sets the bar for market timing.
Location & tenants
- Location reads: area grade C — affects rentability + tenant quality, not the cash-flow math above.
- Lake Ridge New Tech Schools (suburban): math 11% / reading 20% proficiency, ranked #287 of 301 in IN (top 95%) — low school quality limits family demand, transient renter base, plan for 1-2y turnover; 79% free/reduced lunch — lower-income household profile, screen leases tightly.
- Market conditions: 102 active listings in the ZIP; 7 comparable units currently listed for rent nearby; rentals leasing fast (median 2d on market — plan ~1-2 weeks tenant-placement turnaround); 1,642 units permitted in Lake County in 2024 (14 in 5+ unit buildings).
- This rent runs 42% of the median local income ($47k/yr) — at the standard rent-burdened threshold; future hikes will face affordability resistance.
Forward outlook
- Local home prices are declining (-3.0%/yr); year-one equity from $1k of loan paydown is wiped out by about $5k of value loss. Plan a longer hold.
- Lake County population projected to shrink 7% by 2050 — rents likely to lag national; underwrite the cash flow, not the appreciation.
Negotiation context
- It's been on market 89 days — a 6% lower offer ($145k) is reasonable based on typical stale-listing flexibility.
- 3 sale attempts; this cycle's ask has dropped $10k (6%) from the opening price — seller is motivated, your offer sets the floor, not the list.
Questions for the listing agent
- It's been on market 89 days. Have you received any prior offers? Is the seller open to a 6% concession, seller financing, or rate buy-down credit?
- Built in 1963 — when were the roof, HVAC, electrical panel, plumbing, and water heater last replaced?
- Why hasn't it sold? Are there any deal-killer items the seller is aware of (foundation, flood, title, zoning, code violations)?
- Is there a deadline driving the sale (1031 exchange, divorce, estate, relocation)? That informs how much negotiation room exists.
- What's the average days-on-market for RENTAL listings here right now (not sales)? A rising rental-DOM trend means longer vacancies and softer asking-rent achievability than the comps imply.
- What's the recent tenant-quality profile in this submarket — average credit score on applications, eviction rate, late-payment / NSF rate, and stable-employment percentage? A property-management company in the area should have these aggregated.
- How much new for-sale + rental construction is in the pipeline within 1–3 miles? Heavy new supply typically softens prices + rents 12–24 months out; constrained supply supports both.
Investment metrics
- 1% rule
- 1.07% ✓
- Cap rate
- 9.21%
- Cash-on-cash
- 10.43%
- DSCR
- 1.46
- GRM
- 7.8
CMA / ARV
- ARV (on-the-fly)
- $220,640
- Comps found
- 12
Show comp detail 12 sales within ~0.75 mi
| Address | Dist | Beds/Ba | Sqft | Sold | Price | $/sf | Match |
|---|---|---|---|---|---|---|---|
| 5420 W 45th St | 0.00mi | 3/1.5 | 1,120 (0%) | 0mo | $155,000 | $138 | 100 |
| 4848 Ralston Pl | 0.48mi | 3/1.5 | 1,120 (0%) | 13mo | $234,900 | $210 | 66 |
| 1144 N Wheeler St | 0.65mi | 3/1.5 | 1,092 (-2%) | 7mo | $255,000 | $234 | 60 |
| 4640 W 47th Ave | 0.55mi | 3/1.0 | 1,160 (+4%) | 8mo | $142,500 | $123 | 59 |
| 5001 W 45th St | 0.24mi | 2/1.0 (-1) | 1,041 (-7%) | 17mo | $245,000 | $235 | 56 |
| 926 N Glenwood Ave | 0.61mi | 3/1.5 | 1,041 (-7%) | 12mo | $217,000 | $208 | 50 |
| 500 N Wheeler St | 0.74mi | 3/2.0 | 1,120 (0%) | 18mo | $273,000 | $244 | 49 |
| 618 N Glenwood Ave | 0.71mi | 3/1.0 | 1,040 (-7%) | 6mo | $180,000 | $173 | 48 |
| 521 N Glenwood Ave | 0.74mi | 3/1.5 | 1,176 (+5%) | 16mo | $228,000 | $194 | 44 |
| 811 N Arbogast St | 0.72mi | 3/1.0 | 1,038 (-7%) | 15mo | $205,000 | $197 | 40 |
| 3936 Ross Rd | 0.67mi | 3/1.0 | 1,253 (+12%) | 14mo | $158,000 | $126 | 35 |
| 1043 N Oakwood St | 0.67mi | 3/1.0 | 960 (-14%) | 18mo | $178,900 | $186 | 28 |
Match score weights: distance 35% · size 25% · config 20% · recency 20%. Top-matched comps best support the ARV.
Projected returns pro-forma
-3.0% appreciation · 3.0% rent growth · sell at horizon
- IRR
- -0.7%
- Equity multiple
- 0.97×
- Total profit
- $-1,160
- Equity at exit
- $23,036
- IRR
- 8.9%
- Equity multiple
- 1.68×
- Total profit
- $29,559
- Equity at exit
- $13,358
Cash invested: $43,260 (down + closing). Projections, not guarantees.
Landlord ↔ Tenant lean methodology
- Overall (STATE)
- 90 Strongly Landlord-Friendly
- State Indiana
- 90 Strongly Landlord-Friendly · R+11
- County
- — inherits STATE
- City
- — inherits STATE
ZIP-level market 46408
- Home prices YoY
- -31.6%
- Active inventory
- 102
- Price-to-rent
- 7.8×
Monthly cashflow live
- Estimated rent
- $1,646 high interval (Pro) →
- Mortgage (P&I)
- −$810
- Tax from tax record
- −$50 /mo · $599/yr
- Insurance
- −$64
- HOA
- −$0
- Vacancy / Maint / Mgmt
- −$346
- Net cashflow
- $376
Break-even live
UW: 25.0% down · 7.5% · 30yr · 1.5% tax · 5.0% vac · 8.0% maint · 8.0% mgmt
Financing live
Cash to close
- Down payment
- $38,625
- Closing costs
- $4,635
- Reserves months
- —
- Total cash needed
- —
Loan-product check · same deal, 3 products live
Conventional
25% down · 7.5% · 30yr
- Down + closing
- —
- Monthly P&I
- —
- Monthly cashflow
- —
- DSCR
- —
- Eligible?
- —
Personal DTI + credit; lowest rate.
DSCR
20% down · 8.5% · 30yr
- Down + closing
- —
- Monthly P&I
- —
- Monthly cashflow
- —
- DSCR
- —
- Eligible?
- —
No personal income docs; deal must DSCR.
Hard money
10% down · 12.0% · 12mo
- Down + closing
- —
- Monthly P&I
- —
- Monthly cashflow
- —
- DSCR
- —
- Eligible?
- —
Short-term bridge; refi at stabilization.
Rent comps 7 comps
| Address | Beds | Baths | Sqft | Rent | $/sqft | DOM | Units | Dist |
|---|---|---|---|---|---|---|---|---|
| 820 N Wheeler St Griffith, IN | 1.0–2.0 | 1.0 | 870 | $1,400 | $1.61 | 1d | 1 | 0.55mi |
| 632 N Elmer St Apt C Griffith, IN 46319 Griffith, IN | 2.0 | 1.0 | 870 | $1,300 | $1.49 | 7d | 1 | 1.00mi |
| 329 N Jay St Griffith, IN | 2.0 | 1.0 | 832 | $1,450 | $1.74 | 12d | 1 | 1.02mi |
| 422 N Dwiggins St Griffith, IN | 2.0 | 1.0 | 1135 | $1,650 | $1.45 | 24d | 1 | 1.02mi |
| 1800 W Park Blvd Griffith, IN | 3.0 | 2.0 | 1288 | $2,221 | $1.72 | 1d | 1 | 1.30mi |
| 1818 Park West Blvd Griffith, IN | 1.0–3.0 | 1.0–2.5 | 1230 | $2,309 | $1.88 | 1d | 78 | 1.34mi |
| 420 N Broad St Unit 1 Griffith, IN | 2.0 | 1.0 | 825 | $1,295 | $1.57 | 1d | 1 | 1.36mi |
Listing history 14 events
-
2026-06-08statusdays on market $154,500 Pending 89 DOM
-
2026-06-07days on market $154,500 Active Under Contract 88 DOM
-
2026-06-04days on market $154,500 Active Under Contract 85 DOM
-
2026-06-03days on market $154,500 Active Under Contract 84 DOM
-
2026-06-02days on market $154,500 Active Under Contract 83 DOM
-
2026-06-01days on market $154,500 Active Under Contract 82 DOM
-
2026-05-31days on market $154,500 Active Under Contract 81 DOM
-
2026-04-29historical Active Under Contract
-
2026-04-27status Active
-
2026-04-19historical Active Under Contract
-
2026-04-08price $154,500
-
2026-04-01status Active
-
2026-03-23historical Active Under Contract
-
2026-03-11$164,500 Active
ⓘ Source: listings_history table (triggers on properties + properties_extension) + one-shot
backfill from property_details.listing_events for pre-trigger history.
Tax reassessment forecast IN · Partial reset (capped growth)
- Current annual tax
- $599 · $50/mo
- Projected year-2 tax
- $956 · $80/mo
- Expected delta
- +$357/yr (+$30/mo · 59.6%)
ⓘ Screening estimate from a state-policy table — verify with the county assessor before closing.
Climate risk First Street
- Flood 1/10 Low FEMA zone X (unshaded) · 0% chance over 30 yrs
- Wildfire 3/10 Moderate
- Heat 2/10 Low 7 d/yr ≥103°F today · 15 d/yr by 30 yrs out
- Wind 2/10 Low 100% chance of damaging wind over 30 yrs
- Air quality 3/10 Moderate 2 unhealthy d/yr today · 3 by 30 yrs out
Nearby sold comps map
Loading sold comps map…
Walkable amenities ~0.75 mi
Loading nearby amenities…
Taxation est. · year 1
- Rental income
- $19,753
- − Mortgage interest
- −$8,654
- − Property taxes
- −$599
- − Insurance
- −$772
- − Repairs & maintenance
- −$1,580
- − Management
- −$1,580
- − Depreciation
- −$4,495
- Taxable income
- $2,072
- Est. tax owed @ 24.0%
- −$497
- After-tax cash flow
- $4,013/yr
For passive investors: Depreciation is non-cash, so a rental often shows a tax loss while cash-flowing — sheltering income. Rental losses are passive: they offset passive income freely, and up to $25,000/yr can offset ordinary (W-2) income if you actively participate and your MAGI is under $100k (phasing out to $0 by $150k); unused losses carry forward. On sale, claimed depreciation is recaptured at up to 25%, and gains may owe capital-gains tax (a 1031 exchange can defer both). Figures are a year-1 estimate at your 24.0% rate — not tax advice; consult a CPA.
Schools (NCES district)
- District
- Lake Ridge New Tech Schools
- NCES district ID
- 1805460
- Math proficiency
- 11% ▼ -18.00%
- Reading proficiency
- 20% ▼ -9.00%
- Median HH income
- $34,568
- Composite
- 12.67/100
- National rank
- #9607
- State rank
- #287 of 301 in IN
Livability — Ross
No livability data for this city. (Only ~50 U.S. cities are tracked.)
Census & demographics
- Census place
- Ross, IN
- County
- Lake County · 422,878 people
- City population
- 15,571
- Metro
- Chicago-Naperville-Elgin, IL-IN-WI
- Population (ZIP)
- 15,747
- Household income
- $47,453
- Rent vs Own
- Severe rent burden
- 619.0
Population outlook (Lake County) Hauer SSP2
- Today (2025)
- 484,026 people
- By 2030
- 478,091 · -1.2%
- By 2040
- 462,974 · -4.3%
- By 2050
- 449,894 · -7.1%
- By 2075
- 436,169 · -9.9%
- By 2100
- 426,607 · -11.9%
Race, ethnicity, and origin ACS 2023
- Neighborhood character
- Diverse neighborhood (Simpson 0.68)
- Race & ethnicity
- Black 41% White 32% Hispanic / Latino 22% Two or more races 12%
- Hispanic origin (detail)
- Mexican 14% Puerto Rican 7%
- Common ancestry
- Romanian 5% Iranian 1% Slovak 1%
- Foreign-born
- 4% · Canada, China
- Languages at home
- 87% English-only · Spanish 12% Chinese 1%
Political lean MEDSL · Lake
- 2024 margin
- Lean D (+5.6) · D 52.1% · R 46.5% · Other 1.5%
- 2008→2024 swing
- -28.6pp toward R · 2008: 34.3pp · 2024: 5.6pp
- All cycles
- 2024: D+5.6 2020: D+15.1 2016: D+20.6 2012: D+31.0 2008: D+34.3
Not yet ingested
- Civics
- —
Market trends
- HPI YoY
- ▼ -72.08%
- Current HPI
- 155.6238
- Rent YoY
- —
- Metro
- Chicago-Naperville-Elgin, IL-IN-WI
- State GDP YoY
- ▲ 2.90%
- F500 in state
- 18
Industry mix (Fortune 500 HQ in IN)
| Industry | F500 HQs | Revenue |
|---|---|---|
| Industrial Machinery | 2 | $37B |
|
||
| Healthcare | 1 | $177B |
|
||
| Pharmaceuticals | 1 | $45B |
|
||
| Metals / Steel | 1 | $18B |
|
||
| Agriculture | 1 | $17B |
|
||
| Packaging | 1 | $12B |
|
||
Price history
-6.1% since first listed7 events — show timeline
- 2026-04-29 Contingent — NIRA MLS as Distributed by MLS Grid
- 2026-04-27 Relisted — NIRA MLS as Distributed by MLS Grid
- 2026-04-19 Contingent — NIRA MLS as Distributed by MLS Grid
- 2026-04-08 Price Changed $154,500 NIRA MLS as Distributed by MLS Grid
- 2026-04-01 Relisted — NIRA MLS as Distributed by MLS Grid
- 2026-03-23 Contingent — NIRA MLS as Distributed by MLS Grid
- 2026-03-11 Listed $164,500 NIRA MLS as Distributed by MLS Grid
Property tax history
+7.5%/yrLatest (2024): $599 · +2.0% YoY. Source: county tax records.
Cash-flow waterfall
monthlySold comps — $/sqft
last 12 mo · ≤1 miLoading sold comps…