 Fourplex
None · Evanston, IL
Flood risk 1/10 · Minimal
- FEMA flood zone
- X (unshaded)
- Chance of flooding over 30 yrs
- 0.0%
- Est. flood insurance / yr
- $473 – $860
Fire risk 1/10 · Minimal
- Est. fire insurance / yr
- $804 – $1,492
Heat risk 2/10 · Minimal
- Hot days now (above 98°F)
- 7 days/yr
- Hot days in 30 yrs
- 14 days/yr
Wind risk 2/10 · Minimal
- Chance of severe wind over 30 yrs
- 0.0%
Air-quality risk 4/10 · Minor
- Unhealthy air days now
- 5 days/yr
- Unhealthy air days in 30 yrs
- 6 days/yr
Risk factors via First Street. Map © Google.
Why this score? — see what drove the D grade
The composite is a weighted blend of 9 inputs, each scored 0–100. Each bar is that input's sub-score; the figure is the points it added to the 100-point composite (weight × sub-score).
- Cash flow +11.8/30.0
- ARV discount +7.5/15.0
- Schools +4.5/10.0
- Livability +4.2/5.0
- Rent growth +3.6/5.0
- DSCR +3.5/10.0
- 1% rule +3.3/10.0
- Condition / age +2.5/5.0
- Appreciation +0.0/10.0
$1,250,000
🖨 Deal sheet 📄 Offer letter ✓ Due diligence
Multi-family units
County records classify this as Multi-Family (5+ Unit). Listing-text estimate: 4 units. estimate disagrees with records
5+ unit building — per-unit beds/baths from public records are typically unavailable; the breakdown below (if shown) is an estimate from the listing text.
Listing remarks
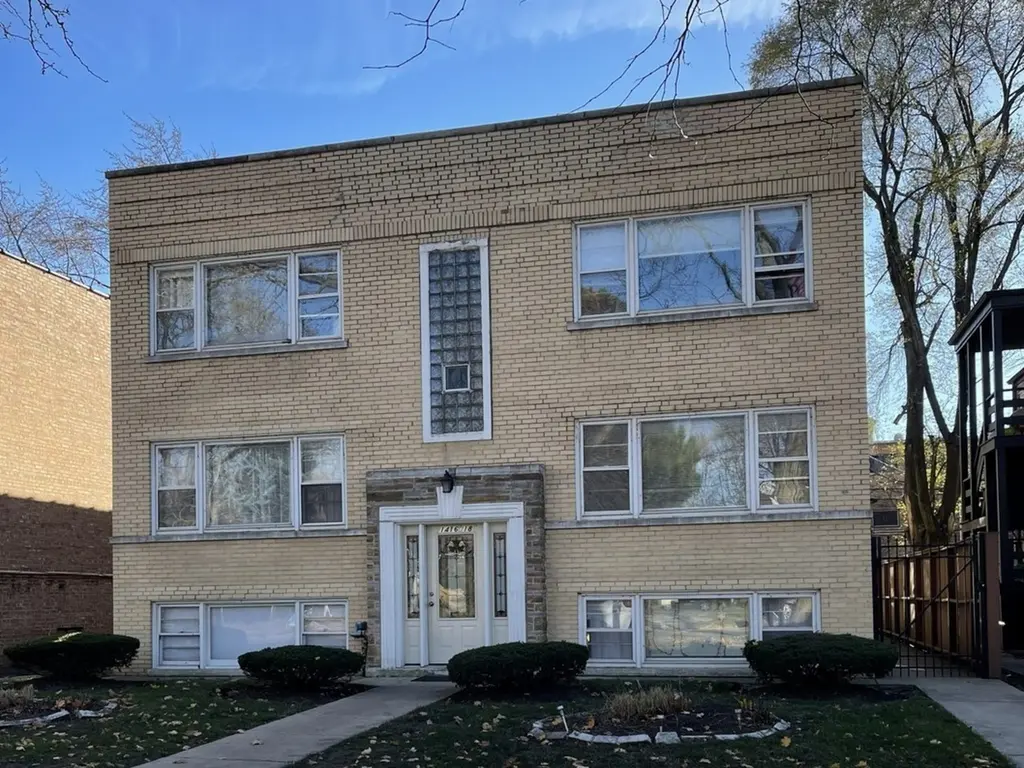
Yellow brick, custom built 1957, 5 large unit investment opportunity in quiet, owner occupied, residential area. Four units are 5 rooms - fifth unit - 3 rooms, 1 bedroom. The 4-five room units have a fifth room can be used as bedroom but no closet. Cash flow, minimal operational expense, tenants pay GFA heat, central air and electric. 47' wide lot, fenced yard, street and alley access. Roof tear off in fall of 2023. Apartments updated and mechanicals are newer. 5 separate GFA furnaces, 5 water tanks, 5 central air units and 4 washers and dryers. Walk-in basement storage locker for each unit. Short walk to shops, restaurants, transportation. Owners unit vacant - value $2200. Second floor uni
Key facts
- 6,063 sq ft lot
- Built 1957
- Listed 62 days
Property features AI
Finance
- Other: Some units leased and some not (mix of leases/no lease); Possession at closing
- Financial info: Gross monthly income reported at $8,465; Gross annual income reported at $101,580; Gross rent multiplier 7.1
Exterior
- Parking: Street parking
- Utilities: Sewer connected (storm sewer); Electric with circuit breakers
- Home design: Multi-family building (5+ units); Individual ownership; Built before 1978
- Construction: Brick construction; Membrane flat roof; Concrete perimeter foundation
- Exterior features: City street frontage; Curbs and gutters
Interior
- Kitchen: Each 2-bedroom unit has standard kitchen (includes range/stove); Each 1-bedroom unit has standard kitchen (includes range/stove)
- Bedrooms: Four 2-bedroom units; One 1-bedroom unit
- Bathrooms: Four full bathrooms in 2-bedroom units; One full bathroom in 1-bedroom unit
- Heating & cooling: Forced air gas heating; Central air conditioning
- Interior features: Unfinished basement; Smoke/Alarm detector(s)
- Laundry & utility: On-site laundry with four ranges (stoves) and four washers and four dryers; Washer/Dryer not leased
Neighborhood map
What this means for you Summary
Snapshot
- This is a 4 × 3-bed/?-bath units multifamily listed at $1.25M.
Deal economics
- At list price, monthly cash flow is $-345 ($-4k/yr) — negative. Per door: $-86/mo.
- To cash-flow at today's rent, offer at most $1.19M (4.9% below list).
- To meet the 1% rule (rent ≥ 1% of price), the offer needs to be $1.04M (16.5% below list).
- Recommended offer: $1.04M (16.5% below list) — sets the bar for 1% rule.
- Cap rate 6.0% vs local median 2.9% in Evanston — top-decile yield for the area; either an underpriced asset or a hidden risk that comps aren't pricing in. Stress-test before assuming the spread holds.
Location & tenants
- Location reads 85/100 on livability (#26 in IL, #464 nationally) — a professional / high-income tenant draw. Strengths: amenities A+, commute A+, employment A+; Watch: cost of living F.
- Evanston Twp Hsd 202 (urban): math 47% / reading 52% proficiency, ranked #54 of 620 in IL (top 9%) — families likely to look elsewhere, expect single-tenant / working-renter base with shorter leases.
- Market conditions: Rents rising fast (+4.3%/yr); 72 active listings in the ZIP; solid renter incomes; 6,272 units permitted in Cook County in 2024 (4,658 in 5+ unit buildings).
- At $10,435/mo this rent would consume 126% of the median local household income ($99k/yr) (locally 784% of renters already pay >50% of income on rent) — very limited rent-growth headroom before tenants either downsize or default.
Forward outlook
- Local home prices are declining (-3.0%/yr); year-one equity from $9k of loan paydown is wiped out by about $38k of value loss. Plan a longer hold.
Negotiation context
- It's been on market 62 days — a 6% lower offer ($1.18M) is reasonable based on typical stale-listing flexibility.
- 2 sale attempts since 8y ago with the ask held roughly flat each time — persistent listings suggest the price (not the market) is what's stuck; bring a comps-based counter.
Risks & watch-outs
- Watch-outs: built in 1957 — expect roof / HVAC / electrical / plumbing capex.
Questions for the listing agent
- What do current leases actually rent for vs. the listed asking? Can we see a recent rent roll and the last 12 months of T-12 income?
- It's been on market 62 days. Have you received any prior offers? Is the seller open to a 17% concession, seller financing, or rate buy-down credit?
- Can we see the unit-by-unit rent roll, current vacancy, and any below-market leases? What's the average tenancy length?
- What capital expenditures (roof, boiler, parking lot, exteriors) have been made in the last 5 years, and what's planned in the next 2?
- Built in 1957 — when were the roof, HVAC, electrical panel, plumbing, and water heater last replaced?
- Why hasn't it sold? Are there any deal-killer items the seller is aware of (foundation, flood, title, zoning, code violations)?
- Is there a deadline driving the sale (1031 exchange, divorce, estate, relocation)? That informs how much negotiation room exists.
- Schools are A-rated — typically a magnet for longer-tenancy family renters. What's the average tenant stay here, and is there a school-zone premium baked into asking?
- The area grade is low — what's the realistic commute time and amenity access for the typical tenant pool here? Any planned neighborhood developments (good or bad) we should know about?
- What's the average days-on-market for RENTAL listings here right now (not sales)? A rising rental-DOM trend means longer vacancies and softer asking-rent achievability than the comps imply.
- What's the recent tenant-quality profile in this submarket — average credit score on applications, eviction rate, late-payment / NSF rate, and stable-employment percentage? A property-management company in the area should have these aggregated.
- How much new apartment / multifamily construction is in the pipeline within 1–3 miles? Heavy new supply (>2% of stock underway) typically softens rents 12–24 months out; light construction supports rent growth.
Investment metrics
- 1% rule
- 0.83% ✗
- Cap rate
- 5.96%
- Cash-on-cash
- -1.18%
- DSCR
- 0.95
- GRM
- 10.0
CMA / ARV
No comps found within radius.
Projected returns pro-forma
-3.0% appreciation · 4.35% rent growth · sell at horizon
- IRR
- -16.7%
- Equity multiple
- 0.40×
- Total profit
- $-210,029
- Equity at exit
- $186,379
- IRR
- -6.3%
- Equity multiple
- 0.57×
- Total profit
- $-150,072
- Equity at exit
- $108,077
Cash invested: $350,000 (down + closing). Projections, not guarantees.
Landlord ↔ Tenant lean methodology
- Overall (STATE)
- 43 Moderately Tenant-Leaning
- State Illinois
- 43 Moderately Tenant-Leaning · D+7
- County
- — inherits STATE
- City
- — inherits STATE
ZIP-level market 60202
- Rents YoY
- 4.3%
- Active inventory
- 72
- Price-to-rent
- 39.9×
Monthly cashflow live
- Estimated rent
- $10,435 high interval (Pro) →
- Mortgage (P&I)
- −$6,555
- Tax from tax record
- −$1,513 /mo · $18,151/yr
- Insurance
- −$521
- HOA
- −$0
- Vacancy / Maint / Mgmt
- −$2,191
- Net cashflow
- $-345
Break-even live
4-unit breakdown (identical units grouped — click to expand)
| Units | Beds | Baths | Est. rent |
|---|---|---|---|
| 4× units | 3 | — | $10,436 |
| #1 | 3 | — | $2,609 |
| #2 | 3 | — | $2,609 |
| #3 | 3 | — | $2,609 |
| #4 | 3 | — | $2,609 |
| Total (4 units) | $10,435 | ||
UW: 25.0% down · 7.5% · 30yr · 1.5% tax · 5.0% vac · 8.0% maint · 8.0% mgmt
Financing live
Cash to close
- Down payment
- $312,500
- Closing costs
- $37,500
- Reserves months
- —
- Total cash needed
- —
Loan-product check · same deal, 3 products live
Conventional
25% down · 7.5% · 30yr
- Down + closing
- —
- Monthly P&I
- —
- Monthly cashflow
- —
- DSCR
- —
- Eligible?
- —
Personal DTI + credit; lowest rate.
DSCR
20% down · 8.5% · 30yr
- Down + closing
- —
- Monthly P&I
- —
- Monthly cashflow
- —
- DSCR
- —
- Eligible?
- —
No personal income docs; deal must DSCR.
Hard money
10% down · 12.0% · 12mo
- Down + closing
- —
- Monthly P&I
- —
- Monthly cashflow
- —
- DSCR
- —
- Eligible?
- —
Short-term bridge; refi at stabilization.
Listing history 19 events
-
2026-06-18days on market $1,250,000 Active 62 DOM
-
2026-06-17days on market $1,250,000 Active 61 DOM
-
2026-06-16days on market $1,250,000 Active 60 DOM
-
2026-06-15days on market $1,250,000 Active 59 DOM
-
2026-06-13days on market $1,250,000 Active 57 DOM
-
2026-06-09days on market $1,250,000 Active 53 DOM
-
2026-06-08days on market $1,250,000 Active 52 DOM
-
2026-06-07days on market $1,250,000 Active 51 DOM
-
2026-06-04days on market $1,250,000 Active 48 DOM
-
2026-06-03days on market $1,250,000 Active 47 DOM
-
2026-06-02days on market $1,250,000 Active 46 DOM
-
2026-06-01days on market $1,250,000 Active 45 DOM
-
2026-05-31days on market $1,250,000 Active 44 DOM
-
2026-04-17$1,250,000 Active
-
2026-04-09historical
-
2019-08-28historical
-
2019-06-21price
-
2019-03-22price
-
2018-04-26New
ⓘ Source: listings_history table (triggers on properties + properties_extension) + one-shot
backfill from property_details.listing_events for pre-trigger history.
Tax reassessment forecast IL · Partial reset (capped growth)
- Current annual tax
- $18,151 · $1,513/mo
- Projected year-2 tax
- $23,263 · $1,939/mo
- Expected delta
- +$5,112/yr (+$426/mo · 28.2%)
ⓘ Screening estimate from a state-policy table — verify with the county assessor before closing.
Climate risk First Street
- Flood 1/10 Low FEMA zone X (unshaded) · 0% chance over 30 yrs
- Wildfire 1/10 Low
- Heat 2/10 Low 7 d/yr ≥98°F today · 14 d/yr by 30 yrs out
- Wind 2/10 Low 0% chance of damaging wind over 30 yrs
- Air quality 4/10 Moderate 5 unhealthy d/yr today · 6 by 30 yrs out
Nearby sold comps map
Loading sold comps map…
Walkable amenities ~0.75 mi
Loading nearby amenities…
Taxation est. · year 1
- Rental income
- $125,220
- − Mortgage interest
- −$70,019
- − Property taxes
- −$18,151
- − Insurance
- −$6,250
- − Repairs & maintenance
- −$10,018
- − Management
- −$10,018
- − Depreciation
- −$36,364
- Taxable loss
- −$25,599
- Est. tax savings @ 24.0%
- +$6,144
- After-tax cash flow
- $2,005/yr
For passive investors: Depreciation is non-cash, so a rental often shows a tax loss while cash-flowing — sheltering income. Rental losses are passive: they offset passive income freely, and up to $25,000/yr can offset ordinary (W-2) income if you actively participate and your MAGI is under $100k (phasing out to $0 by $150k); unused losses carry forward. On sale, claimed depreciation is recaptured at up to 25%, and gains may owe capital-gains tax (a 1031 exchange can defer both). Figures are a year-1 estimate at your 24.0% rate — not tax advice; consult a CPA.
Schools (NCES district)
- District
- Evanston Twp Hsd 202
- NCES district ID
- 1714490
- Math proficiency
- 47% ▼ -3.00%
- Reading proficiency
- 52% ▬ 0.00%
- Median HH income
- $72,672
- Composite
- 44.52/100
- National rank
- #2794
- State rank
- #54 of 620 in IL
Livability — Evanston
- Score
- 85/100
- State rank
- #26
- US rank
- #464
Category grades
Schools grade is shown separately in the Schools card above.
Census & demographics
- Census place
- Evanston, IL
- County
- Cook County · 4,486,803 people
- City population
- 76,085
- Metro
- Chicago-Naperville-Elgin, IL-IN-WI
- Population (ZIP)
- 32,341
- Household income
- $98,989
- Rent vs Own
- Severe rent burden
- 784.0
Population outlook (Cook County) Hauer SSP2
- Today (2025)
- 5,347,519 people
- By 2030
- 5,357,703 · +0.2%
- By 2040
- 5,324,924 · -0.4%
- By 2050
- 5,230,762 · -2.2%
- By 2075
- 4,785,735 · -10.5%
- By 2100
- 4,188,836 · -21.7%
Race, ethnicity, and origin ACS 2023
- Neighborhood character
- Diverse neighborhood (Simpson 0.65)
- Race & ethnicity
- White 54% Black 18% Hispanic / Latino 14% Two or more races 11% Asian 8%
- Hispanic origin (detail)
- Mexican 8%
- Common ancestry
- Romanian 8% Scotch-Irish 2% Portuguese 2%
- Foreign-born
- 19% · Canada, Jamaica, Vietnam
- Languages at home
- 73% English-only · Spanish 11% Other Indo-European 3% Russian/Polish/Slavic 2%
Political lean MEDSL · Cook
- 2024 margin
- Solid D (+42.0) · D 70.4% · R 28.4% · Other 1.2%
- 2008→2024 swing
- -11.4pp toward R · 2008: 53.4pp · 2024: 42.0pp
- All cycles
- 2024: D+42.0 2020: D+50.3 2016: D+53.0 2012: D+49.4 2008: D+53.4
Not yet ingested
- Civics
- —
Market trends
- HPI YoY
- ▼ -245.25%
- Current HPI
- 172.9605
- Rent YoY
- ▲ 4.35%
- Metro
- Chicago-Naperville-Elgin, IL-IN-WI
- State GDP YoY
- ▲ 1.59%
- F500 in state
- 60
Industry mix (Fortune 500 HQ in IL)
| Industry | F500 HQs | Revenue |
|---|---|---|
| Insurance | 4 | $201B |
|
||
| Consumer Goods | 4 | $87B |
|
||
| Industrial Machinery | 3 | $64B |
|
||
| Healthcare | 2 | $55B |
|
||
| Retail / Pharmacy | 1 | $148B |
|
||
| Agriculture / Food | 1 | $86B |
|
||
Price history
6 events — show timeline
- 2026-04-17 Listed $1,250,000 MRED as Distributed by MLS Grid
- 2026-04-09 Listing Removed — MRED as Distributed by MLS Grid
- 2019-08-28 Listing Removed — MRED as Distributed by MLS Grid
- 2019-06-21 Price Changed — MRED as Distributed by MLS Grid
- 2019-03-22 Price Changed — MRED as Distributed by MLS Grid
- 2018-04-26 Listed — MRED as Distributed by MLS Grid
Property tax history
+1.2%/yrLatest (2023): $18,151 · +4.2% YoY. Source: county tax records.
Cash-flow waterfall
monthlySold comps — $/sqft
last 12 mo · ≤1 miLoading sold comps…