 Duplex
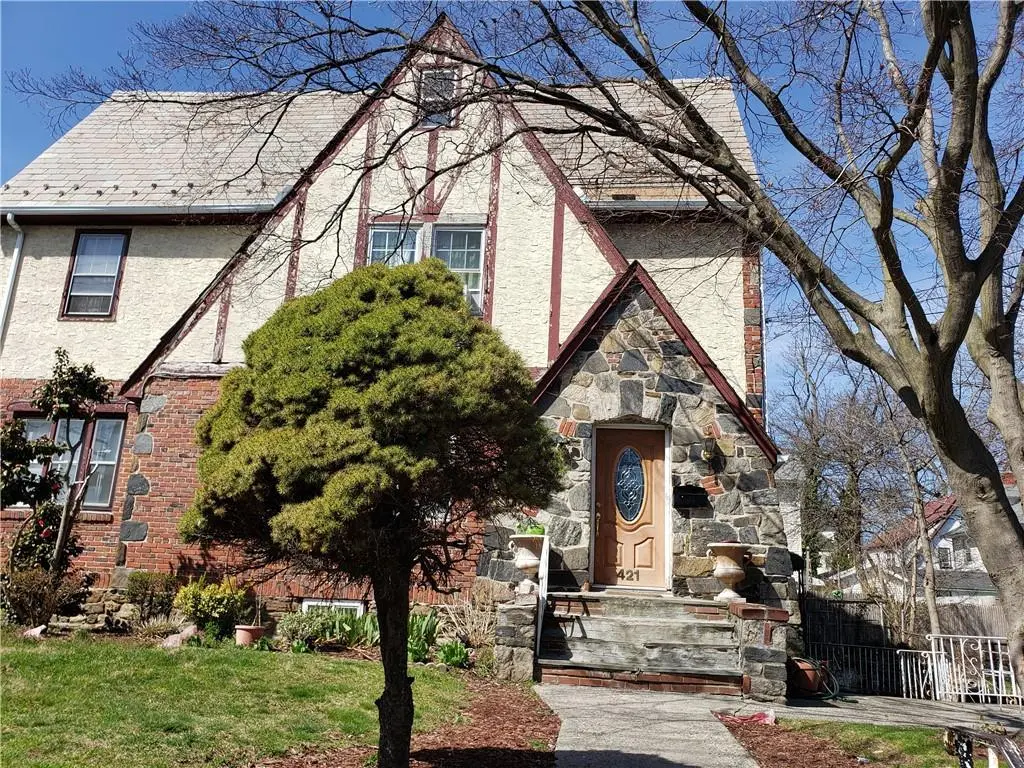
289 Bedford Ave · Mount Vernon, NY
Flood risk 1/10 · Minimal
- FEMA flood zone
- X (unshaded)
- Chance of flooding over 30 yrs
- 0.0%
- Est. flood insurance / yr
- $507 – $1,088
Fire risk 1/10 · Minimal
- Est. fire insurance / yr
- $691 – $1,283
Heat risk 6/10 · Moderate
- Hot days now (above 98°F)
- 7 days/yr
- Hot days in 30 yrs
- 15 days/yr
Wind risk 6/10 · Moderate
- Chance of severe wind over 30 yrs
- 27.0%
Air-quality risk 5/10 · Moderate
- Unhealthy air days now
- 6 days/yr
- Unhealthy air days in 30 yrs
- 8 days/yr
Risk factors via First Street. Map © Google.
Why this score? — see what drove the D grade
The composite is a weighted blend of 9 inputs, each scored 0–100. Each bar is that input's sub-score; the figure is the points it added to the 100-point composite (weight × sub-score).
- Cash flow +13.5/30.0
- ARV discount +7.5/15.0
- 1% rule +4.5/10.0
- DSCR +4.1/10.0
- Schools +3.7/10.0
- Livability +3.6/5.0
- Rent growth +2.5/5.0
- Condition / age +2.5/5.0
- Appreciation +0.0/10.0
$799,000
🖨 Deal sheet (PDF) 📄 Offer letter ✓ Due diligence
Multi-family units
County records classify this as Multi-Family (2-4 Unit). Listing-text estimate: 2 units. confirmed
Listing remarks
This incredible 2 Family home sits on the corner of Bedford Ave and East 4th St. Apartment #1 Address 421 East 4th Street: This gem features 4 bedrooms, 2.5 baths, a formal dining room, a versatile office/den, a fantastic eat-in kitchen (EIK), a cozy living room, and gleaming hardwood floors. Plus, there's a finished attic, a finished basement, and a two-car attached garage. Apartment#2 Address 289 Bedford Ave: Equally impressive, this beauty offers similar living space with an unfinished basement and unfinished attic. Driveway. Sold as is!
Key facts
- 2 garage spots
- Built 1924
- Listed 121 days
Neighborhood map
What this means for you Summary
Snapshot
- This is a 2 × 4.0-bed/2.5-bath units multifamily listed at $799k.
Deal economics
- At list price, monthly cash flow is $25 ($302/yr) — positive. Per door: $13/mo.
- The deal already cash-flows at list — no discount required.
- To meet the 1% rule (rent ≥ 1% of price), the offer needs to be $760k (4.8% below list).
- Recommended offer: $703k (12.0% below list) — sets the bar for market timing.
- Cap rate 6.3% vs local median 5.2% in Mount Vernon — meaningfully above typical; check what's discounted (condition, days-on-market, listing class) to confirm the premium yield is real.
Location & tenants
- Location reads 71/100 on livability (#397 in NY) — a middle-class / working-renter tenant base. Strengths: commute A+, health & safety A, employment B; Watch: crime D-, cost of living F.
- Mount Vernon School District (suburban): math 35% / reading 50% proficiency, ranked #485 of 590 in NY (top 82%) — families likely to look elsewhere, expect single-tenant / working-renter base with shorter leases; 62% free/reduced lunch — lower-income household profile, screen leases tightly.
- Zoned schools: Graham School (math 17% / reading 42%, grade F, #1,729 of 2,108 statewide, top 84%, 425 students, 74% FRL); Benjamin Turner Middle School (math 8% / reading 32%, grade F, #678 of 729 statewide, top 94%, 196 students, 71% FRL); Mount Vernon High School (math 54% / reading 75%, grade B-, #776 of 1,100 statewide, top 73%, 1,094 students, 76% FRL).
- Market conditions: 47 active listings in the ZIP; 954 units permitted in Westchester County in 2024 (649 in 5+ unit buildings).
Forward outlook
- Local home prices are declining (-3.0%/yr); year-one equity from $6k of loan paydown is wiped out by about $24k of value loss. Plan a longer hold.
- Westchester County population projected at +10% by 2050 — modest demand growth; plan on rents tracking national, not racing it.
Negotiation context
- It's been on market 121 days — a 12% lower offer ($703k) is reasonable based on typical stale-listing flexibility.
- 5 sale attempts since 31y ago with the ask held roughly flat each time — persistent listings suggest the price (not the market) is what's stuck; bring a comps-based counter.
- Current owner paid $250k; list at $799k implies a 220% gain — meaningful room to come down on a strong offer.
Risks & watch-outs
- Watch-outs: built in 1924 — expect roof / HVAC / electrical / plumbing capex.
- Climate carrying-cost: major wind risk, 27% chance of damaging wind over 30y; extreme-heat days projected 7→15/yr by 2055 (HVAC capex compounding) — expect insurance premiums to compound above CPI over the hold.
Questions for the listing agent
- It's been on market 121 days. Have you received any prior offers? Is the seller open to a 12% concession, seller financing, or rate buy-down credit?
- Can we see the unit-by-unit rent roll, current vacancy, and any below-market leases? What's the average tenancy length?
- What capital expenditures (roof, boiler, parking lot, exteriors) have been made in the last 5 years, and what's planned in the next 2?
- Built in 1924 — when were the roof, HVAC, electrical panel, plumbing, and water heater last replaced?
- Why hasn't it sold? Are there any deal-killer items the seller is aware of (foundation, flood, title, zoning, code violations)?
- Is there a deadline driving the sale (1031 exchange, divorce, estate, relocation)? That informs how much negotiation room exists.
- Crime grade is D in this area — have there been break-ins, vandalism, or insurance claims at this property in the last 3 years? What carrier currently insures it and at what premium?
- The area grade is low — what's the realistic commute time and amenity access for the typical tenant pool here? Any planned neighborhood developments (good or bad) we should know about?
- What's the average days-on-market for RENTAL listings here right now (not sales)? A rising rental-DOM trend means longer vacancies and softer asking-rent achievability than the comps imply.
- What's the recent tenant-quality profile in this submarket — average credit score on applications, eviction rate, late-payment / NSF rate, and stable-employment percentage? A property-management company in the area should have these aggregated.
- How much new apartment / multifamily construction is in the pipeline within 1–3 miles? Heavy new supply (>2% of stock underway) typically softens rents 12–24 months out; light construction supports rent growth.
Investment metrics
- 1% rule
- 0.95% ✗
- Cap rate
- 6.33%
- Cash-on-cash
- 0.13%
- DSCR
- 1.01
- GRM
- 8.8
CMA / ARV
No comps found within radius.
Projected returns pro-forma
-3.0% appreciation · 3.0% rent growth · sell at horizon
- IRR
- -16.0%
- Equity multiple
- 0.43×
- Total profit
- $-127,474
- Equity at exit
- $119,133
- IRR
- -7.6%
- Equity multiple
- 0.52×
- Total profit
- $-107,326
- Equity at exit
- $69,083
Cash invested: $223,720 (down + closing). Projections, not guarantees.
Landlord ↔ Tenant lean methodology
- Overall (STATE)
- 15 Strongly Tenant-Friendly
- State New York
- 15 Strongly Tenant-Friendly · D+10
- County
- — inherits STATE
- City
- — inherits STATE
ZIP-level market 10553
- Active inventory
- 47
- Price-to-rent
- 17.5×
Monthly cashflow live
- Estimated rent
- $7,604 medium interval (Pro) →
- Mortgage (P&I)
- −$4,190
- Tax from tax record
- −$1,459 /mo · $17,509/yr
- Insurance
- −$333
- HOA
- −$0
- Vacancy / Maint / Mgmt
- −$1,597
- Net cashflow
- $25
Break-even live
Sensitivity live
| Price | -10% $477 | -5% $251 | +0% $25 | +5% $-201 | +10% $-427 |
|---|---|---|---|---|---|
| Rent | -10% $-576 | -5% $-275 | +0% $25 | +5% $325 | +10% $626 |
| Rate | -1.0pp $428 | -0.5pp $228 | base $25 | +0.5pp $-182 | +1.0pp $-393 |
2-unit breakdown (identical units grouped — click to expand)
| Units | Beds | Baths | Est. rent |
|---|---|---|---|
| 2× units | 4.0 | 2.5 | $7,604 |
| #1 | 4.0 | 2.5 | $3,802 |
| #2 | 4.0 | 2.5 | $3,802 |
| Total (2 units) | $7,604 | ||
UW: 25.0% down · 7.5% · 30yr · 1.5% tax · 5.0% vac · 8.0% maint · 8.0% mgmt
Financing live
Cash to close
- Down payment
- $199,750
- Closing costs
- $23,970
- Reserves months
- —
- Total cash needed
- —
Loan-product check · same deal, 3 products live
Conventional
25% down · 7.5% · 30yr
- Down + closing
- —
- Monthly P&I
- —
- Monthly cashflow
- —
- DSCR
- —
- Eligible?
- —
Personal DTI + credit; lowest rate.
DSCR
20% down · 8.5% · 30yr
- Down + closing
- —
- Monthly P&I
- —
- Monthly cashflow
- —
- DSCR
- —
- Eligible?
- —
No personal income docs; deal must DSCR.
Hard money
10% down · 12.0% · 12mo
- Down + closing
- —
- Monthly P&I
- —
- Monthly cashflow
- —
- DSCR
- —
- Eligible?
- —
Short-term bridge; refi at stabilization.
Listing history 12 events
-
2026-02-11status Pending
-
2026-02-10status Active
-
2025-06-16status Pending
-
2025-02-17$799,000 Active
-
2025-02-14historical $799,000
-
2022-12-27$999,000 Active
-
2022-09-14status Pending
-
2022-09-13historical
-
2022-04-22$999,000 Active
-
1996-09-20price $269,000
-
1996-09-20soldstatus $250,000
-
1995-12-03$250,000
ⓘ Source: listings_history table (triggers on properties + properties_extension) + one-shot
backfill from property_details.listing_events for pre-trigger history.
Tax reassessment forecast NY · Partial reset (capped growth)
- Current annual tax
- $17,509 · $1,459/mo
- Projected year-2 tax
- $17,509 · $1,459/mo
- Expected delta
- $0/yr ($0/mo · 0.0%)
ⓘ Screening estimate from a state-policy table — verify with the county assessor before closing.
Climate risk First Street
- Flood 1/10 Low FEMA zone X (unshaded) · 0% chance over 30 yrs
- Wildfire 1/10 Low
- Heat 6/10 Major 7 d/yr ≥98°F today · 15 d/yr by 30 yrs out
- Wind 6/10 Major 27% chance of damaging wind over 30 yrs
- Air quality 5/10 Major 6 unhealthy d/yr today · 8 by 30 yrs out
Nearby sold comps map
Loading sold comps map…
Walkable amenities ~0.75 mi
Loading nearby amenities…
Taxation est. · year 1
- Rental income
- $91,248
- − Mortgage interest
- −$44,756
- − Property taxes
- −$17,509
- − Insurance
- −$3,995
- − Repairs & maintenance
- −$7,300
- − Management
- −$7,300
- − Depreciation
- −$23,244
- Taxable loss
- −$12,856
- Est. tax savings @ 24.0%
- +$3,085
- After-tax cash flow
- $3,387/yr
For passive investors: Depreciation is non-cash, so a rental often shows a tax loss while cash-flowing — sheltering income. Rental losses are passive: they offset passive income freely, and up to $25,000/yr can offset ordinary (W-2) income if you actively participate and your MAGI is under $100k (phasing out to $0 by $150k); unused losses carry forward. On sale, claimed depreciation is recaptured at up to 25%, and gains may owe capital-gains tax (a 1031 exchange can defer both). Figures are a year-1 estimate at your 24.0% rate — not tax advice; consult a CPA.
Schools (NCES district)
- District
- Mount Vernon School District
- NCES district ID
- 3620100
- Math proficiency
- 35% ▼ -3.00%
- Reading proficiency
- 50% ▲ 6.00%
- Median HH income
- $50,890
- Composite
- 36.59/100
- National rank
- #4631
- State rank
- #485 of 590 in NY
Livability — Mount Vernon
- Score
- 71/100
- State rank
- #397
- US rank
- #6876
Category grades
Schools grade is shown separately in the Schools card above.
Census & demographics
- Census place
- Mount Vernon, NY
- City population
- 61,313
- Population (ZIP)
- 10,815
Population outlook (Westchester County) Hauer SSP2
- Today (2025)
- 1,028,035 people
- By 2030
- 1,051,636 · +2.3%
- By 2040
- 1,098,520 · +6.9%
- By 2050
- 1,136,044 · +10.5%
- By 2075
- 1,196,925 · +16.4%
- By 2100
- 1,175,147 · +14.3%
Race, ethnicity, and origin ACS 2023
- Neighborhood character
- Predominantly Black (67%)
- Race & ethnicity
- Black 67% Hispanic / Latino 15% White 12% Two or more races 8%
- Hispanic origin (detail)
- Puerto Rican 6% Dominican 3%
- Common ancestry
- Russian 7% Lithuanian 1% Romanian 1%
- Foreign-born
- 35% · Canada, Jamaica, Mexico
- Languages at home
- 76% English-only · Spanish 11% Other Indo-European 6% German/W. Germanic 1%
Political lean MEDSL · Westchester
- 2024 margin
- Strong D (+26.3) · D 63.1% · R 36.9%
- 2008→2024 swing
- -1.3pp toward R · 2008: 27.6pp · 2024: 26.3pp
- All cycles
- 2024: D+26.3 2020: D+36.3 2016: D+32.8 2012: D+22.2 2008: D+27.6
Not yet ingested
- Civics
- —
Market trends
- HPI YoY
- ▼ -114.74%
- Current HPI
- 206.233
- Rent YoY
- —
- Metro
- —
- State GDP YoY
- ▲ 2.60%
- F500 in state
- 92
Industry mix (Fortune 500 HQ in NY)
| Industry | F500 HQs | Revenue |
|---|---|---|
| Financial Services | 10 | $950B |
|
||
| Consumer Goods | 9 | $162B |
|
||
| Insurance | 4 | $225B |
|
||
| Telecommunications | 2 | $144B |
|
||
| Pharmaceuticals | 2 | $112B |
|
||
| Media / Entertainment | 2 | $69B |
|
||
Price history
+219.6% since first listed12 events — show timeline
- 2026-02-11 Pending — OneKey® MLS as Distributed by MLS Grid
- 2026-02-10 Relisted — OneKey® MLS as Distributed by MLS Grid
- 2025-06-16 Pending — OneKey® MLS as Distributed by MLS Grid
- 2025-02-17 Listed $799,000 OneKey® MLS as Distributed by MLS Grid
- 2025-02-14 Coming Soon $799,000 OneKey® MLS as Distributed by MLS Grid
- 2022-12-27 Listed $999,000 OneKey® MLS as Distributed by MLS Grid
- 2022-09-14 Pending — OneKey® MLS as Distributed by MLS Grid
- 2022-09-13 Listing Removed — OneKey® MLS as Distributed by MLS Grid
- 2022-04-22 Listed $999,000 OneKey® MLS as Distributed by MLS Grid
- 1996-09-20 Sold (MLS) $250,000 HGMLS
- 1996-09-20 Price Changed $269,000 HGMLS
- 1995-12-03 Listed $250,000 HGMLS
Property tax history
+3.5%/yrLatest (2025): $17,509 · +2.9% YoY. Source: county tax records.
Cash-flow waterfall
monthlySold comps — $/sqft
last 12 mo · ≤1 miLoading sold comps…