 Duplex
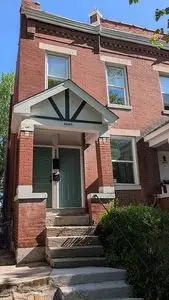
4265 Botanical Ave · St. Louis, MO
Flood risk 1/10 · Minimal
- FEMA flood zone
- X (unshaded)
- Chance of flooding over 30 yrs
- 0.0%
- Est. flood insurance / yr
- $473 – $860
Fire risk 1/10 · Minimal
- Est. fire insurance / yr
- $1,054 – $1,958
Heat risk 5/10 · Moderate
- Hot days now (above 108°F)
- 6 days/yr
- Hot days in 30 yrs
- 19 days/yr
Wind risk 2/10 · Minimal
- Chance of severe wind over 30 yrs
- 1.0%
Air-quality risk 3/10 · Minor
- Unhealthy air days now
- 3 days/yr
- Unhealthy air days in 30 yrs
- 4 days/yr
Risk factors via First Street. Map © Google.
Why this score? — see what drove the D grade
The composite is a weighted blend of 9 inputs, each scored 0–100. Each bar is that input's sub-score; the figure is the points it added to the 100-point composite (weight × sub-score).
- Cash flow +14.0/30.0
- ARV discount +10.6/15.0
- DSCR +4.2/10.0
- Rent growth +4.1/5.0
- 1% rule +3.1/10.0
- Livability +2.5/5.0
- Condition / age +2.5/5.0
- Schools +1.2/10.0
- Appreciation +0.0/10.0
$325,000
🖨 Deal sheet 📄 Offer letter ✓ Due diligence
Multi-family units
County records classify this as Multi-Family (2-4 Unit). Listing-text estimate: 2 units. confirmed
Listing remarks MLS
2-family flat is a must see! Fresh paint, nice, large kitchen. There is a nice fenced yard. All rooms are large. washer & dryer included. You will be 1 block from Tower Grove Park & about 1 block from the Botanical Gardens. This is a very convenient location! 4265 Botanical
Key facts
- Quiet cul-de-sac
- Historic character
- Central air
Tags
Property features AI
Finance
- Other: Two-unit building (2 total units); Above-grade finished area approximately 1,716; No pool
Exterior
- Utilities: Public water; Sewer connected; Electricity connected (Ameren)
- Home design: Residential income property (2–4 units); Two levels; Neighborhood: Shaw
- Construction: Brick and stone construction; Stone foundation; Built with shingle roof not specified
- Exterior features: Covered front porch; Chain link and wood fencing
Interior
- Kitchen: Dishwasher; Free-standing electric range; Free-standing gas range; Refrigerator; Free-standing refrigerator
- Bedrooms: Two 1-bedroom units (each unit has 1 bedroom)
- Flooring: Ceramic tile; Wood
- Bathrooms: Each unit includes 1 bathroom
- Heating & cooling: Forced air heating; Central air conditioning
- Interior features: Insulated windows; Full unfinished basement
- Laundry & utility: Washer; Dryer; Gas water heater
Neighborhood map
What this means for you Summary
Snapshot
- This is a 2 × 2-bed/2.0-bath units multifamily listed at $325k.
Deal economics
- At list price, monthly cash flow is $41 ($494/yr) — positive. Per door: $21/mo.
- The deal already cash-flows at list — no discount required.
- To meet the 1% rule (rent ≥ 1% of price), the offer needs to be $263k (19.2% below list).
- Recommended offer: $263k (19.2% below list) — sets the bar for 1% rule.
- Cap rate 6.4% vs local median 5.0% in St. Louis — meaningfully above typical; check what's discounted (condition, days-on-market, listing class) to confirm the premium yield is real.
Location & tenants
- Location reads: area grade D — affects rentability + tenant quality, not the cash-flow math above.
- St. Louis City (urban): math 10% / reading 18% proficiency, ranked #312 of 324 in MO (top 96%) — low school quality limits family demand, transient renter base, plan for 1-2y turnover; 80% free/reduced lunch — lower-income household profile, screen leases tightly.
- Zoned schools: Mason Elem. (math 22% / reading 37%, grade F, #813 of 1,115 statewide, top 75%, 389 students, 99% FRL); Roosevelt High (math 2% / reading 8%, grade F, #517 of 521 statewide, top 100%, 460 students, 99% FRL) — zoned schools average 99% FRL vs 80% district-wide (19 pts higher); higher-poverty schools than district average — tighter screening recommended.
- Market conditions: Rents rising fast (+6.2%/yr); 98 active listings in the ZIP; 24 comparable units currently listed for rent nearby; rentals at typical pace (median 14d on market — plan ~3-4 weeks tenant-placement turnaround); solid renter incomes; 294 units permitted in St. Louis city in 2024 (227 in 5+ unit buildings).
- This rent runs 39% of the median local income ($82k/yr) — at the standard rent-burdened threshold; future hikes will face affordability resistance.
Forward outlook
- Local home prices are declining (-3.0%/yr); year-one equity from $2k of loan paydown is wiped out by about $10k of value loss. Plan a longer hold.
- St. Louis County population projected to shrink 6% by 2050 — rents likely to lag national; underwrite the cash flow, not the appreciation.
Negotiation context
- Only 2 days on market — expect competitive offers; lowballing is unlikely to land.
- 3 sale attempts with the ask held roughly flat each time — persistent listings suggest the price (not the market) is what's stuck; bring a comps-based counter.
Risks & watch-outs
- Watch-outs: built in 1906 — expect roof / HVAC / electrical / plumbing capex.
- Climate carrying-cost: extreme-heat days projected 6→19/yr by 2055 (HVAC capex compounding) — expect insurance premiums to compound above CPI over the hold.
Questions for the listing agent
- Can we see the unit-by-unit rent roll, current vacancy, and any below-market leases? What's the average tenancy length?
- What capital expenditures (roof, boiler, parking lot, exteriors) have been made in the last 5 years, and what's planned in the next 2?
- Built in 1906 — when were the roof, HVAC, electrical panel, plumbing, and water heater last replaced?
- Is there a deadline driving the sale (1031 exchange, divorce, estate, relocation)? That informs how much negotiation room exists.
- The area grade is low — what's the realistic commute time and amenity access for the typical tenant pool here? Any planned neighborhood developments (good or bad) we should know about?
- What's the average days-on-market for RENTAL listings here right now (not sales)? A rising rental-DOM trend means longer vacancies and softer asking-rent achievability than the comps imply.
- What's the recent tenant-quality profile in this submarket — average credit score on applications, eviction rate, late-payment / NSF rate, and stable-employment percentage? A property-management company in the area should have these aggregated.
- How much new apartment / multifamily construction is in the pipeline within 1–3 miles? Heavy new supply (>2% of stock underway) typically softens rents 12–24 months out; light construction supports rent growth.
Investment metrics
- 1% rule
- 0.81% ✗
- Cap rate
- 6.44%
- Cash-on-cash
- 0.54%
- DSCR
- 1.02
- GRM
- 10.3
CMA / ARV
- ARV (median comp)
- $348,709
- List price
- $325,000
- Delta
- -4.22%
- Verdict
- FAIR
- Comps
- 20 within 1.0 mi
Show comp detail 2 sales within ~0.75 mi
| Address | Dist | Beds/Ba | Sqft | Sold | Price | $/sf | Match |
|---|---|---|---|---|---|---|---|
| 4250 Wyoming St | 0.71mi | 4/4.0 | 1,528 (-11%) | 7mo | $249,000 | $163 | 35 |
| 2705 S Kingshighway Blvd | 0.66mi | 4/2.0 | 1,944 (+13%) | 21mo | $275,000 | $141 | 29 |
Match score weights: distance 35% · size 25% · config 20% · recency 20%. Top-matched comps best support the ARV.
Projected returns pro-forma
-3.0% appreciation · 6.24% rent growth · sell at horizon
- IRR
- -12.2%
- Equity multiple
- 0.55×
- Total profit
- $-41,293
- Equity at exit
- $48,459
- IRR
- 0.8%
- Equity multiple
- 1.06×
- Total profit
- $5,830
- Equity at exit
- $28,100
Cash invested: $91,000 (down + closing). Projections, not guarantees.
Landlord ↔ Tenant lean methodology
- Overall (STATE)
- 81 Strongly Landlord-Friendly
- State Missouri
- 81 Strongly Landlord-Friendly · R+10
- County
- — inherits STATE
- City
- — inherits STATE
ZIP-level market 63110
- Rents YoY
- 6.2%
- Active inventory
- 98
- Price-to-rent
- 20.6×
Monthly cashflow live
- Estimated rent
- $2,627 high interval (Pro) →
- Mortgage (P&I)
- −$1,704
- Tax from tax record
- −$194 /mo · $2,333/yr
- Insurance
- −$135
- HOA
- −$0
- Vacancy / Maint / Mgmt
- −$552
- Net cashflow
- $41
Break-even live
2-unit breakdown (identical units grouped — click to expand)
| Units | Beds | Baths | Est. rent |
|---|---|---|---|
| 2× units | 2 | 2 | $2,626 |
| #1 | 2 | 2 | $1,313 |
| #2 | 2 | 2 | $1,313 |
| Total (2 units) | $2,627 | ||
UW: 25.0% down · 7.5% · 30yr · 1.5% tax · 5.0% vac · 8.0% maint · 8.0% mgmt
Financing live
Cash to close
- Down payment
- $81,250
- Closing costs
- $9,750
- Reserves months
- —
- Total cash needed
- —
Loan-product check · same deal, 3 products live
Conventional
25% down · 7.5% · 30yr
- Down + closing
- —
- Monthly P&I
- —
- Monthly cashflow
- —
- DSCR
- —
- Eligible?
- —
Personal DTI + credit; lowest rate.
DSCR
20% down · 8.5% · 30yr
- Down + closing
- —
- Monthly P&I
- —
- Monthly cashflow
- —
- DSCR
- —
- Eligible?
- —
No personal income docs; deal must DSCR.
Hard money
10% down · 12.0% · 12mo
- Down + closing
- —
- Monthly P&I
- —
- Monthly cashflow
- —
- DSCR
- —
- Eligible?
- —
Short-term bridge; refi at stabilization.
Rent comps 24 comps
| Address | Beds | Baths | Sqft | Rent | $/sqft | DOM | Units | Dist |
|---|---|---|---|---|---|---|---|---|
| 4228 Cleveland Ave Unit 1031486P St. Louis, MO | 4.0 | 1.0 | 1496 | $1,868 | $1.25 | 1d | 1 | 0.14mi |
| 2053 Alfred Ave St. Louis, MO | 4.0 | 3.0 | 1768 | $1,975 | $1.12 | 43d | 1 | 0.36mi |
| 4609 Cleveland Ave St. Louis, MO | 3.0 | 2.5 | 1400 | $2,200 | $1.57 | 21d | 1 | 0.52mi |
| 3925 Shenandoah Ave St. Louis, MO | 3.0 | 1.0 | 1250 | $1,500 | $1.20 | 2d | 1 | 0.54mi |
| 4000 De Tonty St Unit 3W St. Louis, MO | 3.0 | 1.0 | 1200 | $1,630 | $1.36 | 1d | 1 | 0.67mi |
| 3911 Shaw Blvd Saint Louis, MO | 3.0 | 1.5 | 1432 | $1,885 | $1.32 | 4d | 1 | 0.74mi |
| 3802 Flad Ave St. Louis, MO | 3.0 | 1.0 | 1350 | $1,499 | $1.11 | 7d | 1 | 0.74mi |
| 3850 De Tonty St Apt A St. Louis, MO | 3.0 | 1.0 | 1200 | $1,725 | $1.44 | 21d | 1 | 0.82mi |
| 3850 De Tonty St Unit 3850A St. Louis, MO | 3.0 | 1.0 | 1200 | $1,695 | $1.41 | 1d | 1 | 0.82mi |
| 3850 De Tonty St Unit 3852 St. Louis, MO | 3.0 | 1.0 | 1200 | $1,650 | $1.38 | 21d | 1 | 0.82mi |
| 3850 De Tonty St Unit 3852A St. Louis, MO | 3.0 | 1.0 | 1200 | $1,695 | $1.41 | 14d | 1 | 0.82mi |
| 3861 McRee Ave Unit 3865 St. Louis, MO | 3.0 | 2.5 | 1556 | $1,845 | $1.19 | 17d | 1 | 0.91mi |
| 3640 Shaw Blvd Unit 2W St. Louis, MO | 3.0 | 1.0 | 1200 | $1,299 | $1.08 | 11d | 1 | 0.92mi |
| 3628 Shaw Blvd Unit 1F St. Louis, MO | 3.0 | 2.0 | 1350 | $1,995 | $1.48 | 7d | 1 | 0.94mi |
| 3908 McDonald Ave Saint Louis, MO | 3.0 | 2.0 | 1927 | $2,500 | $1.30 | 4d | 1 | 0.97mi |
| 3901 Folsom Ave Unit 3909 St. Louis, MO | 3.0 | 2.0 | 1635 | $1,845 | $1.13 | 17d | 1 | 0.99mi |
| 3663 McRee Ave Saint Louis, MO | 3.0 | 1.5 | 1714 | $2,750 | $1.60 | 17d | 1 | 1.03mi |
| 3628 Wyoming St Unit 2F St. Louis, MO | 4.0 | 1.0 | 1700 | $1,950 | $1.15 | 43d | 1 | 1.03mi |
| 3458 Giles Ave Saint Louis, MO | 3.0 | 2.5 | 2204 | $2,400 | $1.09 | 7d | 1 | 1.22mi |
| 3526 S Spring Ave Saint Louis, MO | 4.0 | 2.0 | 2244 | $2,877 | $1.28 | 43d | 1 | 1.26mi |
| 1129 S Kingshighway Blvd Saint Louis, MO | 3.0 | 2.0 | 1287 | $1,999 | $1.55 | 17d | 1 | 1.31mi |
| 4041 Chouteau Ave St. Louis, MO | 3.0 | 1.0–2.0 | 990 | $3,298 | $3.33 | 1d | 39 | 1.37mi |
| 4041 Chouteau Ave St. Louis, MO | 3.0 | 1.0–2.0 | 990 | $3,095 | $3.12 | 14d | 53 | 1.37mi |
| 3411 Cherokee St St. Louis, MO | 4.0 | 2.0 | 1568 | $1,850 | $1.18 | 43d | 1 | 1.38mi |
Listing history 18 events
-
2026-06-18days on market $325,000 Active 2 DOM
-
2026-06-16remarks 682-char remark
-
2026-06-16pricedays on market $325,000 Active 1 DOM
-
2026-06-15days on market $334,000 Active 34 DOM
-
2026-06-13days on market $334,000 Active 32 DOM
-
2026-06-09days on market $334,000 Active 28 DOM
-
2026-06-08days on market $334,000 Active 27 DOM
-
2026-06-08days on market $334,000 Active 26 DOM
-
2026-06-05days on market $334,000 Active 23 DOM
-
2026-06-03days on market $334,000 Active 22 DOM
-
2026-06-02days on market $334,000 Active 21 DOM
-
2026-06-01days on market $334,000 Active 20 DOM
-
2026-06-01days on market $334,000 Active 19 DOM
-
2026-05-13price $334,000 286-char remark
Show marketing remark (286 chars)
2-family flat is a must see! Fresh paint, nice, large kitchen. There is a nice fenced yard. All rooms are large. washer & dryer included. You will be 1 block from Tower Grove Park & about 1 block from the Botanical Gardens. This is a very convenient location! 4265 Botanical
-
2026-05-12$349,000 Active 286-char remark
Show marketing remark (286 chars)
2-family flat is a must see! Fresh paint, nice, large kitchen. There is a nice fenced yard. All rooms are large. washer & dryer included. You will be 1 block from Tower Grove Park & about 1 block from the Botanical Gardens. This is a very convenient location! 4265 Botanical
-
2025-04-28historical
-
2025-04-13price $625,000
-
2025-03-08$630,000 Active
ⓘ Source: listings_history table (triggers on properties + properties_extension) + one-shot
backfill from property_details.listing_events for pre-trigger history.
Tax reassessment forecast MO · Resets to sale price
- Current annual tax
- $2,333 · $194/mo
- Projected year-2 tax
- $3,152 · $263/mo
- Expected delta
- +$819/yr (+$68/mo · 35.1%)
ⓘ Screening estimate from a state-policy table — verify with the county assessor before closing.
Climate risk First Street
- Flood 1/10 Low FEMA zone X (unshaded) · 0% chance over 30 yrs
- Wildfire 1/10 Low
- Heat 5/10 Major 6 d/yr ≥108°F today · 19 d/yr by 30 yrs out
- Wind 2/10 Low 100% chance of damaging wind over 30 yrs
- Air quality 3/10 Moderate 3 unhealthy d/yr today · 4 by 30 yrs out
Nearby sold comps map
Loading sold comps map…
Walkable amenities ~0.75 mi
Loading nearby amenities…
Taxation est. · year 1
- Rental income
- $31,524
- − Mortgage interest
- −$18,205
- − Property taxes
- −$2,333
- − Insurance
- −$1,625
- − Repairs & maintenance
- −$2,522
- − Management
- −$2,522
- − Depreciation
- −$9,455
- Taxable loss
- −$5,138
- Est. tax savings @ 24.0%
- +$1,233
- After-tax cash flow
- $1,727/yr
For passive investors: Depreciation is non-cash, so a rental often shows a tax loss while cash-flowing — sheltering income. Rental losses are passive: they offset passive income freely, and up to $25,000/yr can offset ordinary (W-2) income if you actively participate and your MAGI is under $100k (phasing out to $0 by $150k); unused losses carry forward. On sale, claimed depreciation is recaptured at up to 25%, and gains may owe capital-gains tax (a 1031 exchange can defer both). Figures are a year-1 estimate at your 24.0% rate — not tax advice; consult a CPA.
Schools (NCES district)
- District
- St. Louis City
- NCES district ID
- 2929280
- Math proficiency
- 10% ▼ -6.00%
- Reading proficiency
- 18% ▼ -3.00%
- Median HH income
- $35,685
- Composite
- 11.54/100
- National rank
- #9699
- State rank
- #312 of 324 in MO
Livability — St. Louis
No livability data for this city. (Only ~50 U.S. cities are tracked.)
Census & demographics
- Census place
- St. Louis, MO
- County
- Saint Louis City · 254,015 people
- City population
- 283,259
- Metro
- St. Louis, MO-IL
- Population (ZIP)
- 17,645
- Household income
- $81,655
- Rent vs Own
- Severe rent burden
- 921.0
Population outlook (St. Louis County) Hauer SSP2
- Today (2025)
- 315,737 people
- By 2030
- 313,865 · -0.6%
- By 2040
- 305,439 · -3.3%
- By 2050
- 296,529 · -6.1%
- By 2075
- 271,028 · -14.2%
- By 2100
- 255,359 · -19.1%
Race, ethnicity, and origin ACS 2023
- Neighborhood character
- Majority White (65%)
- Race & ethnicity
- White 65% Black 19% Two or more races 9% Hispanic / Latino 8% Asian 4%
- Hispanic origin (detail)
- Mexican 5%
- Common ancestry
- Lithuanian 5% Slovak 3% Italian 3%
- Foreign-born
- 6% · Canada, China, South Korea
- Languages at home
- 91% English-only · Spanish 3% French/Haitian/Cajun 1% Other Asian/Pacific 1%
Political lean MEDSL · St. Louis
- 2024 margin
- Solid D (+64.7) · D 81.4% · R 16.7% · Other 2.0%
- 2008→2024 swing
- -3.5pp toward R · 2008: 68.2pp · 2024: 64.7pp
- All cycles
- 2024: D+64.7 2020: D+66.2 2016: D+63.7 2012: D+66.6 2008: D+68.2
Not yet ingested
- Civics
- —
Market trends
- HPI YoY
- ▼ -206.93%
- Current HPI
- 342.2466
- Rent YoY
- ▲ 6.24%
- Metro
- St. Louis, MO-IL
- State GDP YoY
- ▲ 1.84%
- F500 in state
- 20
Industry mix (Fortune 500 HQ in MO)
| Industry | F500 HQs | Revenue |
|---|---|---|
| Healthcare | 1 | $163B |
|
||
| Insurance | 1 | $21B |
|
||
| Industrial Technology | 1 | $17B |
|
||
| Retail | 1 | $16B |
|
||
| Industrial Distribution | 1 | $10B |
|
||
| Utilities | 1 | $9B |
|
||
Price history
-48.4% since first listed6 events — show timeline
- 2026-06-16 Listed $325,000 MARIS as Distributed by MLS Grid
- 2026-05-13 Price Changed $334,000 FSBO.com
- 2026-05-12 Listed $349,000 FSBO.com
- 2025-04-28 Delisted — MARIS as Distributed by MLS Grid
- 2025-04-13 Price Changed $625,000 MARIS as Distributed by MLS Grid
- 2025-03-08 Listed $630,000 MARIS as Distributed by MLS Grid
Property tax history
+12.8%/yrLatest (2024): $2,333 · +5.1% YoY. Source: county tax records.
Cash-flow waterfall
monthlySold comps — $/sqft
last 12 mo · ≤1 miLoading sold comps…